

Keywords: G protein, glucose, glycolysis, lactate, obesity
Abstract
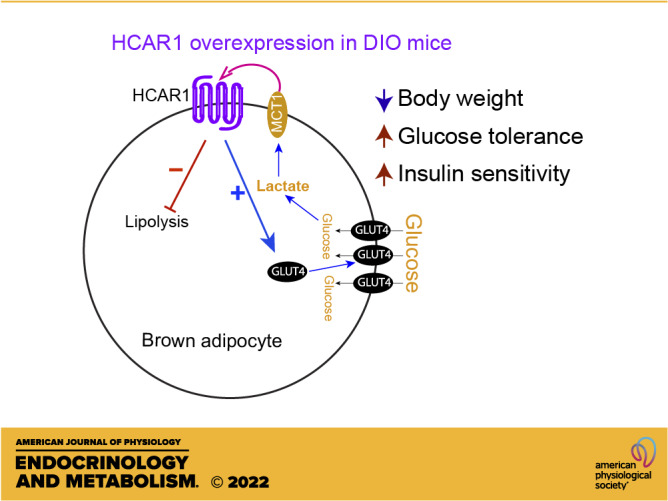
Interscapular brown adipose tissue (BAT) plays an important role in controlling glucose homeostasis. Increased glucose entry and glycolysis in BAT result in lactate production and release. The adipose tissue expresses the lactate receptor hydrocarboxylic acid receptor 1 (HCAR1), markedly downregulated in male diet-induced obese (DIO) and ob/ob mice. In this study, we examined the role of HCAR1 in BAT in controlling glucose homeostasis in male DIO mice. We overexpressed HCAR1 in BAT by injecting adeno-associated viruses (AAVs) expressing HCAR1 into the BAT pads of male DIO C57BL/6J mice. Overexpressing HCAR1 in BAT resulted in augmented glucose uptake by BAT in response to treatment with the HCAR1 agonist. HCAR1 overexpression elevated BAT temperature associated with increased thermogenic gene expression in BAT. HCAR1 overexpression prevented body weight gain in male DIO mice. Importantly, mice overexpressing HCAR1 in BAT exhibited improved glucose tolerance and insulin sensitivity. HCAR1 overexpression upregulated the Slc2a4 gene expression and promoted GLUT4 trafficking to the plasma membrane. In addition, mice overexpressing HCAR1 displayed a decrease in hormone-sensitive lipase (HSL) phosphorylation and increased lipogenic enzyme gene expression in BAT. Unlike DIO mice, overexpressing HCAR1 in BAT of mice fed a low-fat diet did not change body weight gain and glucose homeostasis. Taken together, our results support the interpretation that HCAR1 expressed in BAT promotes glucose entry and reduces lipolysis in BAT of male DIO mice. As activation of HCAR1 in BAT restores body weight, glucose tolerance, and insulin sensitivity in male DIO mice, our study suggests that interoceptive lactate detection via HCAR1 in BAT can regulate glucose and lipid substrate utilization and/or availability to promote healthy metabolism.
NEW & NOTEWORTHY HCAR1 expressed in BAT can promote glucose entry and reduce lipolysis, resulting in body weight loss and increased insulin sensitivity. Hence, targeting HCAR1 in BAT would provide an alternative way to control body weight and euglycemia in individuals with obesity.
INTRODUCTION
Stimulation of brown adipose tissue (BAT) regulates whole body triglyceride clearance, glucose disposal, insulin sensitivity, and energy expenditure in humans (1–7). Hence, this organ is considered an important therapeutic target against obesity and diabetes in humans, although BAT represents only a small fraction of body mass. BAT takes up circulating glucose that can be used to generate heat in humans and rodents (8–13). However, the contribution of glucose to heat production in BAT remains controversial (14–16). Early studies show that lactate production accounts for a large proportion of insulin- and norepinephrine-induced glucose uptake by BAT (17, 18). In line with these early findings, cold- and β3-adrenergic receptor (β3AR)-induced activation of interscapular BAT (BAT) in mice upregulates mRNA and protein expression of the lactate dehydrogenase (LDH)-A that preferentially catalyzes pyruvate conversion to lactate (11, 19). This upregulation leads to a significant release of lactate from BAT in rodents (18, 20). Notably, a recent human study by the Stimson research group demonstrates that BAT produces and releases lactate in response to glucose entry during warm conditions (7). Hence, it is necessary to better understand the physiological role of lactate in the control of glucose and lipid metabolism in BAT.
We previously demonstrated that optogenetic stimulation of sympathetic nerves of BAT promoted nonshivering thermogenesis and glucose uptake by BAT in mice (11). In the presence of the LDH inhibitor, however, optogenetic stimulation of sympathetic nerves of BAT failed to increase BAT temperature and lower blood glucose levels, suggesting that LDH activity appears to be essential for the acute activation of BAT thermogenesis (11). BAT expresses the monocarboxylate transporter 1 (MCT1) that catalyzes the rapid transport of monocarboxylates such as lactate, pyruvate, and ketone bodies in the mitochondrial and plasma membrane (11, 21, 22). Increased sympathetic tone to BAT upregulates expression of the Mct1 mRNA (11). The genetic and pharmacological blockade of MCT1 inhibits the acute effect of optogenetic stimulation of sympathetic nerves of BAT on BAT thermogenesis and glucose uptake (11). These prior findings suggest that intracellular glycolysis and lactate production in BAT are important and required for the adrenergic activation of nonshivering thermogenesis.
In addition to its role as fuel, it has been shown that lactate acts as an interoceptive signaling molecule with autocrine-, paracrine-, and endocrine-like effects in the white adipose tissue (WAT) (23, 24). In fact, MCT1 can bidirectionally transport lactate across the plasma membrane (22). Of particular interest is that the lactate receptor hydrocarboxylic acid receptor 1 (HCAR1) is primarily expressed in white and brown adipocytes in both rodents and humans (23, 25, 26). Activating HCAR1 by lactate inhibits lipolysis and loss of the Hcar1 gene impairs the antilipolytic effect in the adipose tissue (25). In addition, HCAR1 signaling improves insulin-mediated anti-lipolysis in white adipocytes (23). We previously showed that male diet-induced obese (DIO) C57BL/6J mice exhibited a significant reduction in HCAR1 expression in BAT (27), consistent with prior studies showing that male DIO and ob/ob mice display decreased Hcar1 gene expression in the adipose tissue (28, 29). Hence, disrupted HCAR1 action in the adipose tissue could contribute to insulin resistance and metabolic dysfunction in obese animals.
In this study, we examined the role of HCAR1 in BAT in controlling glucose homeostasis in male DIO mice. Specifically, we overexpressed HCAR1 in BAT of male DIO C57BL/6J mice. HCAR1 overexpression in BAT significantly increased BAT temperature. Importantly, mice overexpressing HCAR1 in BAT were protected against DIO and exhibited improved glucose and insulin tolerance.
MATERIAL AND METHODS
Ethics Statement
All mouse care and experimental procedures were approved by the Institutional Animal Care Research Advisory Committee of the Albert Einstein College of Medicine and were performed in accordance with the guidelines described in the NIH guide for the care and use of laboratory animals. Viral injections were performed under isoflurane anesthesia.
Animals
Nine-week-old male DIO C57BL/6J mice (JAX, Stock No. 380050, IMSR_JAX:380050) were purchased from the Jackson Laboratory and fed a high-fat diet (HFD; Research Diets; Cat. No. D12492; 20% calories by carbohydrate, 20% by protein, and 60% by fat). To determine if the effect of HCAR1 is coupled with changes in nutrient availability, 9-wk-old male C57BL/6J mice were fed a low-fat diet (LFD; Research Diets; Cat. No. D12492J; 70% calories provided by carbohydrates, 20% by protein, and 10% by fat). Age-matched male mice were randomly assigned to experimental groups. Mice were housed in cages under conditions of controlled temperature (22°C) with a 12-h:12-h light-dark cycle and water provided ad libitum. Mice were euthanized by an overdose of isoflurane at the end of the experiments.
Viral Injections into BAT
Ten-week-old mice were anesthetized deeply with 3% isoflurane. A deep level of anesthesia was maintained throughout the surgical procedure. Under isoflurane anesthesia (2%), AAV5-CMV-HCAR1-GFP (Applied Biological Materials, Inc, titer, 4.69 × 10¹² GC/mL) and AAV5-CAG-GFP (Addgene; Cat. No. 37825-AAV5, titer, 4.3 × 10¹² GC/mL) viruses were bilaterally injected into the BAT pads of male C57BL/6J mice using a Hamilton syringe (4 μL per pad). At the end of the experiments, the expression of viral transgenes was confirmed by performing an RT-qPCR analysis of Hcar1 in BAT. When the viral injections missed, we excluded data. The experiment assignment was blinded to investigators who participated in viral injection, experiments, and data analyses.
Measurement of BAT Temperature
To directly measure BAT temperature, we implanted a miniature radio frequency identification (RFID) transponder with an integrated temperature biosensor [size, 2.1 mm × 13 mm, temperature accuracy, ±0.1°C at 38°C, Unified Information Devices (UID), Inc.] just underneath the BAT pads immediately after viral injections. Each cage containing 4 mice was placed on a mouse matrix plate (UID, Inc.) and the temperature data were collected every 5 s with Mouse Matrix software (version 1.1) and stored on a PC.
Measurement of Body Weight and Blood Glucose Levels
Body weight was measured weekly at 9:00 AM. Body composition for fat mass and fat-free mass was assessed by ECHO MRI at our animal physiology core. Blood samples were collected from the mouse tail, and a small drop of blood was placed on the test strip of a glucose meter. Nonfasting basal glucose levels were measured at 9:00 AM. Fasting blood glucose levels were measured after an overnight fast once at 10 wk after viral injection.
Assessment of Energy Expenditure and Locomotor Activity
Mice were individually housed in the calorimeter cages and acclimated to the respiratory chambers for at least 2 days before gas exchange measurements. Indirect calorimetry was performed for 5 days at the end of 10 wk on high-fat feeding using an open-circuit calorimetry system. O2 consumption and CO2 production were measured for each mouse at 10-min intervals over a 24-h period. Energy expenditure was calculated based on O2 consumption, CO2 consumption, and body mass. All data were analyzed with a Web-based Analysis Tool for Indirect Calorimetry Experiments CalR [version 1.3, https://calrapp.org/ (30)]. An ANCOVA analysis was performed to determine if there was a significant difference in energy expenditure between the groups.
Assessment of Glucose Tolerance and Insulin Tolerance
For glucose tolerance test, experimental and control mice at 10 wk after viral inoculation were fasted for 15 h (6:00 PM to 9:00 AM). A sterile glucose solution was intraperitoneally administered at a concentration of 2 g/kg (glucose/body weight) at time 0. The blood glucose levels were measured at 15, 30, 60, 90, and 120 min after glucose injection. Blood glucose levels versus time after glucose injection were plotted, and the area under the curve was calculated and compared between the experimental and control groups.
For insulin tolerance test, mice were fasted for 5 h (9:00 AM to 2:00 PM). Blood glucose levels were measured at 0, 15, 30, 60, 90, and 120 min following intraperitoneal injection of insulin (1 U/kg). We immediately injected glucose (2 g/kg) if the mice appeared ill due to insulin-induced hypoglycemia.
RT-qPCR Analysis
BAT tissues were homogenized in a TRIzol reagent (ThermoFisher Scientific, Cat. No. 15596-018), and the total RNA was isolated according to the manufacturer’s instructions. First-strand cDNA was synthesized using the SuperScript III First-Strand synthesis kit (ThermoFisher Scientific, Cat. No. 18080-051). qPCR was performed in sealed 96-well plates with SYBR Green I master Mix (Applied Biosystems, Cat. No. A25742) using a Quant Studio 3 (Applied Biosystems). qPCR reactions were prepared in a final volume of 20 µL containing 2 µL cDNAs, and 10 µL of SYBR Green master mix in the presence of primers at 0.5 µM. β-2 microglobulin (B2m) was used as an internal control for quantification of each sample. Amplification was performed under the following conditions: initial denaturation at 95°C for 30 s, followed by 40 cycles of denaturation at 95°C for 30 s, and annealing/extension at 60°C for 1 min. The primer sequences used are described in Table 1. The relative expression levels were determined using the comparative threshold cycle (CT), which was normalized against the CT of B2m using the ΔΔCt method.
Table 1.
List of primer sets for qPCR
| Gene | Gene Symbol | NCBI Accession | Forward (5′ to 3′) | Reverse (5′ to 3′) |
|---|---|---|---|---|
| Hydrocarboxylic acid receptor 1 | Hcar1 | NM_175520.5 | TGAGGGACTTGTCCACCTGA | CCATTGCTGCCGTAAACAGG |
| β-2 Microglobulin | B2m | NM_009735.3 | TTCAGTCGCGGTCGCTTC | AGGCCGGTCAGTGAGACAAG |
| Uncoupling protein 1 | Ucp1 | NM_009463.3 | CGTTCCAGGACCCGAGTCGCAGA | TCAGCTCTTGTTGCCGGGTTTTG |
| Proliferative-activated receptor, γ, coactivator 1α | Ppargc1α | NM_008904.2 | GACAGCTTTCTGGGTGGATT | CGCAGGCTCATTGTTGTACT |
| Deiodinase, iodothyronine, type II | Dio2 | NM_010050.4 | AATTATGCCTCGGAGAAGACCG | GGCAGTTGCCTAGTGAAAGGT |
| Solute carrier family 2, member 1 | Slc2a1 (Glut1) | NM_011400.3 | CCATGTATGTGGGAGAGGTG | TTGCCCATGATGGAGTCTAA |
| Solute carrier family 2, member 4 | Slc2a4 (Glut4) | NM_009204.2 | AAAAGTGCCTGAAACCAGAG | TCACCTCCTGCTCTAAAAGG |
| ATP citrate lyase | Acl | NM_134037.3 | CTGGTGTATCGGGACCTGT | CACAAACACTCCTGCTTCCT |
| Acetyl-coenzyme A carboxylase α | Acc1 | NM_133360.2 | CTCTGCTAGAGCTGCAGGAT | CTGGGAAACTGACACAGGAC |
| Fatty acid synthase | Fasn | NM_007988.3 | ACCTCTCCCAGGTGTGTGAC | CCTCCCGTACACTCACTCGT |
| Stearoyl-coenzyme A desaturase 1 | Scd1 | NM_009127.4 | AGAGAACTGGAGACGGGAGT | GCATCATTAACACCCCGATA |
Measurement of Plasma Leptin, Insulin, and l-Lactate
Blood samples were collected from the retro-orbital plexus with heparinized capillary tubes (ThermoFisher Scientific, Cat. No. 22–362-566) and then centrifuged at 13,000 rpm for 10 min at 4°C. Plasma leptin and insulin levels were measured using the ELISA kits (ThermoFisher Scientific, Cat. No. KMC2281 for leptin, and Mercodia, Cat. No. 10-1247-01 for insulin, respectively). Plasma l-lactate levels were measured using a colorimetric assay kit (Sigma-Aldrich, MAK065 for l-lactate).
Immunofluorescence Staining
Mice were anesthetized with isoflurane (3%) and transcardially perfused with preperfusion solution (9 g NaCl, 5 g sodium nitrate, 10,000 U heparin in 1 L distilled water) followed by 4% paraformaldehyde solution. BAT tissues were removed and incubated in 4% paraformaldehyde overnight at 4°C and then placed into 30% sucrose solution for 2–3 days. BAT tissues were sectioned in 20 μm using a Lecia CM3050S cryostat. The sections were blocked in 0.1 M PBS buffer containing 0.2 M glycine (Sigma-Aldrich; Cat. No. G8898), 0.1% triton X-100 (Sigma-Aldrich; Cat. No. X100), 10% normal donkey serum (Sigma-Aldrich; Cat. No. S30), and 1% bovine serum albumin (Sigma-Aldrich; Cat. No. A7906) for 1 h at room temperature and then incubated with a rabbit anti-HCAR1 antibody (1:200, Alomone, Cat. No. AHR-011) for overnight at the cold room. And then, the sections were washed three times in PBS and incubated with Alexa 568 anti-rabbit IgG (1:1,000; Life Technologies; Cat. No. A10042) for 2 h at room temperature. The sections were washed, dried, and mounted with VECTASHIELD media containing DAPI. Images were acquired using a Leica SP8 confocal microscope.
Western Blotting
Total membrane and cytoplasmic protein fractions were isolated from BAT with a Mem-PER Plus membrane protein extraction kit (Pierce Protein Biology; Cat. No. 89842) in the presence of a protease inhibitor/phosphatase inhibitor cocktail (ThermoFisher Scientific; Cat. No. 78443). Protein concentrations were determined using a BCA protein assay kit (ThermoFisher Scientific; Cat. No. 23225). Cytosolic and membrane fraction proteins (30 µg each) were prepared by adding Laemmli sample buffer (Bio-Rad; Cat. No. 1610747). Cytosolic proteins were heated at 95°C for 5 min and membrane fraction samples were left at room temperature. After sample heating, the samples were separated by 10% SDS-PAGE and transferred to the PVDF membrane. The PVDF membrane was incubated with 5% wt/vol nonfat dry milk for 1 h at room temperature and immunoblotted with anti-UCP1 (1:1,000, Abcam; Cat. No. Ab234430), anti-phospho-hormone-sensitive lipase (HSL) (serine 660) (1:1,000, Cell Signaling Technology; Cat. No. 45804S), anti-HSL (1:1,000, Cell Signaling Technology; Cat. No. 4107), anti-HCAR1 (1:500, Invitrogen; Cat. No. PA5-75664), anti-GAPDH (1:3,000, Invitrogen; Cat. No. PA1-987), anti-GLUT4 (1:1,000, Invitrogen; Cat. No. PA1-1065), and anti-Pan-Cadherin (1 µg, Cell Signaling Technology; Cat. No. 4068T) antibodies. Following incubation in primary antibodies, the membrane was washed three times in TBS-T and then incubated with an anti-rabbit IgG, HRP-linked antibody (1:10,000, Cell signaling Technology; Cat. No. 7074) for 2 h at room temperature. Enhanced chemiluminescence reagents were applied to the membrane and protein bands were detected using an Odyssey Fc imaging system (Li-COR).
Measurement of 2-Deoxy-d-Glucose Uptake
2-Deoxy-d-glucose (2-DG) uptake by BAT was measured with a 2-DG uptake measurement kit (Cosmo Bio Co., Ltd., Cat. No. CSR-OKP-PMG-K01TE). Mice received an intraperitoneal injection of 2-DG [32.8 µg/kg (31), ThermoFisher Scientific, Cat. No. AC111980050] 3 h after intraperitoneal injection of 3,5-DHBA (200 mg/kg). BAT samples (10 mg) from BATGFP and BATHCAR1 mice were isolated 1 h after intraperitoneal injection of 2-DG. And then, the samples were immediately frozen and kept at −80°C until use. The BAT samples were homogenized with a handheld homogenizer and lysed in 10 mM Tris-HCl (pH 8.1) on ice. 2-DG uptake was measured by quantifying 2-DG6P accumulation in BAT following the manufacturer’s instructions. The optical density of samples was measured at a wavelength of 420 nm using a microplate reader.
Statistics
All statistical results were presented as means ± SE. Statistical analyses were performed using Graphpad Prism 9.0. Two-tailed t tests were used to calculate P values of pair-wise comparisons. Data for comparisons across more than two groups were analyzed using a one-way ANOVA with Tukey’s post hoc comparisons. Time course comparisons between groups were analyzed using a two-way repeated-measures ANOVA with Sidak’s correction for multiple comparisons. Data were considered significantly different when the probability value was less than 0.05.
RESULTS
Overexpressing HCAR1 in BAT Promotes Glucose Uptake and Nonshivering Thermogenesis
We previously demonstrated Hcar1 mRNA and protein expression in mouse BAT (27). To extend and further confirm our prior finding, we stained BAT sections with an anti-HCAR1 antibody and found that HCAR1 was detected in the plasma membrane in BAT (Fig. 1A). Hence, RT-qPCR, Western blot, and immunohistochemical analyses support HCAR1 expression in BAT.
Figure 1.

BATHCAR1 mice exhibit increased glucose uptake and BAT temperature. A: images of confocal fluorescence microscopy showing expression of HCAR1 in BAT. Scale bar: 30 µm. Bottom: higher magnification view of the area of the white square (arrowheads). B: schematic illustration of our experimental configurations. AAV5-Hcar1-GFP (closed circle) and AAV5-GFP (open circle) viruses were bilaterally injected to the BAT pads of male DIO mice. Mice were maintained on high-fat feeding. C: summary plot showing increased expression in Hcar1 mRNA expression in BAT of BATHCAR1 mice (BATGFP mice, n = 12 mice, BATHCAR1 mice, n = 9 mice, two-tailed t test, ***P < 0.001). Bottom: Western blot images showing HCAR1 expression in BAT of BATHCAR1 and BATGFP mice. D: summary plot showing 2-DG uptake by BAT in response to treatment with the HCAR1 agonist 3,5-DHBA (BATGFP mice, n = 6 mice, BATHCAR1 mice, n = 4 mice, two-tailed t test, **P < 0.01). E: summary plot showing increased BAT temperature in the dark (right) but not day (left), phase in BATHCAR1 (n = 5) and BATGFP (n = 5) mice. Two-tailed t-test, ***P < 0.001. F: summary plot showing gene expression of the thermogenic genes Ucp1, Pgc1a, and Dio2 (BATGFP mice, n = 7 mice, BATHCAR1 mice, n = 7 mice, two-tailed t test, *P < 0.05, **P < 0.01). G: images showing BAT morphology in BATGFP and BATHCAR1 mice. H: Western blot images showing UCP1 expression in BAT of BATHCAR1 and BATGFP mice. BAT, brown adipose tissue; 2-DG, 2-deoxy-d-glucose; DIO, diet-induced obese.
As Hcar1 mRNA and protein levels were downregulated in the adipose tissue of male DIO and ob/ob mice (27–29), we investigated if HCAR1 overexpression in BAT can restore the capability of BAT in male DIO mice. To overexpress HCAR1 in BAT, we bilaterally injected AAV-HCAR1-GFP (BATHCAR1) or AAV-GFP (BATGFP) viruses into the BAT pads of male DIO mice (Fig. 1B). Following viral infection, animals were maintained on HFD for 10 wk. To validate Hcar1 overexpression in BAT, we collected BAT at 10 wk after viral inoculation and performed RT-qPCR. As expected, the Hcar1 gene expression in BAT was significantly higher in BATHCAR1 mice than in BATGFP mice (Fig. 1C). The overexpression was further supported by Western blot analysis (Fig. 1C). BATHCAR1 mice exhibited higher levels of HCAR1 expression than the control group. As activation of HCAR1 in BAT caused glucose uptake (27), we examined if the increased HCAR1 expression in BAT improves the ability of BAT to take up circulating glucose in response to treatment with the HCAR1 agonist. Treatment with the HCAR1 agonist 3,5-DHBA significantly increased 2-deoxy-glucose (2-DG) uptake by BAT (Fig. 1D), demonstrating the efficacy and feasibility of our viral vector-mediated overexpression of HCAR1 in BAT.
Given that activating HCAR1 signaling promoted glucose uptake (27) and that intracellular glycolysis was involved in heat production in BAT (11, 20), we sought to determine if HCAR1 overexpression can cause heat generation in BAT. We directly implanted miniature radio frequency identification (RFID) transponders with an integrated temperature biosensor underneath the BAT pads following viral inoculation and continuously measured BAT temperature. At 3 wk after viral injection, BAT temperature in BATHCAR1 mice was significantly higher than that in BATGFP mice during the dark period (Fig. 1E). To examine if this increase is associated with an upregulation of the thermogenic genes in BAT, we evaluated mRNA expression of uncoupling protein 1 (Ucp1), peroxisome proliferator-activated receptor-γ coactivator (PGC)-1α (Pgc1α), and iodothyronine deiodinase 2 (Dio2). UCP1 uncouples respiration from ATP synthesis and promotes energy dissipation in the form of heat (32). PGC-1α acts as a transcriptional coactivator that drives UCP1 expression and DIO2 causes a conversion of thyroxin (T4) to 3,3′,5-triiodothyronine (T3), which is a key event in the thermogenic response of BAT to cold challenge (32). We found that BATHCAR1 mice displayed significant increases in Ucp1 and Pgc1α expression (Fig. 1F), whereas there was no difference in Dio2 expression between the groups (Fig. 1F). In addition, BAT in BATHCAR1 mice was tan to red in color, whereas BATGFP mice exhibited the whitening of BAT (Fig. 1G). UCP1 content in BAT was higher in BATHCAR1 mice than in BATGFP mice (Fig. 1H). Hence, our results support the interpretation that HCAR1 overexpression in BAT improves the ability of BAT to produce heat in male DIO mice under resting conditions.
BATHCAR1 Mice Are Protected from DIO and Exhibit Improved Insulin Sensitivity
Excessive body weight gain in male DIO and ob/ob mice was inversely related to HCAR1 expression in adipocytes (27–29). We examined if HCAR1 overexpression prevents excessive body weight gain in males during high-fat feeding. As shown in Fig. 2A, BATHCAR1 mice did not gain as much weight as the control group. The difference in body weight between the two groups was observed as early as 3 wk after viral inoculation and became more profound by the end of the experiments. In line with this finding, BATHCAR1 mice displayed a significant reduction in both fat and lean mass (Fig. 2, B and C). These findings support the interpretation that HCAR1 overexpression reduces susceptibility to diet-induced obesity in male mice.
Figure 2.

BATHCAR1 mice gain less body weight. A: summary plot of body weight obtained from BATGFP (open circle; n = 11 mice) and BATHCAR1 (closed circle; n = 10 mice, two-way ANOVA test, ***P < 0.001). BATHCAR1 mice significantly weighed less than BATGFP mice. B and C: summary plots showing fat and lean mass in BATGFP (n = 14 mice) and BATHCAR1 (n = 10 mice) mice (fat mass, two-tailed t test, ***P < 0.001; lean mass, **P < 0.01). D–F: summary plots showing energy expenditure in BATGFP (n = 5 mice) and BATHCAR1 (n = 7 mice) mice. G: graph showing RER in BATGFP and BATHCAR1 mice (two-tailed t test, *P < 0.05, **P < 0.01). H and I: graphs showing locomotor activity in BATGFP and BATHCAR1 mice. BAT, brown adipose tissue; RER, respiratory exchange ratio.
We next investigated if there is a difference in energy expenditure between the groups by placing mice in metabolic cages. We found that there was no significant difference in energy expenditure between the groups (total, dark and light phases; Fig. 2, D–F). The respiratory exchange ratio (RER) that determines the relative participation of glucose, lipids, and proteins in energy production was significantly different (Fig. 2G). It seems likely that lipids are the predominant fuel source in BATHCAR1 mice. There was no significant difference in locomotor activity between BATGFP and BATHCAR1 mice (Fig. 2, H and I).
Prior studies showed increased plasma lactate levels in obese animals and humans (33–38), suggesting that there is a positive correlation between body weight gain and lactate levels. Thus, we evaluated plasma lactate levels in BATHCAR1 and BATGFP mice. Plasma lactate levels were significantly higher in BATGFP mice than in BATHCAR1 mice (Fig. 3A), suggesting that the degree of HCAR1 expression in BAT rather than lactate levels in circulation may be critical in regulating body weight gain. As BATHCAR1 mice exhibited reduced fat mass compared with controls, we further assessed plasma leptin and insulin levels. BATHCAR1 mice showed significantly lower plasma leptin and insulin levels than the control group (Fig. 3, B and C).
Figure 3.

BATHCAR1 mice display improved glucose and insulin tolerance. A–C: summary plots showing plasma lactate, leptin, and insulin levels in BATGFP and BATHCAR1 mice (lactate, n = 7 vs. 10 mice, two-tailed t test, *P < 0.05; leptin, n = 8 versus 9 mice, two-tailed t test, ***P < 0.001; insulin, n = 8 vs. 9 mice, two-tailed t test, ***P < 0.001). D and E: summary plots showing basal and fasting glucose levels in BATGFP and BATHCAR1 mice [basal (glucose), n = 10 versus 9 mice, two-tailed t test, *P < 0.05; fasting (glucose), n = 10 versus 8 mice]. F: summary plots showing changes in blood glucose levels in response to intraperitoneal injection of glucose (2 g/kg). BATHCAR1 mice showed improved glucose tolerance (BATGFP mice, n = 7 mice, BATHCAR1 mice, n = 8 mice, two-way ANOVA test, *P < 0.05). Right: glucose AUC in BATGFP and BATHCAR1 mice (two tailed t test, *P < 0.05). G: summary plot showing changes in blood glucose levels in response to intraperitoneal injection of insulin (1 U/kg). Increased insulin sensitivity was observed in BATHCAR1 mice (BATGFP mice, n = 6 mice, BATHCAR1 mice, n = 8 mice, two-way ANOVA test, ***P < 0.001). AUC, area under the curve; BAT, brown adipose tissue.
Given that BATHCAR1 mice exhibited reduced body weight, leptin, and insulin levels, we further examined if BATHCAR1 mice display improved glucose and insulin tolerance. First, we measured basal (nonfasting) and fasting glucose levels. BATHCAR1 mice showed lower basal blood glucose levels than the control group, although there was no significant difference in fasting glucose levels (Fig. 3, D and E). We then performed glucose tolerance tests to assess the ability of BATHCAR1 mice to dispose of a glucose load. We found a significant improvement in glucose tolerance in BATHCAR1 mice compared with controls (Fig. 3F). We also carried out insulin tolerance tests to assess glucose levels over time to an intraperitoneal insulin injection. BATHCAR1 mice displayed a robust increase in insulin sensitivity (Fig. 3G). These findings suggest that HCAR1 in BAT may contribute to the regulation of glucose homeostasis in DIO mice.
Next, we sought to determine if the effects of HCAR1 are coupled to changes in nutrient availability, we overexpressed HCAR1 in BAT in mice fed LFD (Fig. 4A). Unlike DIO mice, there was no significant difference in body weight between the control (miceGFP) and experimental groups (miceHCAR1; Fig. 4B). In addition, the percentages of fat and lean mass were similar between the two groups (Fig. 4, C and D). We also looked at if overexpressing HCAR1 in BAT changes glucose tolerance and insulin sensitivity in mice fed LFD. We found that mice overexpressing HCAR1 in BAT exhibited similar basal and fasting blood glucose levels (Fig. 4, E and F) and no improvement in glucose and insulin tolerance (Fig. 4, G and H). Moreover, overexpressing HCAR1 did not alter plasma leptin and insulin levels (Fig. 4, I and J). These results suggest that the metabolic effects of HCAR1 appear to be coupled with changes in nutrient availability.
Figure 4.

Overexpressing HCAR1 in BAT does not change body weight and glucose homeostasis in mice fed LFD. A: schematic illustration of our experimental configurations. AAV5-Hcar1-GFP (miceHCAR1, closed circle) and AAV5-GFP (miceGFP, open circle) viruses were bilaterally injected to the BAT pads of male mice fed LFD for 10 wk. Right: pooled data showed increased expression in Hcar1 mRNA expression in BAT of miceHCAR1 (miceGFP, n = 6 mice, miceHCAR1, n = 13 mice, two-tailed t test, **P < 0.01). B: summary plot showing body weight obtained from miceGFP (open circle; n = 12 mice) and miceHCAR1 (closed circle; n = 13 mice). C and D: summary plots showing percentages of fat and lean mass in miceGFP (n = 12 mice) and miceHCAR1 (n = 13 mice) mice. E and F: summary plots showing basal and fasting glucose levels in miceGFP and miceHCAR1 mice [basal (glucose), n = 8 vs. 6 mice; fasting (glucose), n = 13 vs. 10 mice]. G: summary plots showing changes in blood glucose levels in response to intraperitoneal injection of glucose (2 g/kg; miceGFP, n = 13 mice, miceHCAR1, n = 10 mice). H: summary plot showing changes in blood glucose levels in response to intraperitoneal injection of insulin (1 U/kg; miceGFP mice, n = 4, miceHCAR1 mice, n = 9 mice). I and J: summary plots showing plasma leptin and insulin levels in miceGFP and miceHCAR1 mice (leptin, n = 8 vs. 10 mice; insulin, n = 9 vs. 9 mice). No significant differences were found in all the parameters (B–J, two-tailed t test and two-way ANOVA test). BAT, brown adipose tissue; LFD, low-fat diet.
HCAR1 Overexpression Upregulates GLUT4 Expression and Reduces HSL Phosphorylation
As improved glucose disposal would be due in part to increased glucose transporter expression and translocation in BAT, we evaluated mRNA expression levels of the glucose transporter 1 and 4 Slc2a1 (Glut1) and Slc2a4 (Glut4)) in BAT of BATHCAR1 and BATGFP mice on high-fat feeding. We found that HCAR1 overexpression markedly increased Slc2a4 mRNA expression in BAT (Fig. 5A). Western blot analysis further revealed higher levels of cytosolic GLUT4 expression in BATHCAR1 mice than in BATGFP mice (Fig. 5B), consistent with increased Slc2a4 gene expression. Insulin increased glucose uptake by controlling the trafficking of GLUT4 to the plasma membrane in BAT (39, 40). We further sought to determine if HCAR1 overexpression can also cause GLUT4 translocation to the plasma membrane. Following isolation of the membrane proteins from BAT, we performed Western blotting and found an increase in the plasma membrane GLUT4 expression in BATHCAR1 mice (Fig. 5B). Hence, our results suggest that increased GLUT4 translocation to the plasma membrane may improve glucose tolerance in BATHCAR1 mice.
Figure 5.

HCAR1 overexpression in BAT reduces HSL phosphorylation, while upregulating mRNA expression of the lipogenic genes in DIO mice. A: summary plot showing mRNA expression of Slc2a1 and Slc2a4 in BAT of BATGFP and BATHCAR1 mice. Both Slc2a1 and Slc2a4 expression was significantly upregulated by HCAR1 overexpression in BAT (Slc2a1, BATGFP mice, n = 7 mice; BATHCAR1 mice, n = 7 mice, two-tailed t test, *P < 0.05; Slc2a4, BATGFP mice, n = 7 mice; BATHCAR1 mice, n = 7 mice, two-tailed t test, ***P < 0.001). B: Western blot images showing cytosolic and membrane GLUT4 expression in BAT. C: Western blot images showing reduced HSL phosphorylation at serine 660 in BAT of BATHCAR1 mice. D: summary plots showing upregulated mRNA expression of the lipogenic enzyme genes in BAT of BATHCAR1 mice (BATGFP mice, n = 7 mice; BATHCAR1 mice, n = 7 mice, two-tailed t test, **P < 0.01, ***P < 0.001). Left: schematic diagram describing lipogenic enzymes involved in the synthesis of fatty acids in BAT. BAT, brown adipose tissue; DIO, diet-induced obese; HSL, hormone-sensitive lipase.
Activation of HCAR1 inhibited lipolysis in white adipocytes in vitro and in vivo (23, 25). We thus asked if HCAR1 overexpression alters lipid metabolism in BAT of DIO mice by evaluating lipogenic gene expression and hormone-sensitive lipase (HSL) phosphorylation that stimulates triglyceride hydrolysis. Immunoblotting analysis revealed that BATHCAR1 mice exhibited no or little HSL phosphorylation at serine 660, whereas HSL phosphorylation was detected in BAT of BATGFP mice (Fig. 5C). In addition, RT-qPCR analysis of lipogenic enzyme genes, such as ATP citrate lyase (Acl), acetyl-CoA carboxylase (Acc1), fatty acid synthase (Fasn), and stearoyl-CoA desaturase 1 (Scd1), further revealed that BATHCAR1 mice had increased lipogenic enzyme gene expression (Fig. 5D). Hence, our results suggest that HCAR1 overexpression may reduce basal lipolysis, while promoting fatty acid synthesis in BAT during conditions of nutrient excess.
DISCUSSION
The present study demonstrates that HCAR1 in BAT plays a key role in controlling body weight, glucose homeostasis, and insulin sensitivity in male DIO mice. A series of experiments support our conclusion. First, we found that BATHCAR1 mice exhibited increased BAT temperature. Second, BATHCAR1 mice significantly gained less body weight compared with BATGFP mice. Interestingly, plasma lactate levels in BATHCAR1 mice were lower compared with those in BATGFP mice. Third, BATHCAR1 mice displayed improved glucose tolerance and insulin sensitivity. Forth, HCAR1 overexpression upregulated the Slc2a4 gene and caused GLUT4 translocation to the plasma membrane. Finally, this overexpression increased lipogenic gene expression, while reducing HSL phosphorylation. Taken together, our results provide novel insights into the role of lactate and its cognate receptors in BAT in the control of glucose homeostasis in DIO mice.
Humans with obesity and obese animals had high plasma lactate levels (33–38). In our preparations, obese BATGFP mice also exhibited higher plasma lactate levels than BATHCAT1 mice, suggesting that there was a positive correlation between body weight and circulating lactate levels. In contrast to increased lactate levels, HCAR1 expression in the adipose tissue was inversely correlated with body mass in male mice (27–29), suggesting that the degree of HCAR1 expression in BAT rather than plasma lactate levels would be a key factor in maintaining metabolic balance in mice. Of particular interest is that treatment with the HCAR1 agonist reduced systemic glucose levels in male DIO mice via increased glucose uptake by BAT (27). Thus, it appears that HCAR1 in BAT remains functional in DIO male mice. It is conceivable that HCAR1 would be an alternative target to control euglycemia in DIO mice as DIO reduced insulin signaling with decreased Akt phosphorylation in BAT, resulting in insulin resistance (41).
Pharmacological activation of the sympathetic β3AR in BAT drove glucose uptake and converted glucose to lactate via increased glycolysis (11, 18, 20). Following lactate production in BAT, lactate was secreted and acted in an autocrine and paracrine manner in rodents and humans (7, 18). In our prior study, optogenetic stimulation of sympathetic nerves innervating BAT upregulated the expression of the Ldha/b and Mct1 genes in BAT (11). Blockade of lactate production and transport by inhibiting LDH and MCT1 abolished β3AR-mediated glucose uptake in BAT (11), suggesting the important role of lactate in controlling the ability of BAT to take up circulating glucose. In addition, transgenic mice with increased glucose uptake in WAT by expressing glucokinase displayed increased lactate production (42). They exhibited improved glucose tolerance and insulin sensitivity when fed a standard chow diet (42). Although these transgenic mice became obese similarly to controls when fed HFD, they remained insulin sensitivity (42). Although the Bosch research group did not examine if improved insulin sensitivity was in part due to elevated lactate production in WAT, it is possible that a rise in lactate production may improve glucose tolerance and insulin sensitivity. In fact, increased lactate release from WAT improved the antilipolytic effect of insulin via activation of HCAR1 (23). In line with the previous findings in WAT, BATHCAR1 mice exhibited a reduction in HSL phosphorylation in BAT, resulting in a decrease in basal lipolysis. This antilipolytic effect of HCAR1 in WAT and BAT would be important because basal lipolysis was elevated during obesity and was closely associated with insulin resistance (43). Reduced basal lipolysis in the adipose tissue would lead to improved insulin sensitivity. Hence, it is conceivable that not only lactate production but also its cognate receptor in the adipose tissue is indispensable for maintaining euglycemia and insulin sensitivity in lean and obese animals.
The Offermanns’ research group demonstrated that adipocytes used HCAR1-mediated lactate signaling as an indirect index of glucose availability (23). Namely, activation of HCAR1 by lactate released from adipocytes inhibited lipolysis, resulting in an increase in energy storage in the form of triglycerides when blood glucose levels were high (23). Despite the antilipolytic effect of HCAR1, HCAR1 knockout (KO) mice exhibited no significant differences in body weight, glucose tolerance, and insulin sensitivity in mice fed a standard chow diet and HFD (23). When HCAR1 was overexpressed in BAT of mice fed LFD, we also found no changes in body weight and glucose homeostasis, consistent with the study by the Offermanns’ group. Unlike the HCAR1 KO mice on HFD, however, BATHCAR1 mice significantly gained less body weight than BATGFP mice kept on HFD, suggesting that increased BAT activity in BATHCAR1 mice could prevent body weight gain. In fact, the ability of BAT to control body weight has been well described in mice receiving BAT transplant (44–46). Importantly, increased BAT activity in mice receiving BAT transplant led to a reduction in body weight in ob/ob mice (46). The improvement of energy metabolism in mice receiving BAT transplant appears to be mediated by adipokines released from BAT, including fibroblast growth factor 21, interleukin 6, and tumor necrosis factor-α (44, 47). However, it was also suggested that BAT secretes other adipokines that work through insulin-independent pathways (46). Hence, our current study suggests that lactate is an understudied signal molecule released from BAT. The interaction between lactate and HCAR1 in BAT can enhance BAT activity that improves whole body energy metabolism and insulin sensitivity, particularly in obese animals.
What are the cellular mechanisms underlying the anti-obesity effect of HCAR1 in BAT? We have no clear explanation for this anti-obesity effect. In fact, we failed to detect a significant difference in energy expenditure between the groups at the end of 10 wk of high-fat feeding. However, we may not exclude the possibility that an accumulation of small improvements in basal metabolic rate after starting high-fat feeding in BATHCAR1 mice may prevent body weight gain during high-fay feeding. In addition, it has been shown that, unlike WAT, BAT is metabolically active under resting conditions in humans (7). In other words, BAT actively took up circulating glucose and released lactate regardless of heat production (7). In our preparations, increased HCAR1 expression in BAT promoted Slc2A4 mRNA and protein expression. More importantly, BATHCAR1 mice showed increased GLUT4 trafficking to the plasma membrane. GLUT4 trafficking in BAT was a prerequisite for augmented glucose uptake by BAT in rodents and humans (8, 10, 48). Thus, BAT in BATHCAR1 mice can substantially take up glucose under resting conditions. In fact, basal nonfasting glucose levels in BATHCAR1 mice were significantly lower compared with those in BATGFP mice. Lactate produced by increased glucose entry would be transported out of the cell and concomitant activation of HCAR1 would inhibit lipolysis and trigger fatty acid synthesis, resulting in increased energy storage as described in human BAT (7). This possibility was supported by our findings showing a robust upregulation of lipogenic gene expression in BAT of BATHCAR1 mice and inhibition of lipolysis in BAT.
In addition, lactate is a major substrate for the TCA cycle in all tissues, including adipose tissue (49). We previously showed that blockade of the MCT1 completely abolished the thermogenic effect of the activation of β3AR (11). Hence, it is plausible that lactate might be transported to mitochondria, feed the TCA cycle, and generate heat in BAT. As obese mice have diminished thermogenic capacity compared with lean mice (50), increased BAT activity in BATHCAR1 mice would contribute to body weight loss under a hypercaloric diet. Taken together, our current study showed that, like insulin receptors, HCAR1 expressed in BAT could promote glucose entry and reduce lipolysis, resulting in body weight loss and insulin sensitivity. Hence, targeting HCAR1 in BAT would provide an alternative way to control body weight and euglycemia in individuals with obesity.
GRANTS
This work was supported by the National Institutes of Health Grants DK092246, R01 AT011653, R03 TR003313, and P30 DK020541 (to Y.-H.J.).
DISCLOSURES
No conflicts of interest, financial or otherwise, are declared by the authors.
AUTHOR CONTRIBUTIONS
Y.-H.J. conceived and designed research; H.-Y.M., J.H., Y.C., and Y.-H.J. performed experiments; H.-Y.M., J.H., Y.C., and Y.-H.J. analyzed data; Y.-H.J. interpreted results of experiments; H.-Y.M., J.H., and Y.-H.J. prepared figures; Y.-H.J. drafted manuscript; Y.-H.J. edited and revised manuscript; H.-Y.M., J.H., Y.C., and Y.-H.J. approved final version of manuscript.
ACKNOWLEDGMENTS
We thank Drs. Gary Schwartz and Streamson Chua, Jr., for valuable feedback and comments on this study and Dr. Shun-Mei Liu and Licheng Wu for technical assistance.
REFERENCES
- 1. Cypess AM, Weiner LS, Roberts-Toler C, Franquet Elia E, Kessler SH, Kahn PA, English J, Chatman K, Trauger SA, Doria A, Kolodny GM. Activation of human brown adipose tissue by a beta3-adrenergic receptor agonist. Cell Metab 21: 33–38, 2015. doi: 10.1016/j.cmet.2014.12.009. [DOI] [PMC free article] [PubMed] [Google Scholar]
- 2. Saito M, Okamatsu-Ogura Y, Matsushita M, Watanabe K, Yoneshiro T, Nio-Kobayashi J, Iwanaga T, Miyagawa M, Kameya T, Nakada K, Kawai Y, Tsujisaki M. High incidence of metabolically active brown adipose tissue in healthy adult humans: effects of cold exposure and adiposity. Diabetes 58: 1526–1531, 2009. doi: 10.2337/db09-0530. [DOI] [PMC free article] [PubMed] [Google Scholar]
- 3. Ouellet V, Labbe SM, Blondin DP, Phoenix S, Guerin B, Haman F, Turcotte EE, Richard D, Carpentier AC. Brown adipose tissue oxidative metabolism contributes to energy expenditure during acute cold exposure in humans. J Clin Invest 122: 545–552, 2012. doi: 10.1172/JCI60433. [DOI] [PMC free article] [PubMed] [Google Scholar]
- 4. Matsushita M, Yoneshiro T, Aita S, Kameya T, Sugie H, Saito M. Impact of brown adipose tissue on body fatness and glucose metabolism in healthy humans. Int J Obes 38: 812–817, 2014. doi: 10.1038/ijo.2013.206. [DOI] [PubMed] [Google Scholar]
- 5. Chondronikola M, Volpi E, Borsheim E, Porter C, Annamalai P, Enerback S, Lidell ME, Saraf MK, Labbe SM, Hurren NM, Yfanti C, Chao T, Andersen CR, Cesani F, Hawkins H, Sidossis LS. Brown adipose tissue improves whole-body glucose homeostasis and insulin sensitivity in humans. Diabetes 63: 4089–4099, 2014. doi: 10.2337/db14-0746. [DOI] [PMC free article] [PubMed] [Google Scholar]
- 6. Lee P, Smith S, Linderman J, Courville AB, Brychta RJ, Dieckmann W, Werner CD, Chen KY, Celi FS. Temperature-acclimated brown adipose tissue modulates insulin sensitivity in humans. Diabetes 63: 3686–3698, 2014. doi: 10.2337/db14-0513. [DOI] [PMC free article] [PubMed] [Google Scholar]
- 7. Weir G, Ramage LE, Akyol M, Rhodes JK, Kyle CJ, Fletcher AM, Craven TH, Wakelin SJ, Drake AJ, Gregoriades ML, Ashton C, Weir N, van Beek EJR, Karpe F, Walker BR, Stimson RH. Substantial metabolic activity of human brown adipose tissue during warm conditions and cold-induced lipolysis of local triglycerides. Cell Metab 27: 1348–1355.e4, 2018. doi: 10.1016/j.cmet.2018.04.020. [DOI] [PMC free article] [PubMed] [Google Scholar]
- 8. Lee P, Bova R, Schofield L, Bryant W, Dieckmann W, Slattery A, Govendir MA, Emmett L, Greenfield JR. Brown adipose tissue exhibits a glucose-responsive thermogenic biorhythm in humans. Cell Metab 23: 602–609, 2016. doi: 10.1016/j.cmet.2016.02.007. [DOI] [PubMed] [Google Scholar]
- 9. M UD, Saari T, Raiko J, Kudomi N, Maurer SF, Lahesmaa M, Fromme T, Amri EZ, Klingenspor M, Solin O, Nuutila P, Virtanen KA. Postprandial oxidative metabolism of human brown fat indicates thermogenesis. Cell Metab 28: 207–216.e3, 2018. doi: 10.1016/j.cmet.2018.05.020. [DOI] [PubMed] [Google Scholar]
- 10. Orava J, Nuutila P, Lidell ME, Oikonen V, Noponen T, Viljanen T, Scheinin M, Taittonen M, Niemi T, Enerback S, Virtanen KA. Different metabolic responses of human brown adipose tissue to activation by cold and insulin. Cell Metab 14: 272–279, 2011. doi: 10.1016/j.cmet.2011.06.012. [DOI] [PubMed] [Google Scholar]
- 11. Jeong JH, Chang JS, Jo YH. Intracellular glycolysis in brown adipose tissue is essential for optogenetically induced nonshivering thermogenesis in mice. Sci Rep 8: 6672, 2018. doi: 10.1038/s41598-018-25265-3. [DOI] [PMC free article] [PubMed] [Google Scholar]
- 12. Hankir MK, Cowley MA, Fenske WK. A BAT-centric approach to the treatment of diabetes: turn on the brain. Cell Metab 24: 31–40, 2016. doi: 10.1016/j.cmet.2016.05.003. [DOI] [PubMed] [Google Scholar]
- 13. Townsend KL, Tseng YH. Brown fat fuel utilization and thermogenesis. Trends Endocrinol Metab 25: 168–177, 2014. doi: 10.1016/j.tem.2013.12.004. [DOI] [PMC free article] [PubMed] [Google Scholar]
- 14. Hankir MK, Kranz M, Keipert S, Weiner J, Andreasen SG, Kern M, Patt M, Kloting N, Heiker JT, Brust P, Hesse S, Jastroch M, Fenske WK. Dissociation between brown adipose tissue (18)F-FDG uptake and thermogenesis in uncoupling protein 1-deficient mice. J Nucl Med 58: 1100–1103, 2017. doi: 10.2967/jnumed.116.186460. [DOI] [PubMed] [Google Scholar]
- 15. Shin H, Ma Y, Chanturiya T, Cao Q, Wang Y, Kadegowda AKG, Jackson R, Rumore D, Xue B, Shi H, Gavrilova O, Yu L. Lipolysis in brown adipocytes is not essential for cold-induced thermogenesis in mice. Cell Metab 26: 764–777.e5, 2017. doi: 10.1016/j.cmet.2017.09.002. [DOI] [PMC free article] [PubMed] [Google Scholar]
- 16. Olsen JM, Csikasz RI, Dehvari N, Lu L, Sandstrom A, Oberg AI, Nedergaard J, Stone-Elander S, Bengtsson T. β3-Adrenergically induced glucose uptake in brown adipose tissue is independent of UCP1 presence or activity: mediation through the mTOR pathway. Mol Metab 6: 611–619, 2017. doi: 10.1016/j.molmet.2017.02.006. [DOI] [PMC free article] [PubMed] [Google Scholar]
- 17. Shackney SE, Joel CD. Stimulation of glucose metabolism in brown adipose tissue by addition of insulin in vitro. J Biol Chem 241: 4004–4010, 1966. doi: 10.1016/S0021-9258(18)99803-0. [DOI] [PubMed] [Google Scholar]
- 18. Ma SW, Foster DO. Uptake of glucose and release of fatty acids and glycerol by rat brown adipose tissue in vivo. Can J Physiol Pharmacol 64: 609–614, 1986. doi: 10.1139/y86-101. [DOI] [PubMed] [Google Scholar]
- 19. Hao Q, Yadav R, Basse AL, Petersen S, Sonne SB, Rasmussen S, Zhu Q, Lu Z, Wang J, Audouze K, Gupta R, Madsen L, Kristiansen K, Hansen JB. Transcriptome profiling of brown adipose tissue during cold exposure reveals extensive regulation of glucose metabolism. Am J Physiol Endocrinol Metab 308: E380–E392, 2015. doi: 10.1152/ajpendo.00277.2014. [DOI] [PubMed] [Google Scholar]
- 20. Winther S, Isidor MS, Basse AL, Skjoldborg N, Cheung A, Quistorff B, Hansen JB. Restricting glycolysis impairs brown adipocyte glucose and oxygen consumption. Am J Physiol Endocrinol Metab 314: E214–E223, 2018. doi: 10.1152/ajpendo.00218.2017. [DOI] [PubMed] [Google Scholar]
- 21. Iwanaga T, Kuchiiwa T, Saito M. Histochemical demonstration of monocarboxylate transporters in mouse brown adipose tissue. Biomed Res 30: 217–225, 2009. doi: 10.2220/biomedres.30.217. [DOI] [PubMed] [Google Scholar]
- 22. Lagarde D, Jeanson Y, Barreau C, Moro C, Peyriga L, Cahoreau E, Guissard C, Arnaud E, Galinier A, Bouzier-Sore AK, Pellerin L, Chouchani ET, Penicaud L, Ader I, Portais JC, Casteilla L, Carriere A. Lactate fluxes mediated by the monocarboxylate transporter-1 are key determinants of the metabolic activity of beige adipocytes. J Biol Chem 296: 100137, 2021. doi: 10.1074/jbc.RA120.016303. [DOI] [PMC free article] [PubMed] [Google Scholar]
- 23. Ahmed K, Tunaru S, Tang C, Muller M, Gille A, Sassmann A, Hanson J, Offermanns S. An autocrine lactate loop mediates insulin-dependent inhibition of lipolysis through GPR81. Cell Metab 11: 311–319, 2010. doi: 10.1016/j.cmet.2010.02.012. [DOI] [PubMed] [Google Scholar]
- 24. Wang GX, Zhao XY, Lin JD. The brown fat secretome: metabolic functions beyond thermogenesis. Trends Endocrinol Metab 26: 231–237, 2015. doi: 10.1016/j.tem.2015.03.002. [DOI] [PMC free article] [PubMed] [Google Scholar]
- 25. Liu C, Wu J, Zhu J, Kuei C, Yu J, Shelton J, Sutton SW, Li X, Yun SJ, Mirzadegan T, Mazur C, Kamme F, Lovenberg TW. Lactate inhibits lipolysis in fat cells through activation of an orphan G-protein-coupled receptor, GPR81. J Biol Chem 284: 2811–2822, 2009. doi: 10.1074/jbc.M806409200. [DOI] [PubMed] [Google Scholar]
- 26. Ge H, Weiszmann J, Reagan JD, Gupte J, Baribault H, Gyuris T, Chen JL, Tian H, Li Y. Elucidation of signaling and functional activities of an orphan GPCR, GPR81. J Lipid Res 49: 797–803, 2008. doi: 10.1194/jlr.M700513-JLR200. [DOI] [PubMed] [Google Scholar]
- 27. Kwon E, Yoo T, Joung HY, Jo YH. Hydrocarboxylic acid receptor 1 in BAT regulates glucose uptake in mice fed a high-fat diet. PLoS One 15: e0228320, 2020. doi: 10.1371/journal.pone.0228320. [DOI] [PMC free article] [PubMed] [Google Scholar]
- 28. Wanders D, Graff EC, Judd RL. Effects of high fat diet on GPR109A and GPR81 gene expression. Biochem Biophys Res Commun 425: 278–283, 2012. doi: 10.1016/j.bbrc.2012.07.082. [DOI] [PubMed] [Google Scholar]
- 29. Feingold KR, Moser A, Shigenaga JK, Grunfeld C. Inflammation inhibits GPR81 expression in adipose tissue. Inflamm Res 60: 991–995, 2011. doi: 10.1007/s00011-011-0361-2. [DOI] [PubMed] [Google Scholar]
- 30. Mina AI, LeClair RA, LeClair KB, Cohen DE, Lantier L, Banks AS. CalR: a web-based analysis tool for indirect calorimetry experiments. Cell Metab 28: 656–666.e1, 2018. doi: 10.1016/j.cmet.2018.06.019. [DOI] [PMC free article] [PubMed] [Google Scholar]
- 31. Albert V, Svensson K, Shimobayashi M, Colombi M, Munoz S, Jimenez V, Handschin C, Bosch F, Hall MN. mTORC2 sustains thermogenesis via Akt-induced glucose uptake and glycolysis in brown adipose tissue. EMBO Mol Med 8: 232–246, 2016. doi: 10.15252/emmm.201505610. [DOI] [PMC free article] [PubMed] [Google Scholar]
- 32. Tabuchi C, Sul HS. Signaling pathways regulating thermogenesis. Front Endocrinol (Lausanne) 12: 595020, 2021. doi: 10.3389/fendo.2021.595020. [DOI] [PMC free article] [PubMed] [Google Scholar]
- 33. Arriaran S, Agnelli S, Sabater D, Remesar X, Fernandez-Lopez JA, Alemany M. Evidences of basal lactate production in the main white adipose tissue sites of rats. Effects of sex and a cafeteria diet. PLoS One 10: e0119572, 2015. doi: 10.1371/journal.pone.0119572. [DOI] [PMC free article] [PubMed] [Google Scholar]
- 34. Chen CJ, Liao YH, Lin SY, Yu JX, Li ZJ, Lin YC, Chang GJ, Lin CH, Wong AM. Diet-induced obesity accelerates blood lactate accumulation of rats in response to incremental exercise to maximum. Am J Physiol Regul Integr Comp Physiol 313: R601–R607, 2017. doi: 10.1152/ajpregu.00337.2016. [DOI] [PubMed] [Google Scholar]
- 35. Chen YD, Varasteh BB, Reaven GM. Plasma lactate concentration in obesity and type 2 diabetes. Diabete Metab 19: 348–354, 1993. [PubMed] [Google Scholar]
- 36. Crawford SO, Hoogeveen RC, Brancati FL, Astor BC, Ballantyne CM, Schmidt MI, Young JH. Association of blood lactate with type 2 diabetes: the Atherosclerosis Risk in Communities Carotid MRI Study. Int J Epidemiol 39: 1647–1655, 2010. doi: 10.1093/ije/dyq126. [DOI] [PMC free article] [PubMed] [Google Scholar]
- 37. Jansson PA, Larsson A, Smith U, Lonnroth P. Lactate release from the subcutaneous tissue in lean and obese men. J Clin Invest 93: 240–246, 1994. doi: 10.1172/JCI116951. [DOI] [PMC free article] [PubMed] [Google Scholar]
- 38. Jones TE, Pories WJ, Houmard JA, Tanner CJ, Zheng D, Zou K, Coen PM, Goodpaster BH, Kraus WE, Dohm GL. Plasma lactate as a marker of metabolic health: implications of elevated lactate for impairment of aerobic metabolism in the metabolic syndrome. Surgery 166: 861–866, 2019. doi: 10.1016/j.surg.2019.04.017. [DOI] [PMC free article] [PubMed] [Google Scholar]
- 39. Leto D, Saltiel AR. Regulation of glucose transport by insulin: traffic control of GLUT4. Nat Rev Mol Cell Biol 13: 383–396, 2012. doi: 10.1038/nrm3351. [DOI] [PubMed] [Google Scholar]
- 40. Skorobogatko Y, Dragan M, Cordon C, Reilly SM, Hung CW, Xia W, Zhao P, Wallace M, Lackey DE, Chen XW, Osborn O, Bogner-Strauss JG, Theodorescu D, Metallo CM, Olefsky JM, Saltiel AR. RalA controls glucose homeostasis by regulating glucose uptake in brown fat. Proc Natl Acad Sci USA 115: 7819–7824, 2018. doi: 10.1073/pnas.1801050115. [DOI] [PMC free article] [PubMed] [Google Scholar]
- 41. Roberts-Toler C, O'Neill BT, Cypess AM. Diet-induced obesity causes insulin resistance in mouse brown adipose tissue. Obesity (Silver Spring) 23: 1765–1770, 2015. doi: 10.1002/oby.21134. [DOI] [PMC free article] [PubMed] [Google Scholar]
- 42. Munoz S, Franckhauser S, Elias I, Ferre T, Hidalgo A, Monteys AM, Molas M, Cerdan S, Pujol A, Ruberte J, Bosch F. Chronically increased glucose uptake by adipose tissue leads to lactate production and improved insulin sensitivity rather than obesity in the mouse. Diabetologia 53: 2417–2430, 2010. doi: 10.1007/s00125-010-1840-7. [DOI] [PubMed] [Google Scholar]
- 43. Morigny P, Houssier M, Mouisel E, Langin D. Adipocyte lipolysis and insulin resistance. Biochimie 125: 259–266, 2016. doi: 10.1016/j.biochi.2015.10.024. [DOI] [PubMed] [Google Scholar]
- 44. Stanford KI, Middelbeek RJ, Townsend KL, An D, Nygaard EB, Hitchcox KM, Markan KR, Nakano K, Hirshman MF, Tseng YH, Goodyear LJ. Brown adipose tissue regulates glucose homeostasis and insulin sensitivity. J Clin Invest 123: 215–223, 2013. doi: 10.1172/JCI62308. [DOI] [PMC free article] [PubMed] [Google Scholar]
- 45. Liu X, Zheng Z, Zhu X, Meng M, Li L, Shen Y, Chi Q, Wang D, Zhang Z, Li C, Li Y, Xue Y, Speakman JR, Jin W. Brown adipose tissue transplantation improves whole-body energy metabolism. Cell Res 23: 851–854, 2013. doi: 10.1038/cr.2013.64. [DOI] [PMC free article] [PubMed] [Google Scholar]
- 46. Liu X, Wang S, You Y, Meng M, Zheng Z, Dong M, Lin J, Zhao Q, Zhang C, Yuan X, Hu T, Liu L, Huang Y, Zhang L, Wang D, Zhan J, Jong Lee H, Speakman JR, Jin W. Brown adipose tissue transplantation reverses obesity in Ob/Ob mice. Endocrinology 156: 2461–2469, 2015. doi: 10.1210/en.2014-1598. [DOI] [PubMed] [Google Scholar]
- 47. Gunawardana SC, Piston DW. Reversal of type 1 diabetes in mice by brown adipose tissue transplant. Diabetes 61: 674–682, 2012. doi: 10.2337/db11-0510. [DOI] [PMC free article] [PubMed] [Google Scholar]
- 48. Picatoste B, Yammine L, Leahey RA, Soares D, Johnson EF, Cohen P, McGraw TE. Defective insulin-stimulated GLUT4 translocation in brown adipocytes induces systemic glucose homeostasis dysregulation independent of thermogenesis in female mice. Mol Metab 53: 101305, 2021. doi: 10.1016/j.molmet.2021.101305. [DOI] [PMC free article] [PubMed] [Google Scholar]
- 49. Hui S, Ghergurovich JM, Morscher RJ, Jang C, Teng X, Lu W, Esparza LA, Reya T, Le Z, Yanxiang Guo J, White E, Rabinowitz JD. Glucose feeds the TCA cycle via circulating lactate. Nature 551: 115–118, 2017. doi: 10.1038/nature24057. [DOI] [PMC free article] [PubMed] [Google Scholar]
- 50. Branca RT, He T, Zhang L, Floyd CS, Freeman M, White C, Burant A. Detection of brown adipose tissue and thermogenic activity in mice by hyperpolarized xenon MRI. Proc Natl Acad Sci USA 111: 18001–18006, 2014. doi: 10.1073/pnas.1403697111. [DOI] [PMC free article] [PubMed] [Google Scholar]