Keywords: ageing, forced response, response initiation, response preparation, timed response
Abstract
Recent work indicates that healthy younger adults can prepare accurate responses faster than their voluntary reaction times would suggest, leaving a seemingly unnecessary delay of 80–100 ms before responding. Here, we examined how the preparation of movements, initiation of movements, and the delay between them are affected by aging. Participants made planar reaching movements in two conditions. The “free reaction time” condition assessed the voluntary reaction times with which participants responded to the appearance of a stimulus. The “forced reaction time” condition assessed the minimum time actually needed to prepare accurate movements by controlling the time allowed for movement preparation. The time taken to both initiate movements in the free reaction time and to prepare movements in the forced response condition increased with age. Notably, the time required to prepare accurate movements was significantly shorter than participants’ self-selected initiation times; however, the delay between movement preparation and initiation remained consistent across the lifespan (∼90 ms). These results indicate that the slower reaction times of healthy older adults are not due to an increased hesitancy to respond, but can instead be attributed to changes in their ability to process stimuli and prepare movements accordingly, consistent with age-related changes in brain structure and function.
NEW & NOTEWORTHY Previous research argues that older adults have slower response times because they hesitate to react, favoring accuracy over speed. The present results challenge this proposal. We found the delay between the minimum time required to prepare movements and the self-selected time at which they initiated remained consistent at ∼90 ms from ages 21 to 80. We therefore suggest older adults’ slower response times can be attributed to changes in their ability to process stimuli and prepare movements.
INTRODUCTION
Adult human reaction times in response to simple tasks slow with age at a rate of 2–6 ms per decade (1–3). More complex tasks are associated with greater reaction time differences between healthy young and old participants (3). These increases in response times have been attributed to changes in both the physical capabilities and the self-selected behaviors of older adults. Age-related changes in brain physiology are associated with reductions in the speed of information processing (4). Compared with younger adults, older individuals have reduced gray matter volumes (5), reductions in white matter integrity (6), and recruit additional neural resources when completing tasks (7), all of which could contribute to slower sensorimotor processing times. A second factor that may contribute to this decline comes from research suggesting that older adults take a more cautious approach when performing tasks (8). For tasks in which performance is governed by a speed-accuracy trade-off (9), younger adults appear to balance speed and accuracy in a way that achieves a high rate of correct responses, whereas older adults reportedly focus on minimizing errors at the cost of being slower (10–12). It is unclear which of these explanations—slower processing or greater cautiousness—is primarily responsible for the general increase in reaction times with aging.
Cautiousness to respond (i.e., focusing on accuracy over speed) appears to occur even in tasks that one might expect to be highly reactive, such as reaching to a visual target. We have recently shown that healthy younger adults can detect a target location and prepare an accurate movement in as little as 150 ms, but introduce a delay of 80–100 ms before voluntarily initiating a response (13), seemingly to avoid committing errors in which responses were initiated before they had been prepared. Here, our goal was to quantify the effects of aging on movement preparation, movement initiation, and the relationship between them. We hypothesized that if healthy older adults delay their actions in order to favor accuracy, the delay between the minimum time required to prepare movements and the time at which they are voluntarily initiated may increase with age.
In the present study, we therefore examined the extent to which the slower reaction times of healthy older individuals are due to a slowing of their ability to process perceptual information and prepare appropriate movements (i.e., due to an overall reduction in processing speed), and/or an increase in the delay between when their movements are prepared and initiated (e.g., favoring accuracy over speed to avoid the risk of making an error). Participants completed a planar reaching task, and their reaction times were measured in two different conditions. The “Free Reaction Time” condition (equivalent to standard “choice reaction time” testing), assessed the time at which participants would voluntarily initiate movements in response to the appearance of a target. The “forced reaction time” condition, based on an established psychophysics paradigm (13–17), forced participants to respond at lower-than-normal reaction times, allowing us to determine the amount of time they needed to prepare accurate responses. Our results indicate that the time participants required to both initiate and prepare responses increased with age; however, the delay between preparation and initiation of movements remained invariant at around 90 ms. These results indicate that the slower reaction times of healthy older adults observed in this task were not due to an increased hesitancy to respond, but can instead be wholly attributed to declines in the ability to process stimuli and prepare accurate movements.
METHODS
Fifty-four human participants aged between 21 and 80 completed the study (see Table 1). Previous research indicates typical correlations between age and reaction time in the range of r = 0.46 to r = 0.51 (3, 18). Power analysis based on the more conservative r = 0.46, with 80% power and a two-tailed α of 0.05 indicated that a sample of 35 participants would be sufficient to detect effects in the present study (based on power analysis calculations from Ref. 19). All participants had no known neurological disorders and had normal cognition (a score of ≥26 on the Montreal cognitive assessment) (20). All participants provided written informed consent before their participation, and all procedures were approved by the Johns Hopkins University School of Medicine Institutional Review Board.
Table 1.
Test population summary data
| Age | Sex | Hand | Initiation Time (Means ± SD), ms | Mean PT, ms | Difference (IT – PT) | Accuracy (Free RT), % | |
|---|---|---|---|---|---|---|---|
| 21 | F | R | 355 ± 43 | 264 | 91 | 95.3 | |
| 21 | F | R | 399 ± 36 | 280 | 119 | 99.0 | |
| 21 | F | R | 387 ± 27 | 283 | 104 | 100.0 | |
| 21 | F | L | 364 ± 38 | 292 | 72 | 99.7 | |
| 21 | F | R | 420 ± 47 | 304 | 116 | 100.0 | |
| 23 | M | R | 380 ± 32 | 305 | 75 | 99.2 | |
| 24 | M | R | 368 ± 36 | 289 | 79 | 98.7 | |
| 25 | F | R | 346 ± 49 | 238 | 108 | 99.3 | |
| 28 | M | R | 370 ± 29 | 268 | 102 | 100.0 | |
| 28 | F | R | 387 ± 31 | 275 | 112 | 96.9 | |
| 29 | M | R | 344 ± 27 | 253 | 91 | 99.7 | |
| 29 | F | L | 328 ± 55 | 271 | 57 | 99.0 | |
| 29 | M | R | 403 ± 29 | 271 | 132 | 99.5 | |
| 30 | F | R | 329 ± 24 | 255 | 74 | 100.0 | |
| 31 | F | R | 398 ± 31 | 294 | 104 | 99.5 | |
| 34 | M | R | 354 ± 28 | 294 | 60 | 99.5 | |
| 35 | M | R | 339 ± 20 | 265 | 74 | 99.5 | |
| 36 | F | R | 400 ± 82 | 286 | 114 | 100.0 | |
| 36 | F | R | 404 ± 53 | 327 | 77 | 98.2 | |
| 37 | F | R | 435 ± 38 | 303 | 132 | 98.4 | |
| 38 | F | R | 391 ± 37 | 315 | 76 | 99.7 | |
| 40 | F | L | 395 ± 36 | 281 | 114 | 99.2 | |
| 40 | M | R | 411 ± 59 | 302 | 109 | 97.9 | |
| 42 | F | R | 411 ± 39 | 293 | 118 | 100.0 | |
| 43 | F | R | 352 ± 41 | 291 | 61 | 100.0 | |
| 44 | F | R | 370 ± 41 | 309 | 61 | 98.4 | |
| 45 | F | R | 429 ± 31 | 328 | 101 | 99.0 | |
| 45 | M | R | 480 ± 17 | 339 | 141 | 99.5 | |
| 47 | F | R | 380 ± 48 | 300 | 80 | 98.4 | |
| 50 | F | R | 404 ± 42 | 325 | 79 | 96.4 | |
| 55 | F | R | 444 ± 35 | 288 | 156 | 98.7 | |
| 56 | F | R | 370 ± 42 | 270 | 100 | 99.7 | |
| 56 | F | R | 327 ± 37 | 288 | 39 | 100.0 | |
| 56 | M | R | 421 ± 42 | 338 | 83 | 99.7 | |
| 57 | F | R | 394 ± 77 | 284 | 110 | 96.5 | |
| 57 | F | R | 372 ± 39 | 289 | 83 | 99.0 | |
| 58 | M | R | 411 ± 34 | 309 | 102 | 96.9 | |
| 59 | F | R | 429 ± 40 | 278 | 151 | 99.5 | |
| 59 | F | R | 379 ± 35 | 321 | 58 | 99.0 | |
| 59 | M | R | 362 ± 69 | 323 | 39 | 100.0 | |
| 61 | F | R | 378 ± 30 | 299 | 79 | 94.5 | |
| 62 | F | L | 431 ± 29 | 298 | 133 | 99.5 | |
| 62 | M | R | 361 ± 35 | 305 | 56 | 99.2 | |
| 63 | M | R | 439 ± 35 | 299 | 140 | 98.7 | |
| 66 | F | R | 351 ± 44 | 228 | 123 | 100.0 | |
| 68 | M | R | 384 ± 34 | 282 | 102 | 99.5 | |
| 70 | F | L | 468 ± 33 | 382 | 86 | 100.0 | |
| 71 | F | R | 379 ± 41 | 294 | 85 | 100.0 | |
| 72 | M | R | 381 ± 45 | 294 | 87 | 98.7 | |
| 72 | M | R | 386 ± 38 | 314 | 72 | 99.0 | |
| 72 | F | R | 383 ± 34 | 315 | 68 | 99.0 | |
| 72 | M | L | 397 ± 42 | 326 | 71 | 96.4 | |
| 76 | F | R | 400 ± 54 | 301 | 99 | 97.9 | |
| 80 | M | R | 453 ± 32 | 325 | 128 | 100.0 | |
| Summary | Means ± SD | Count | Count | Means ± SD | Means ± SD | Means ± SD | Means ± SD |
| 46.9 ± 17.6 | 35F, 19M | 48R, 6L | 390 ± 35 ms | 295 ± 26 ms | 94 ± 28 ms | 98.9 ± 1.3% |
IT, initiation time; PT, preparation time; RT, response time.
Apparatus
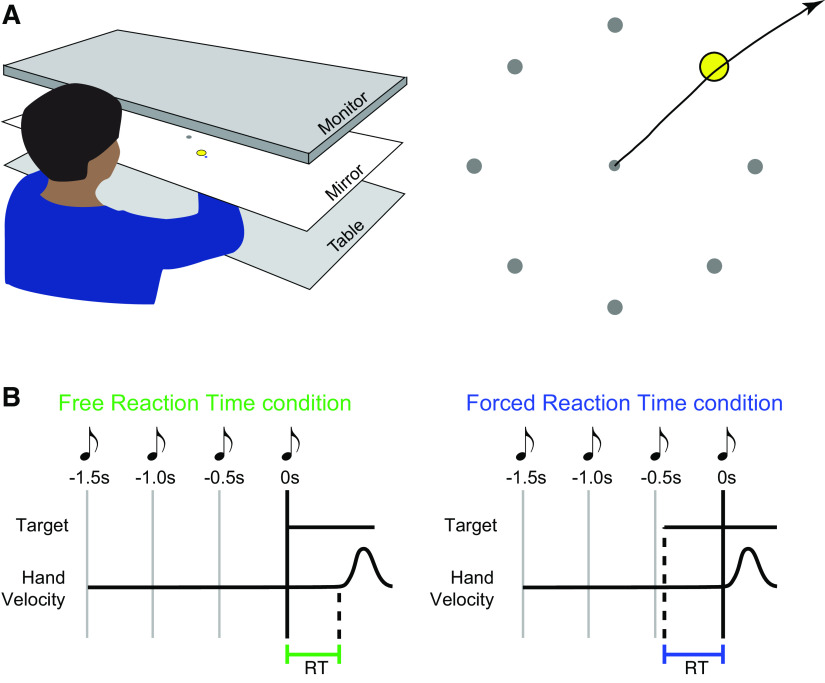
Participants sat at a glass-surfaced table with their dominant arm supported by an air sled, allowing frictionless two-dimensional (2-D) movements in the horizontal plane (see Fig. 1). A monitor and mirror setup allowed presentation of visual targets in the same plane as the arm. Hand position was tracked at 130 Hz using a flock of birds motion tracking system (Ascension Technologies).
Figure 1.
Apparatus and experimental conditions. A: participants made planar reaching movements to interact with an on-screen display. Participants made ballistic “shooting” actions with the goal of passing the cursor through a target. The target appeared in one of eight locations. B: experimental conditions. In the free reaction time condition, the target appeared at a fixed time cued by a sequence of tones. Participants attempted to respond by initiating a movement as soon as possible. In the forced reaction time condition, participants always initiated movements at a fixed time (synchronously with the final tone in a sequence of four). The target appeared at a random time prior to movement; the time between target presentation and the fourth tone therefore imposed a limited response time (RT).
Participants moved their hand to control the position of a cursor (blue circle, 5 mm diameter). Each trial began with the cursor in a central start position (green circle, 10 mm diameter). The two experimental conditions (free and forced reaction time—see the following two sections) required participants to make a ballistic arm movement (i.e., movements that use feedforward control with little opportunity to make online corrections to their movement) (21); with the goal to pass the cursor through a target (gray circle, 25 mm diameter). The target could appear in one of eight locations, each spaced equally around the start position at a distance of 80 mm.
Free Reaction Time Condition
Participants were instructed to react as quickly as possible to the appearance of a target. The timing of stimulus presentation was predictable, occurring synchronously with the final tone in a sequence of four equally spaced tones (500-ms separation). This cuing reduced ambiguity regarding the timing of stimulus presentation, which reduces reaction times and their variability (22). Participants completed 1–4 blocks (each 96 trials) of free reaction time trials (the number of blocks varied depending on the time available to test the participant). The targets appeared in a pseudorandom sequence, with each target appearing 12 times per block.
Forced Reaction Time Condition
The forced reaction time condition used an established paradigm that requires participants to respond at a prescribed time within each trial (13–17). Participants heard a sequence of four equally spaced tones (500-ms separation), and were trained to initiate their movements synchronously with the onset of the fourth and final tone. Different reaction times were imposed by varying the time at which the target was presented relative to the required time of movement onset. Participants were instructed that although both the timing and the accuracy of their movements were important in this condition, their highest priority was to attempt to begin their response synchronously with the fourth tone. If participants failed to initiate their movement within ±75 ms of this time, on-screen feedback informed them that they were “too early” or “too late.” If participants failed to time their movement accurately on three consecutive trials the experimenter also provided additional feedback, reiterating the instruction that accurate timing was their highest priority in this condition. Analyses accounted for discrepancies in participant timing (i.e., differences in time between participants responses and the fourth tone) in several ways. First, we determined the “actual” time the participants used in each trial by measuring the time between the onset of the stimulus and their response (rather than the experimentally “prescribed” time based on the time between stimulus onset and the fourth tone). Second, a set of “asynchrony” analyses examined differences in timing between the participant responses and the fourth tone.
In initial training blocks the target appeared at the onset of the trial, allowing the participant 1,500 ms to prepare a response. Participants trained for one block of 50 trials; if they could accurately time the initiation of their movement in at least 35/50 trials they proceeded to the main experiment, otherwise they completed a second 50-trial training block. Participants then completed trials with variable target presentation times. In each block, target presentation varied uniformly between 0 and 400 ms before the fourth tone (if participants failed to produce correct responses within this time window the range was increased to 600 ms). Each block began with two “warm-up” trials in which the target appeared with the first tone. Participants completed 2–4 blocks (106 trials each) of forced reaction time trials (the variable number of blocks depended on the time available to test the participant and their adherence to instructions).
Data Analysis
Hand position was processed with a second-order Savitzky–Golay filter (half-width 54 ms). Movement onset was calculated as the time at which tangential hand velocity first exceeded 0.02 m/s. We subtracted the mean delay in the recording system (measured to be 100 ms) to provide a more accurate measure of true reaction time. Reaction time in both the free reaction time and forced reaction time conditions was calculated as the delay between the onset of the stimulus and movement onset. Initial movement direction was calculated from the direction of the hand’s velocity 100 ms after movement onset.
Data from the forced reaction time condition was used to model the probability of initiating an accurate movement at a given reaction time (i.e., a speed-accuracy trade-off) based on a previously established approach (13, 17). Movements were considered to have been initiated in the correct direction if the initial movement direction was within 22.5° of the target. For data visualization purposes, the proportion of movements initiated in the correct direction was calculated for a 20-ms sliding window around each potential reaction time. For analysis, a speed-accuracy trade-off was modeled as a cumulative Gaussian distribution centered on time Tp [thus Tp ∼ N(Up, σp2)]. This assumes movements before Tp were directed randomly with respect to the true target location, while movements after Tp were initiated in the correct direction with some probability α. Parameters were estimated from the data for each individual participant using a maximum likelihood approach.
Statistical analyses were conducted using JASP (0.13.1.0). The relationship between movement preparation and initiation was analyzed using a repeated-measures ANOVA (RMANOVA). The RMANOVA assessed the within-subjects factor of time—initiation time (calculated using the free reaction time condition) was compared to preparation time (calculated using the forced reaction time condition), with age included as a covariate. Further correlation and regression analyses assessed whether age affected initiation time, preparation time, or the delay between them (i.e., initiation time minus preparation time). Data submitted to correlation analyses were screened for outliers using the “robust correlation” MATLAB toolbox (23). This toolbox provides an objective approach to identifying and removing outliers without loss of statistical power. Where outliers were identified we report the “skipped” Pearson correlation (calculated by removing outliers and determining the correlation for the remaining datapoints), which directly reflects Pearson’s r (23). Note that the inclusion/removal of outliers did not change any of our empirical results. Where appropriate, additional Bayesian analyses were conducted to determine the level of evidence in support of the null hypothesis (BF01), with classifications according to the study by Wagenmakers et al. (24). In the Bayesian analyses, outliers were removed based on the robust correlation procedure outlined earlier. Again, the inclusion/removal of outliers did not change any of our empirical results.
A series of control analyses examined the effects of the different experimental conditions and participant age, on behavior. We first conducted correlation and regression analyses to determine whether participants completed the free and forced reaction time conditions with similar peak movement velocities. Possible differences were considered in a RMANOVA comparing peak movement velocity across conditions (free vs. forced reaction time conditions), including age as a covariate. Additional correlation and regression analyses considered the relationship between participant age and peak movement velocity in the free and forced reaction time conditions. Further analyses examined possible effects of age on participant behavior in the forced reaction time condition. Possible effects of age on asymptotic accuracy (identified based on the model fit to the data for each participant) were examined using correlation and regression analyses. Possible effects of age on timing accuracy were also assessed; response asynchrony was calculated as the difference in time between the fourth tone and the start of the participant’s response (25). Negative values therefore corresponded to moving before the fourth tone, and positive values corresponded to moving after the fourth tone. Correlation and regression analyses then assessed the possible relationship between age and both signed and absolute response asynchrony.
All regression analyses are presented with bootstrapped 95% confidence intervals, calculated using resampling with replacement (26). A linear model was fit to each resampled population, and a line of best fit was then interpolated from the model parameters. This process was repeated 10,000 times, with the 2.5 and 97.5 percentiles of the interpolated fits being used as confidence intervals.
RESULTS
Initiation Time and Preparation Time Dissociate
In line with our previous work, we found a significant difference between initiation time, as measured using the free reaction time condition, and preparation time, as measured using the forced reaction time condition, F1,52 = 77.7, P < 0.001 (see Fig. 2 for example data). Participants’ reaction times were significantly longer than the time they needed to prepare an accurate action in the forced reaction time condition [t = 24.82, P < 0.01, mean initiation time (free reaction time condition) = 290 ± 34 ms, mean preparation time (forced reaction time condition) = 195 ± 26 ms, mean difference = 94 ± 28 ms].
Figure 2.
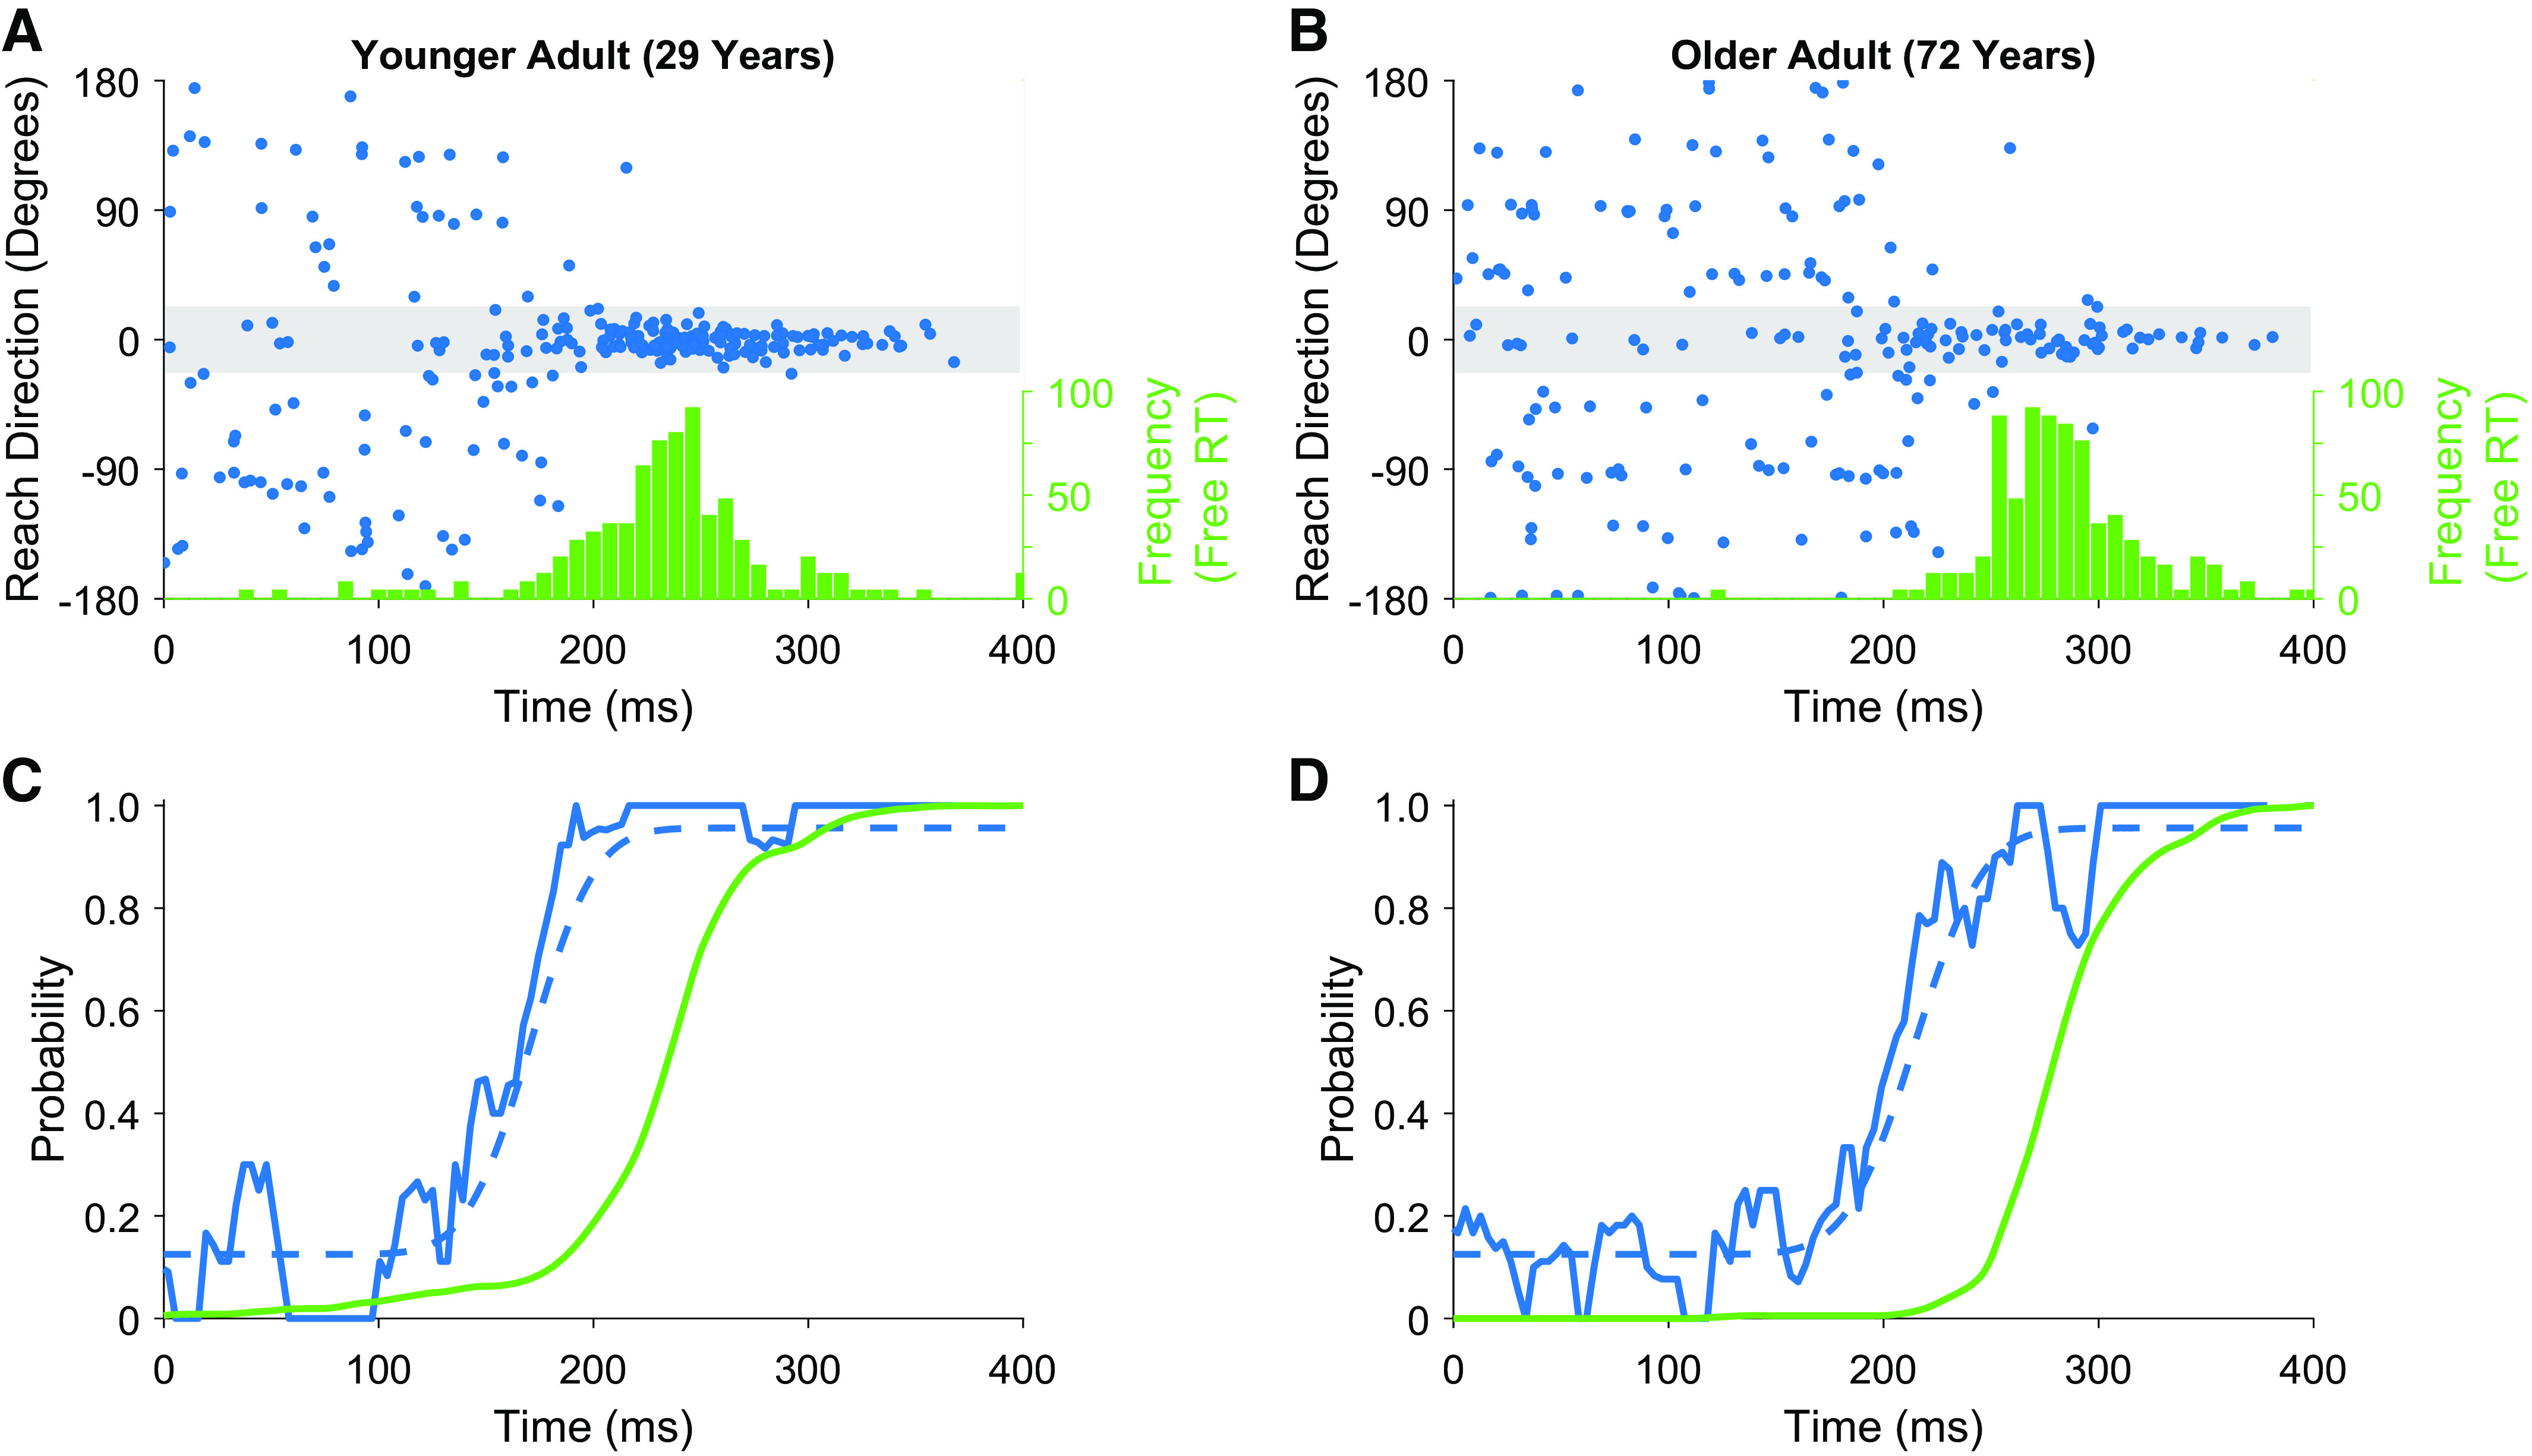
Data from example participants. A and B, top: the distribution of reaction times in the free reaction time condition (green histogram) and responses from individual trials in the forced reaction time condition (blue dots). Responses falling within the gray shaded area were initiated in the correct direction. C and D, bottom: a processed version of the data for the subject above. The solid green lines present a cumulative distribution of reaction times from the free reaction time condition. blue lines present data from the forced reaction time condition; solid blue lines show a sliding window of successful responses, while dashed blue lines represent model fit to the data based on a cumulative Gaussian.
Both Initiation Time and Preparation Time Increase with Age
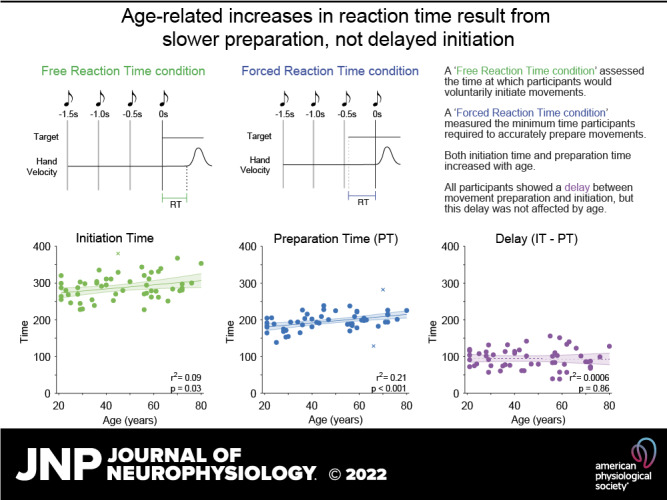
Although age was not a significant covariate in the RMANOVA for within-subject comparisons of reaction and preparation times (F1,52 = 0.032, P = 0.86), between-participants comparisons indicated that response times increased significantly with age (F1,52 = 8.0, P = 0.007). Further analyses assessed the correlation between age, reaction time, and preparation time. Replicating the findings of previous research, we found that increased age was related to a significant increase in reaction times in the free reaction time condition (1 outlier removed, skipped Pearson’s r = 0.30, P = 0.03; Fig. 3A). Analysis of data from the forced reaction time condition also revealed that movement preparation time increased significantly with age (2 outliers removed, skipped Pearson’s r = 0.45, P = 0.0007; Fig. 3B). Accuracy in the free response condition was high for all participants (mean 98.9 ± 1.3%), and analysis indicated there was no significant correlation between accuracy and age (r = −0.08, P = 0.56). Further Bayesian correlation analysis found substantial evidence for the null hypothesis (BF01 = 5.0), indicating that performance in the free response condition was close to ceiling for all participants, regardless of their age.
Figure 3.
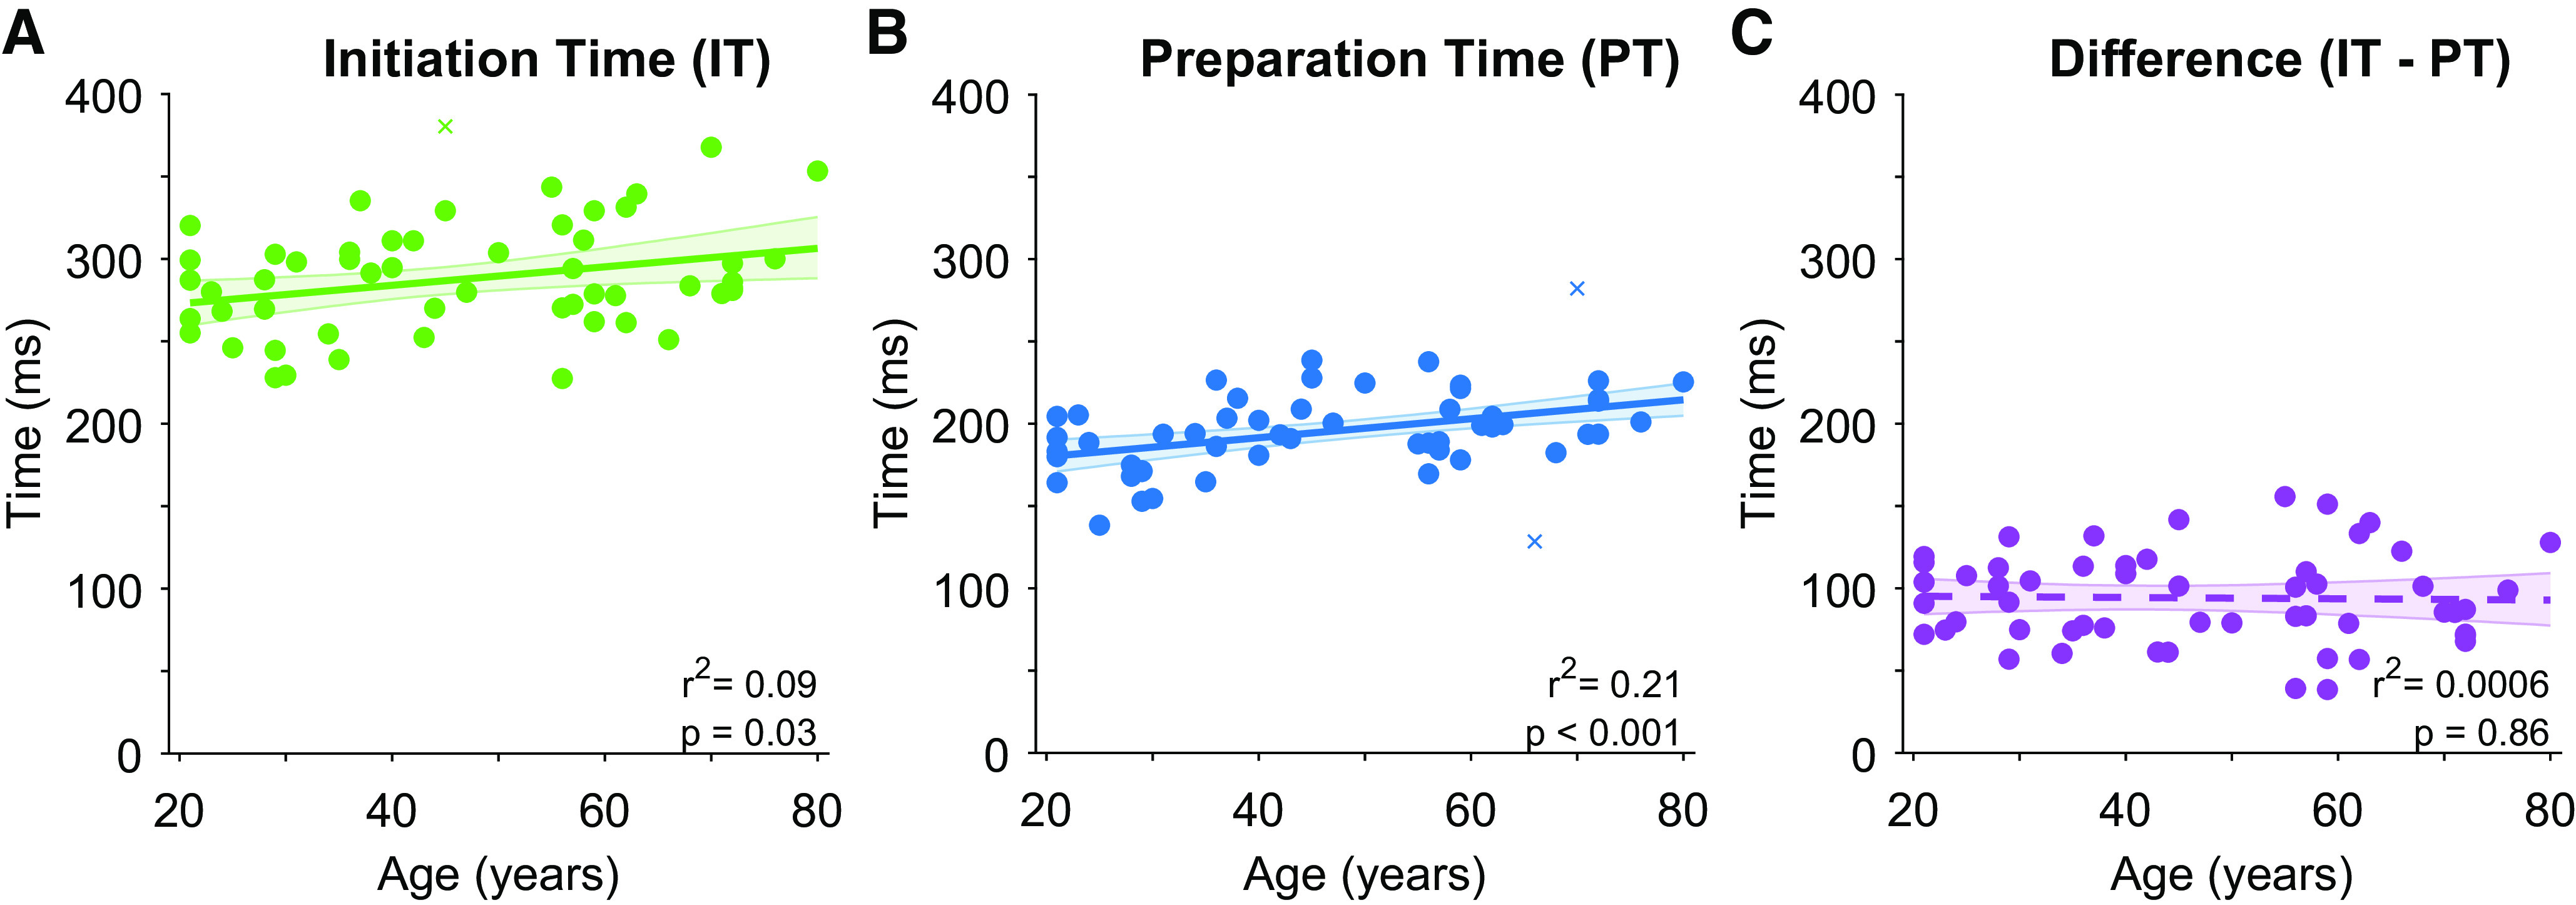
Relationships between age and movement initiation time (free reaction time condition), preparation time (forced reaction time condition), and the delay between movement (preparation and initiation). Each point presents data from a single subject (crosses indicate outliers as identified by robust correlation analysis, which were not included in summary statistics). Solid line presents linear regression on the data, dashed lines present nonsignificant regression lines. Error bars present bootstrapped 95% confidence intervals.
Age Does Not Affect the Delay between Movement Preparation and Initiation
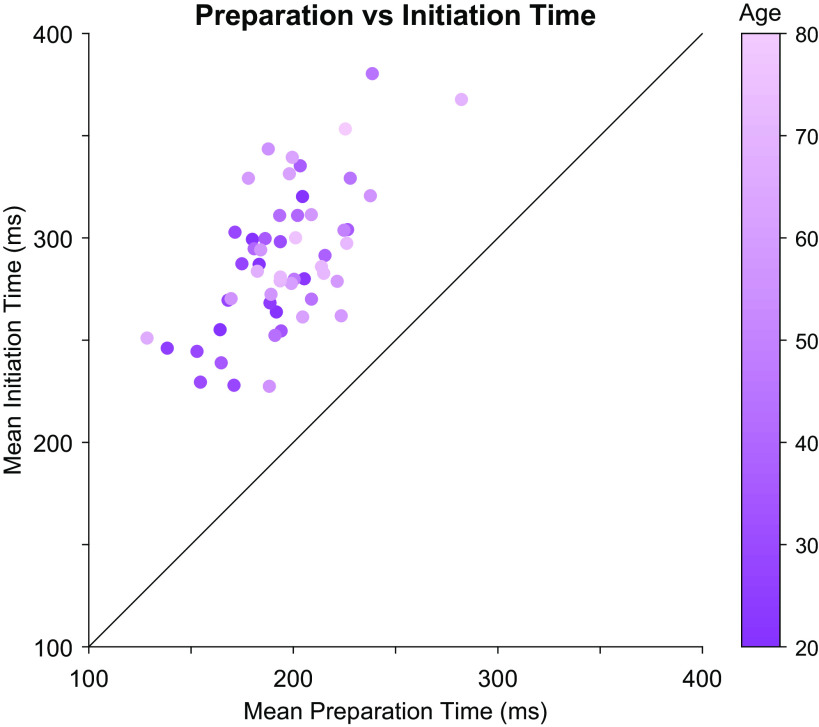
The delay between movement preparation and initiation was calculated for each participant by taking their mean reaction time, as established in the free reaction time condition, and subtracting their mean preparation time, established based on the speed-accuracy trade-off observed in the forced reaction time condition (Fig. 4). Although there was a strong correlation between movement preparation and initiation times (r = 0.61, P < 0.001), as identified in an earlier analysis, there was a clear dissociation between these variables, with all participants exhibited a delay between movement preparation and initiation (means ± SD = 94 ± 28 ms; see Fig. 4). There was, however, no significant relationship between age and the duration of the delay (Fig. 3C, Pearson’s r = −0.025, P = 0.86). Further analysis using Bayesian correlation indicated that there was substantial support for the null hypothesis (BF01 = 5.801) (24) that age did not affect the delay between movement preparation and initiation.
Figure 4.
Preparation time vs initiation time. Each circle represents one participant, with lighter colors presenting increasingly older participants. Note that each participant’s initiation time (average of reaction times for that participant in the free reaction time condition) was greater than their preparation time (average time of response preparation based on a model fit to data for that participant in the forced reaction time condition).
Peak Movement Velocity Was Correlated across Conditions and Decreased with Age
Control analyses examined whether peak movement velocity affected performance within and across conditions. Participant peak movement velocity in the free and forced reaction time conditions was highly correlated (8 outliers removed, skipped Pearson’s r = 0.79, P = 5.7916e-11 Fig. 5A). A corresponding RMANOVA found no significant difference between peak movement velocity in the free and forced reaction time conditions (RMANOVA, F1,52 = 0.87, P = 0.36), suggesting participant movement speeds were consistent between the two conditions. As older age is associated with slower movement speeds, we also examined whether peak movement velocity differed with age. Age was not a significant covariate in the RMANOVA (F1,52, = 0.31, P = 0.58), but the analysis indicated a trend for age as a between-subjects effect on peak velocity (RMANOVA, F1,52 = 3.7, P = 0.06). Correlation analyses suggested that peak velocities decreased with age, with trends for this effect in both the free reaction time condition (Pearson’s r = −0.26, P = 0.055; Fig. 5B) and forced reaction time condition (Pearson’s r = −0.24, P = 0.088; Fig. 5C).
Figure 5.
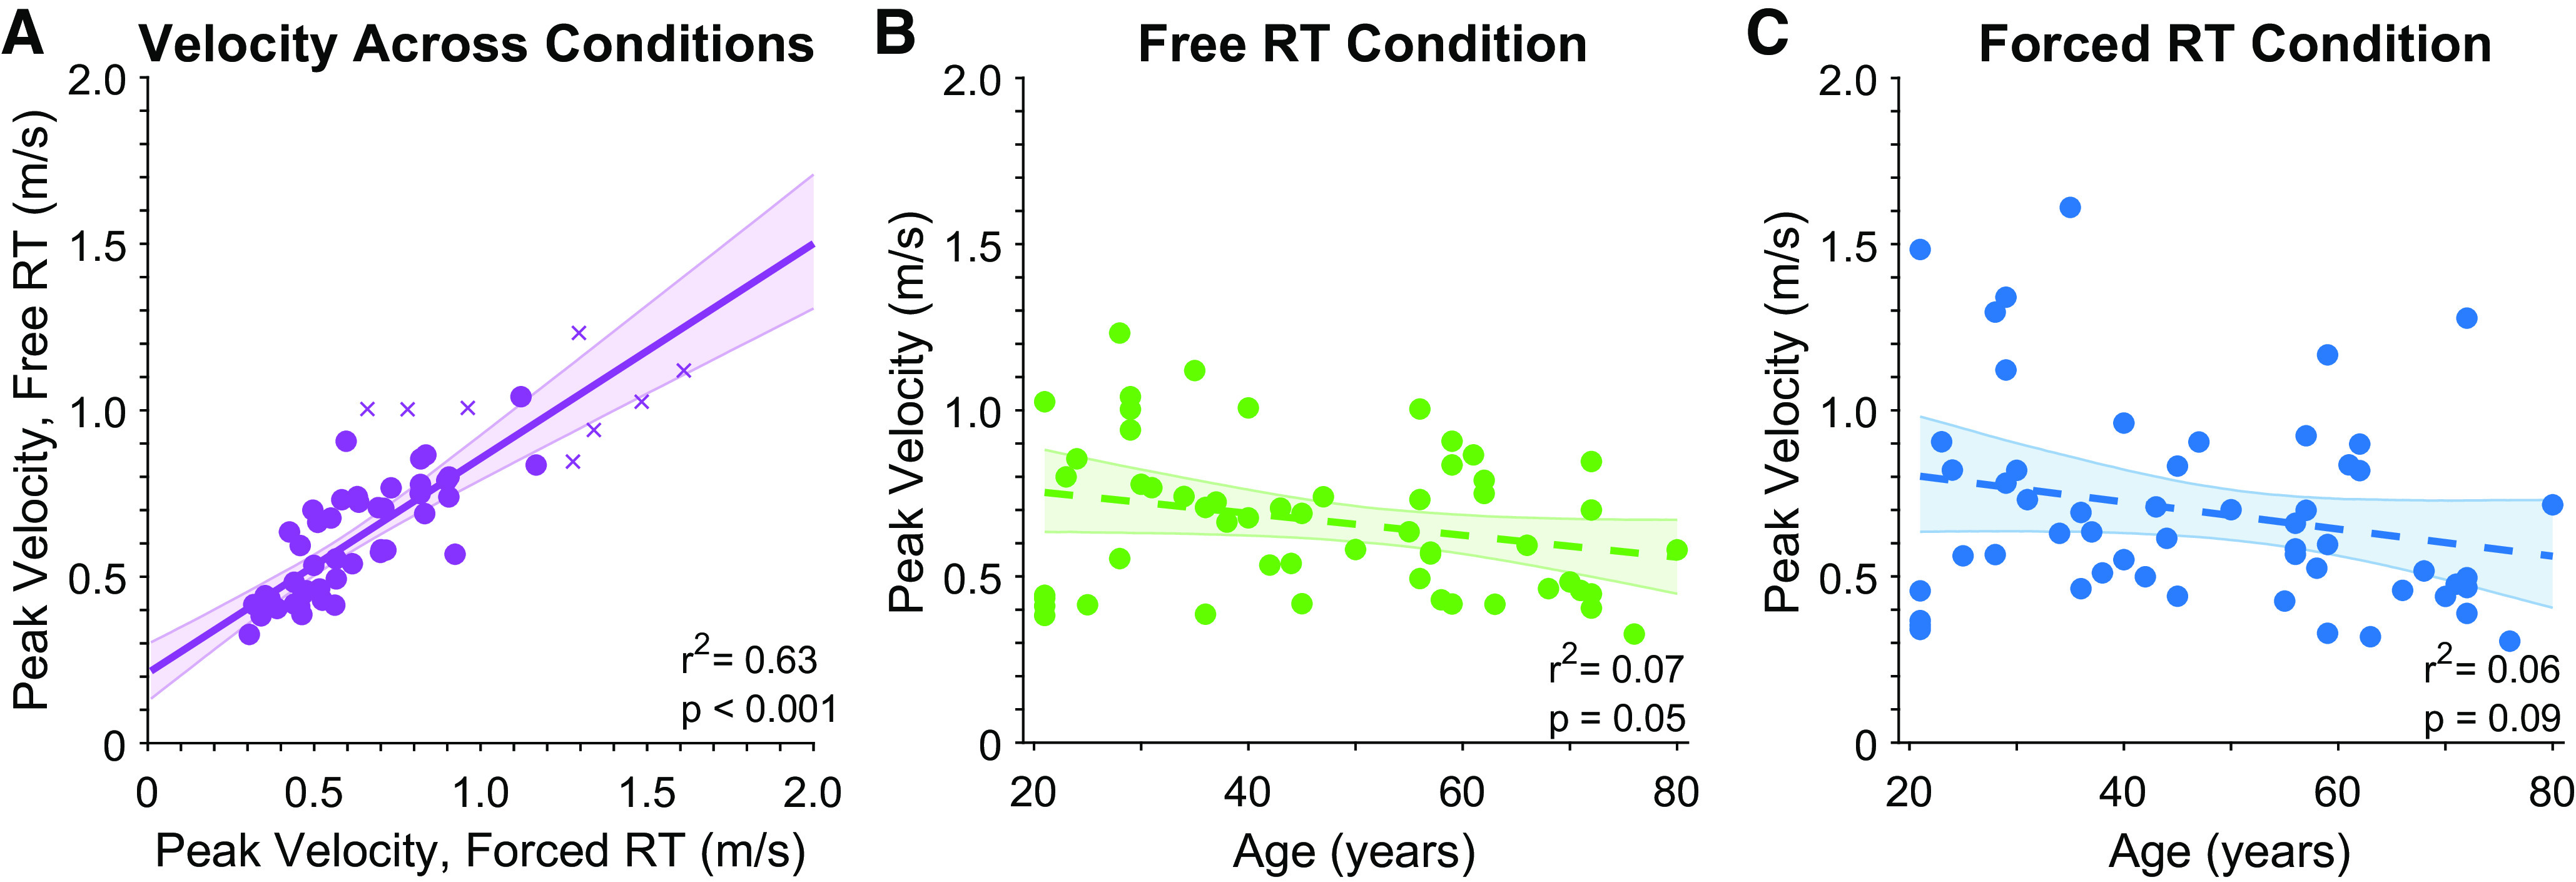
Analyses of peak velocity. A: correlation between peak velocity in the free and forced reaction time conditions. B and C: correlations between peak velocity and age in the free and forced reaction time conditions, respectively. Each point presents data from a single subject (crosses indicate outliers as identified by robust correlation analysis, which were not included in summary statistics). Solid line presents linear regression on the data, dashed lines present nonsignificant regression lines. Error bars present bootstrapped 95% confidence intervals. RT, response time.
Further analysis examined whether differences in movement speed across ages might have accounted for the observed differences in preparation time and initiation time. We found no significant relationship between reaction time and peak velocity in the free reaction time condition (Pearson’s r = −0.14, P = 0.30; Fig. 6A), or the Forced Reaction Time Condition (1 outlier removed, skipped Pearson’s r = −0.18, P = 0.19, Fig. 6B). Bayesian analysis indicated that there was substantial support for the null hypothesis when comparing reaction time and peak velocity in the free reaction time condition (BF01 = 3.5) and anecdotal evidence for the null hypothesis in the forced reaction time condition (BF01 = 2.6).
Figure 6.
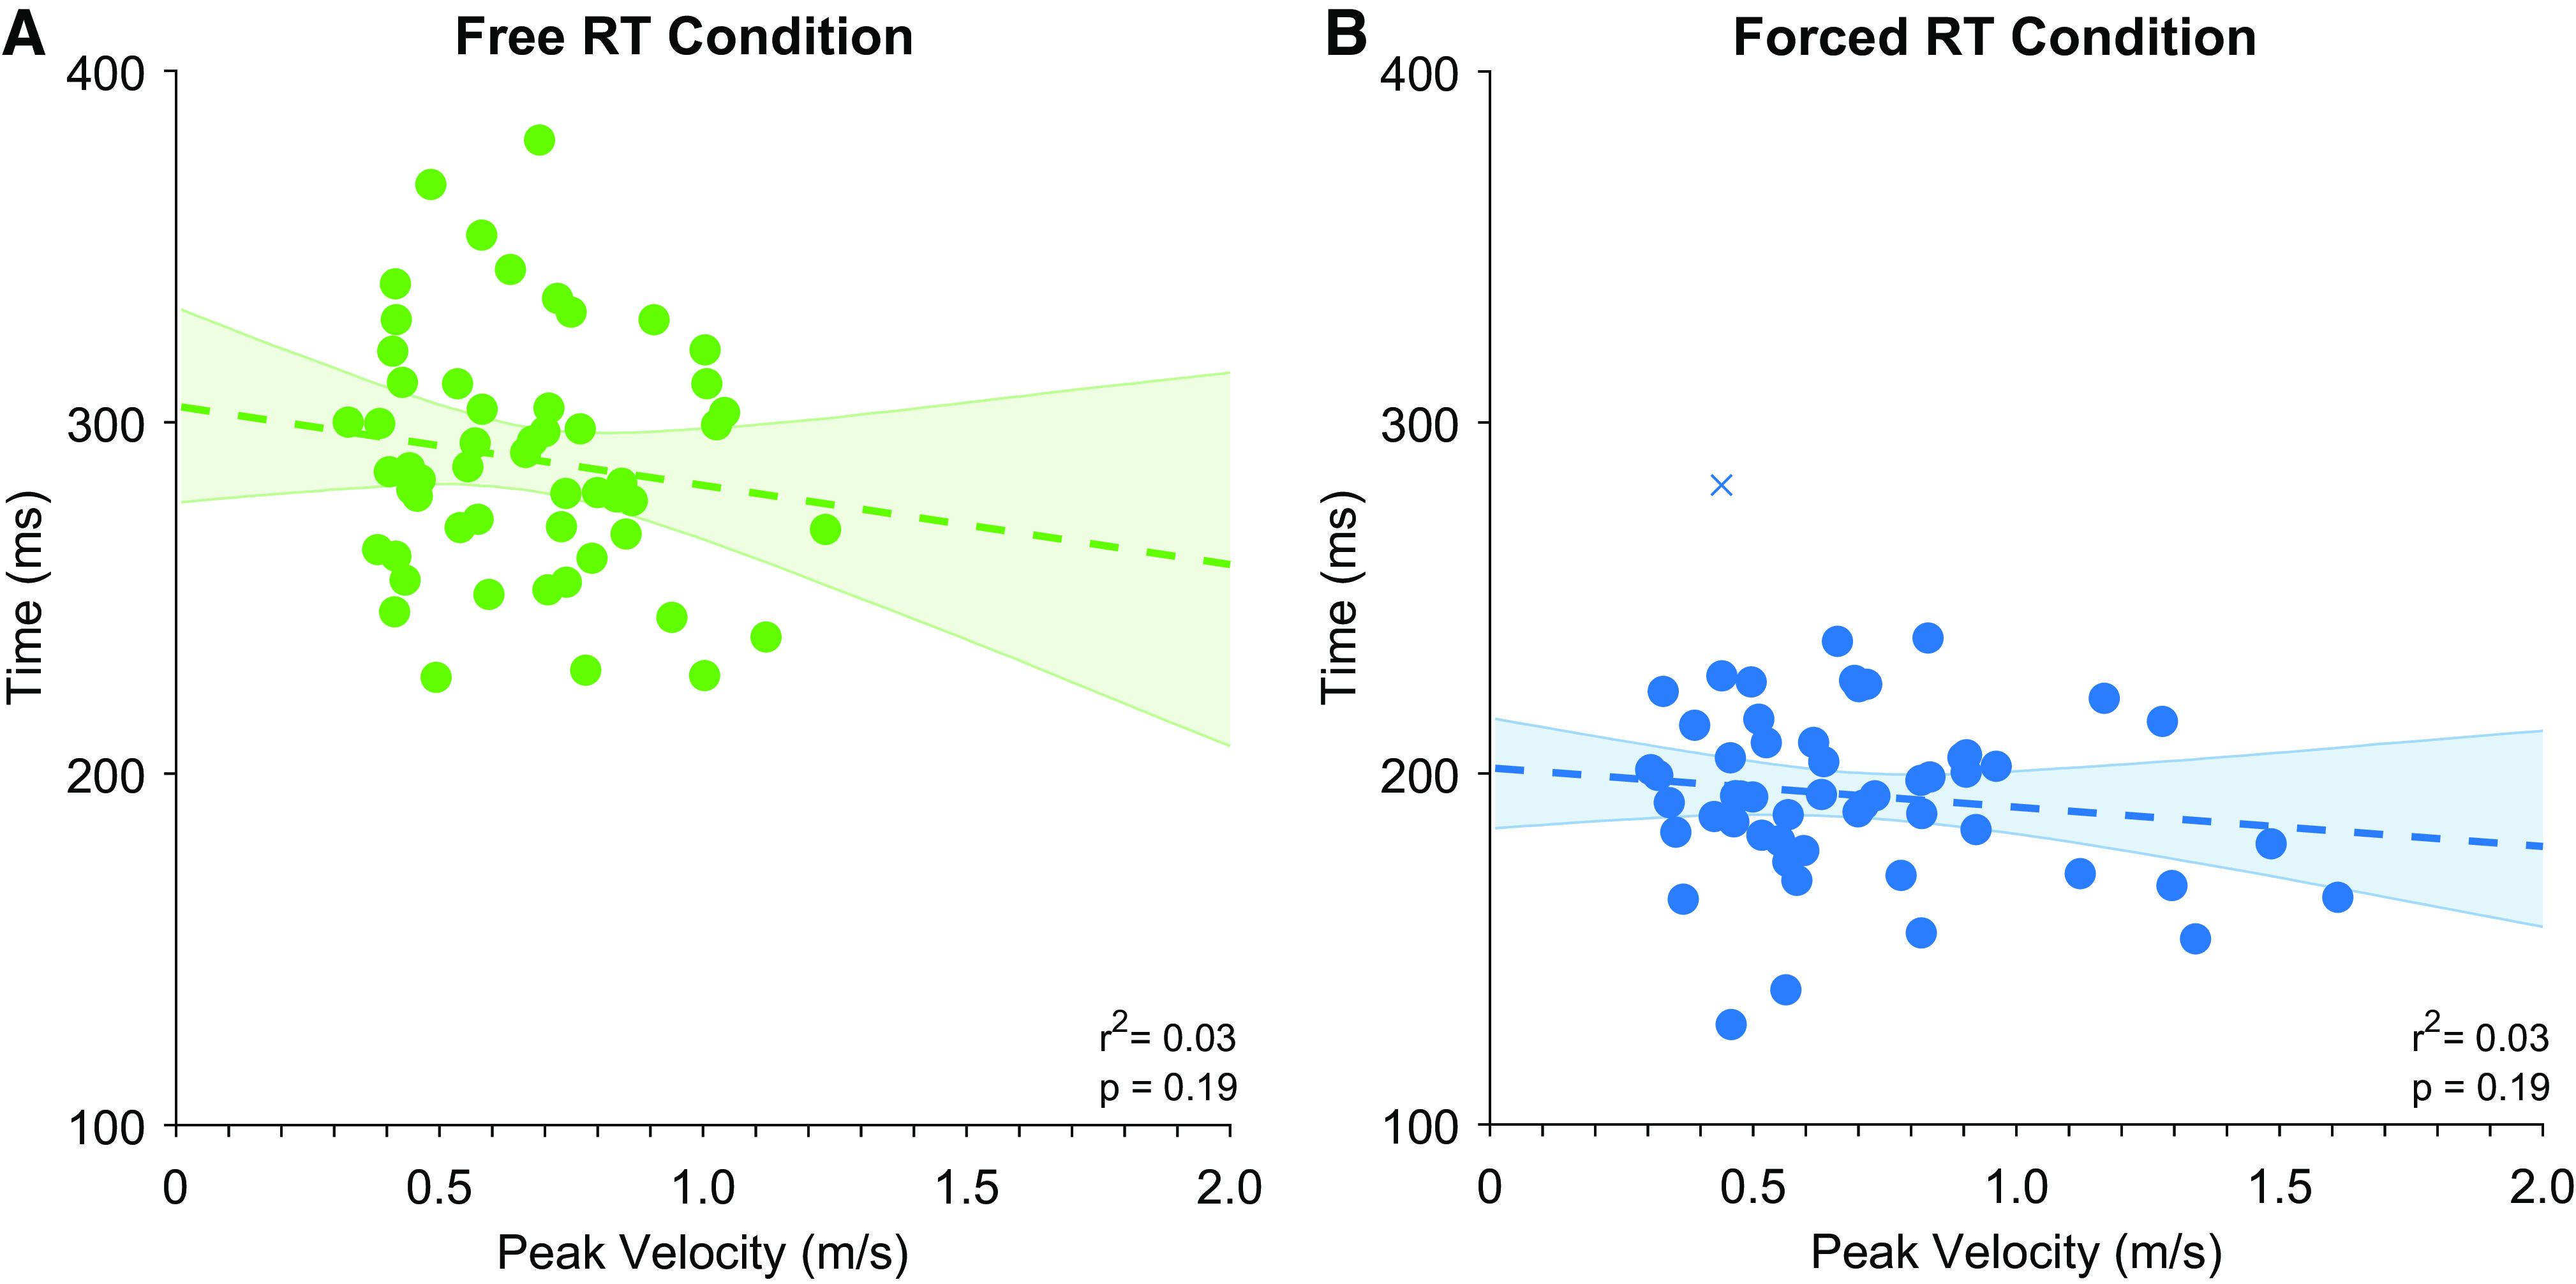
Comparisons of peak velocity and reaction time for the free reaction time condition (A) and forced reaction time (B) conditions. Each point presents data from a single subject (crosses indicate outliers as identified by robust correlation analysis, which were not included in summary statistics). Dashed lines present nonsignificant regression lines. Error bars present bootstrapped 95% confidence intervals. RT, response time.
Asymptotic Accuracy in the Forced Reaction Time Condition Decreased with Age
A correlation analysis indicated that asymptotic accuracy in the forced reaction time condition decreased significantly with age (r = −0.34, P = 0.012; see Fig. 7A). This decline occurred at a relatively low rate (0.0017% decrease in accuracy per year), corresponding to an approximate decrease of 11% from ages 20 to 80 (97% vs. 86% accuracy, respectively).
Figure 7.
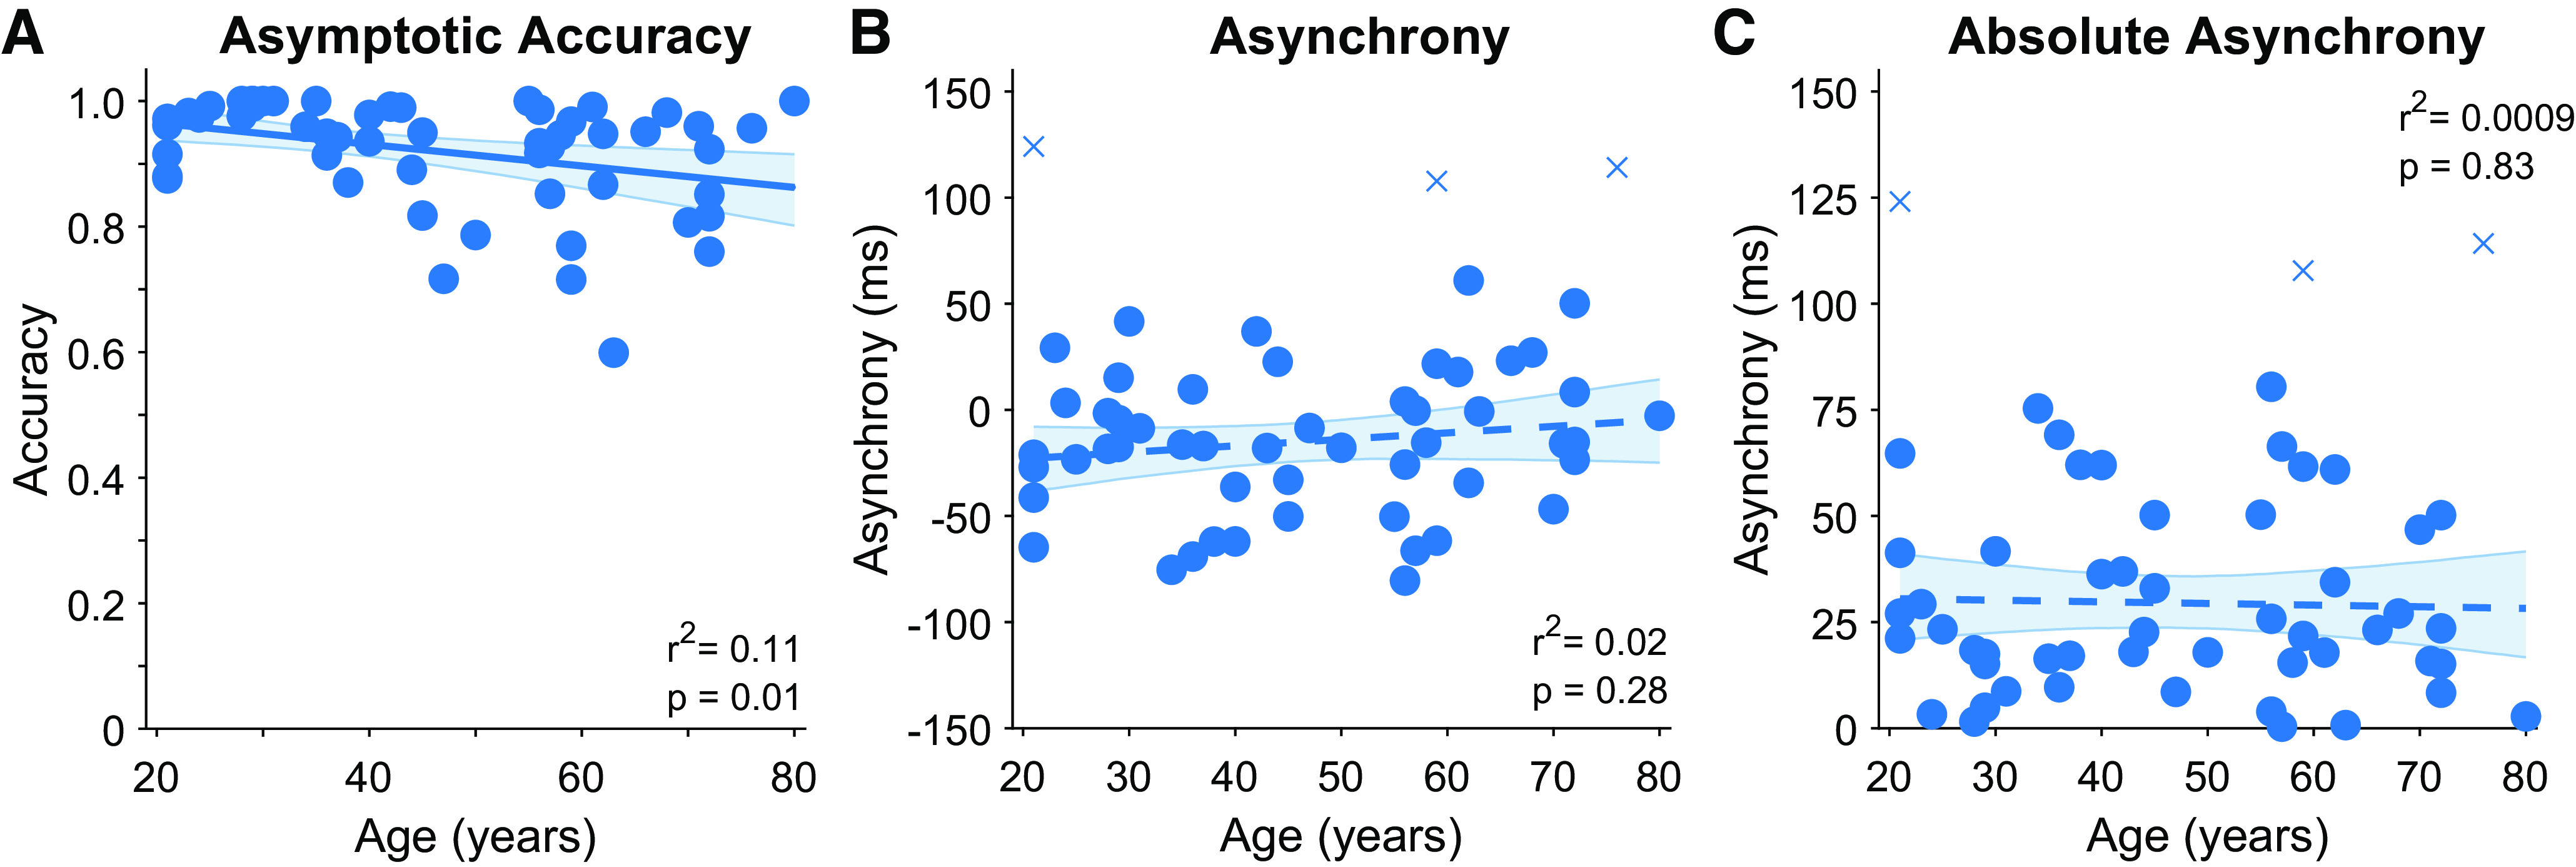
Effects of age on behavior in the forced reaction time condition. A: analysis identified a significant relationship between age and asymptotic accuracy. There was no significant relationship between age and signed response asynchrony (B), or age and absolute response asynchrony (C). Each point presents data from a single subject (crosses indicate outliers as identified by robust correlation analysis, which were not included in summary statistics). Solid line presents linear regression on the data, dashed lines present nonsignificant regression lines. Error bars present bootstrapped 95% confidence intervals.
Timing (Asynchrony) in the Forced Reaction Time Condition Did Not Differ with Age
A final analysis examined participant’s ability to time their responses in the forced reaction time condition to coincide with the fourth tone. Signed response asynchrony did not differ significantly with age (Pearson’s r = 0.15, P = 0.29, 3 outliers removed, skipped Pearson’s r = 0.16, P = 0.28: see Fig. 7B), and Bayesian analysis provided substantial evidence in support of the null hypothesis (BF01 = 3.2; Ref. 24). Absolute response asynchrony also did not differ with age (skipped Pearson’s r = −0.03, P = 0.83), with further Bayesian analysis again providing substantial support for the null hypothesis (BF01 = 5.6). Together these analyses suggest that timing asynchrony in the forced response condition did not differ significantly with age.
DISCUSSION
We used a visually guided planar reaching task to measure reaction times and assess the time participants needed to prepare accurate movements. In line with previous studies, we found that “free” reaction times increased linearly with age (1–3). We compared these data to performance in a “forced reaction time” condition, in which we measured the minimum time participants required to prepare accurate movements by forcing them to respond with shorter-than-normal response times. The time required to prepare accurate movements also increased linearly with age and was significantly shorter than the reaction time, replicating our previous observation that movements are not immediately initiated once they are prepared (13). Further analysis identified that age had no significant effect on the delay between movement preparation and initiation. These results indicate that the slower reaction times of healthy older adults observed in this task were not due to an increased hesitancy to respond, but can instead be wholly attributed to declines in the ability to process stimuli and prepare accurate movements.
Healthy human aging is associated with changes in motor behavior including declines in coordination, increased kinematic variability, and a reduced ability to modify movements to respond to changes in the environment (26, 27). Such age-related changes in behavior are accompanied by changes in brain structure and function (6–8). The increase in the amount of time required to prepare movements with age, as identified here, is consistent with these previous findings. Previous work has also suggested that healthy older adults prefer to respond with longer reaction times to ensure accurate responses (10–12). Here, we found no evidence of such age-related delays in responding. We note, however, that the simple reaching task used here had relatively low cognitive demands. Age-related declines in performance are exacerbated by increased task complexity and/or greater cognitive demand (3), consistent with frequently demonstrated differences between cognitive and motor functions (28, 29). We therefore propose that the reported delaying of action in those studies may not represent a “default policy” for older adults, but could instead occur in response to increases in task complexity.
Further analyses indicated that increasing age was associated with slower peak movement velocities in all conditions, and decreases in asymptotic accuracy in the forced reaction time condition. This reduction in accuracy may have reflected an increased propensity for lapses in concentration, particularly given the dual demands of timing and accuracy in the forced reaction time condition. Skilled motor performance is characterized by both speed and accuracy (30–34), and the present data are consistent with aforementioned and well-established age-related declines in movement control. By contrast, there was no significant effect of age on the ability to synchronize responses with the fourth tone, as evidenced by the analysis of Response Asynchrony in the Forced Reaction Time condition. Note, however, that this does not necessarily reflect spontaneous, self-selected participant behavior. Instructions to participants in the forced reaction time condition emphasized that while both the accuracy and timing of their responses were important, timing was the highest priority. Older adults may have had greater asynchrony (due to a tendency to delay their movements to wait for the target to appear, so they could reach in the correct direction) without this intervention. We therefore conclude that increasing age was associated with a decrease in overall performance (i.e., older adults had longer initiation times, longer preparation times, lower peak movement velocities, and were less accurate).
Previous work has used drift diffusion models to examine the effects of aging on response selection. This research typically suggests that older adults have slower response times because they wait to accumulate more evidence than younger adults before committing to a given response (the drift diffusion model assumes to capture this changing behavior through introducing a wider separation or decision boundary between response alternatives) (12, 35, 36), and slower “nondecision” times. However, attempts to compare the speed of information processing (assumed to be captured via the rate of evidence accumulation, or “drift rate”) between younger and older adults have provided contradictory results. Different studies suggest that older adults have slower drift rates than younger adults (35), equivalent drift rates to younger adults (12) or, counterintuitively, faster drift rates than younger adults (36). Because of these contradictory results, the exact effects of aging on the speed of information processing for response selection remain ambiguous.
The current study presented clear and easily identifiable target stimuli (i.e., a spatially cued target, rather than, for example, a cloud of asterisks or a masked letter of the alphabet, as used in typical approaches applying the drift diffusion model; see Refs. 35 and 37), but also increased the possible response alternatives (in a given trial a target could appear in one of eight possible locations, in comparison to the approach of considering only two possible responses as used in work with the drift diffusion model). This changed the demands of the task in relation to typical paradigms to which the drift-diffusion approach has been applied, which generally emphasize accumulation of evidence over time based on deliberately impoverished stimuli. The unambiguous stimuli used in the present study effectively minimized the need for evidence accumulation, and placed greater emphasis on the speed of information processing. Our results indicate that in such a context, increasing age was associated with slower response times. However, the delay between the minimum time required to process the stimulus and select a correct response (as measured by the forced reaction time task) and the time at which responses were voluntarily initiated (as measured by the free reaction time task) did not differ with age. Similar delays have also been identified when using forced reaction time paradigms with healthy younger adults when responding to impoverished dot-motion stimuli (38), indicating that this is not simply an effect of our current experimental setup. The age-related changes identified using the drift-diffusion framework therefore seem to be fundamentally different to the results of the present study, which show no change in the delay between movement preparation and initiation with age.
The conceptual framework of the drift diffusion model also does not seem to be able to account for several of the results in the present study. In the drift-diffusion framework, response preparation and the time of response initiation are considered to be the same—the response is assumed to be generated as soon as response preparation (i.e., evidence accumulation) is complete. By contrast, results of the present study, and others using similar paradigms (13, 38) indicate that there is a substantial delay between the time at which participants are able to accurately prepare movements (as identified using the forced reaction time task), and the time at which they choose to voluntarily initiate them (as measured using the free reaction time task). This delay indicates that participants hesitate before initiating accurately prepared responses. Although a greater decision boundary parameter could be considered to be a form of response hesitancy, this parameter consistently increases for healthy older adults (e.g., see Refs. 12, 35, and 36), while the delay in the present study remains consistent with age. Similarly, while it could be argued that the hesitancy identified in our study may be better aligned with the nondecision time parameter of the drift diffusion model, this parameter also consistently increases for older adults (e.g., see Refs. 12, 35, and 36), and thus could not explain the constant delay identified in the present study. We therefore believe that our “forced reaction time” approach provides a way to disentangle response preparation and response initiation, and thereby address a key aspect of response hesitancy that is inherently not possible to address in the drift-diffusion framework. In summary, our results are consistent with previous observations that humans delay the initiation of prepared movements, and show that the size of this delay remains constant across the lifespan. The consistent duration of this delay indicates that healthy older adults do not appear to change their behavior in relatively simplistic response time tasks to favor accuracy at the expense of speed. The declines in their performance observed here can instead be wholly attributed to age-related changes in their capability to process and prepare movements.
DATA AVAILABILITY
The datasets generated during and/or analyzed during the current study are available from the corresponding author on reasonable request.
GRANTS
This work was supported by National Science Foundation Grant 1358756. This project has received funding from the European Union’s Horizon 2020 research and innovation program under the Marie Skłodowska-Curie Grant Agreement No. 702784 (to R.M.H.). R.M.H. is supported by grants from the UC Louvain Special Research Fund 1 C.21300.057 and 1 C.21300.058.
DISCLOSURES
No conflicts of interest, financial or otherwise, are declared by the authors.
AUTHOR CONTRIBUTIONS
R.M.H. conceived and designed research; R.M.H., A.D.F., and M.G.C. performed experiments; R.M.H. analyzed data; R.M.H. interpreted results of experiments; R.M.H. prepared figures; R.M.H. drafted manuscript; R.M.H., A.D.F., M.G.C., K.Z., and A.M.H. edited and revised manuscript; R.M.H., A.D.F., M.G.C., K.Z., and A.M.H. approved final version of manuscript.
ACKNOWLEDGMENTS
We thank Jeff Gooding for assistance with data collection.
REFERENCES
- 1. Fozard JL, Vercryssen M, Reynolds SL, Hancock PA, Quilter RE. Age differences and changes in reaction time: the Baltimore Longitudinal Study of Aging. J Gerontol 49: P179–P189, 1994. doi: 10.1093/geronj/49.4.p179. [DOI] [PubMed] [Google Scholar]
- 2. Gottsdanker R. Age and simple reaction time. J Gerontol 37: 342–348, 1982. doi: 10.1093/geronj/37.3.342. [DOI] [PubMed] [Google Scholar]
- 3. Woods DL, Wyma JM, Yund EW, Herron TJ, Reed B. Age-related slowing of response selection and production in a visual choice reaction time task. Front Hum Neurosci 9: 193, 2015. doi: 10.3389/fnhum.2015.00193. [DOI] [PMC free article] [PubMed] [Google Scholar]
- 4. Seidler RD, Bernard JA, Burutolu TB, Fling BW, Gordon MT, Gwin JT, Kwak Y, Lipps DB. Motor control and aging: links to age-related brain structural, functional, and biochemical effects. Neurosci Biobehav Rev 34: 721–733, 2010. doi: 10.1016/j.neubiorev.2009.10.005. [DOI] [PMC free article] [PubMed] [Google Scholar]
- 5. Giorgio A, Santelli L, Tomassini V, Bosnell R, Smith S, De Stefano N, Johansen-Berg H. Age-related changes in grey and white matter structure throughout adulthood. NeuroImage 51: 943–951, 2010. doi: 10.1016/j.neuroimage.2010.03.004. [DOI] [PMC free article] [PubMed] [Google Scholar]
- 6. Stadlbauer A, Salomonowitz E, Strunk G, Hammen T, Ganslandt O. Age-related degradation in the central nervous system: assessment with diffusion-tensor imaging and quantitative fiber tracking. Radiology 247: 179–188, 2008. doi: 10.1148/radiol.2471070707. [DOI] [PubMed] [Google Scholar]
- 7. Heuninckx S, Wenderoth N, Swinnen SP. Systems neuroplasticity in the aging brain: recruiting additional neural resources for successful motor performance in elderly persons. J Neurosci 28: 91–99, 2008. doi: 10.1523/JNEUROSCI.3300-07.2008. [DOI] [PMC free article] [PubMed] [Google Scholar]
- 8. Dully J, McGovern DP, O'Connell RG. The impact of natural aging on computational and neural indices of perceptual decision making: a review. Behav Brain Res 355: 48–55, 2018. doi: 10.1016/j.bbr.2018.02.001. [DOI] [PubMed] [Google Scholar]
- 9. Fitts PM. The information capacity of the human motor system in controlling the amplitude of movement. J Exp Psychol 47: 381–391, 1954. doi: 10.1037/h0055392. [DOI] [PubMed] [Google Scholar]
- 10. Salthouse TA. Adult age and the speed-accuracy trade-off. Ergonomics 22: 811–821, 1979. doi: 10.1080/00140137908924659. [DOI] [PubMed] [Google Scholar]
- 11. Smith GA, Brewer N. Slowness and age: speed-accuracy mechanisms. Psychol Aging 10: 238–247, 1995. doi: 10.1037//0882-7974.10.2.238. [DOI] [PubMed] [Google Scholar]
- 12. Starns JJ, Ratcliff R. The effects of aging on the speed-accuracy compromise: boundary optimality in the diffusion model. Psychol Aging 25: 377–390, 2010. doi: 10.1037/a0018022. [DOI] [PMC free article] [PubMed] [Google Scholar]
- 13. Haith AM, Pakpoor J, Krakauer JW. Independence of movement preparation and movement initiation. J Neurosci 36: 3007–3015, 2016. doi: 10.1523/JNEUROSCI.3245-15.2016. [DOI] [PMC free article] [PubMed] [Google Scholar]
- 14. Ghez C, Favilla M, Ghilardi MF, Gordon J, Bermejo R, Pullman S. Discrete and continuous planning of hand movements and isometric force trajectories. Exp Brain Res 115: 217–233, 1997. doi: 10.1007/pl00005692. [DOI] [PubMed] [Google Scholar]
- 15. Haith AM, Huberdeau DM, Krakauer JW. The influence of movement preparation time on the expression of visuomotor learning and savings. J Neurosci 35: 5109–5117, 2015. doi: 10.1523/JNEUROSCI.3869-14.2015. [DOI] [PMC free article] [PubMed] [Google Scholar]
- 16. Haith AM, Huberdeau DM, Krakauer JW. Hedging your bets: intermediate movements as optimal behavior in the context of an incomplete decision. PLoS Comput Biol 11: e1004171, 2015. doi: 10.1371/journal.pcbi.1004171. [DOI] [PMC free article] [PubMed] [Google Scholar]
- 17. Hardwick RM, Forrence AD, Krakauer JW, Haith AM. Time-dependent competition between goal-directed and habitual response preparation. Nat Hum Behav 3: 1252–1262, 2019. doi: 10.1038/s41562-019-0725-0. [DOI] [PubMed] [Google Scholar]
- 18. Bugg JM, Zook NA, DeLosh EL, Davalos DB, Davis HP. Age differences in fluid intelligence: contributions of general slowing and frontal decline. Brain Cogn 62: 9–16, 2006. doi: 10.1016/j.bandc.2006.02.006. [DOI] [PubMed] [Google Scholar]
- 19. Hulley SB, Cummings SR, Browner WS, Grady DG, Newman TB. Designing Clinical Research (3rd ed.). Philadelphia, PA: Lippincott Williams & Wilkins, 2007. [Google Scholar]
- 20. Nasreddine ZS, Phillips NA, Bédirian V, Charbonneau S, Whitehead V, Collin I, Cummings JL, Chertkow H. The Montreal Cognitive Assessment, MoCA: a brief screening tool for mild cognitive impairment. J Am Geriatr Soc 53: 695–699, 2005. [Erratum in J Am Geriatr Soc 67: 1991, 2019]. doi: 10.1111/j.1532-5415.2005.53221.x. [DOI] [PubMed] [Google Scholar]
- 21. Hardwick RM, Dagioglou M, Miall RC. State estimation and the cerebellum. In: Handbook of the Cerebellum and Cerebellar Disorders, edited by Manto M, Schmahmann JD, Rossi F, Gruol DL, Koibuchi N, Dordrecht. The Netherlands: Springer, 2013, p. 1297–1313. [Google Scholar]
- 22. Frith CD, Done DJ. Routes to action in reaction time tasks. Psychol Res 48: 169–177, 1986. doi: 10.1007/BF00309165. [DOI] [PubMed] [Google Scholar]
- 23. Pernet C, Wilcox R, Rousselet G. Robust correlation analyses: false positive and power validation using a new open source Matlab toolbox. Front Psychol 3: 606, 2012. doi: 10.3389/fpsyg.2012.00606. [DOI] [PMC free article] [PubMed] [Google Scholar]
- 24. Wagenmakers E-J, Wetzels R, Borsboom D, van der Maas HLJ. Why psychologists must change the way they analyze their data: the case of psi: comment on Bem (2011). J Pers Soc Psychol 100: 426–432, 2011. doi: 10.1037/a0022790. [DOI] [PubMed] [Google Scholar]
- 25. Vleugels LWE, Swinnen SP, Hardwick RM. Skill acquisition is enhanced by reducing trial-to-trial repetition. J Neurophysiol 123: 1460–1471, 2020. doi: 10.1152/jn.00741.2019. [DOI] [PMC free article] [PubMed] [Google Scholar]
- 26. Hardwick RM, Celnik PA. Cerebellar direct current stimulation enhances motor learning in older adults. Neurobiol Aging 35: 2217–2221, 2014. doi: 10.1016/j.neurobiolaging.2014.03.030. [DOI] [PMC free article] [PubMed] [Google Scholar]
- 27. Sarlegna FR. Impairment of online control of reaching movements with aging: a double-step study. Neurosci Lett 403: 309–314, 2006. doi: 10.1016/j.neulet.2006.05.003. [DOI] [PubMed] [Google Scholar]
- 28. Wollenweber FA, Halfter S, Brügmann E, Weinberg C, Cieslik EC, Müller VI, Hardwick RM, Eickhoff SB. Subtle cognitive deficits in severe alcohol addicts—do they show a specific profile? J Neuropsychol 8: 147–153, 2014. doi: 10.1111/jnp.12001. [DOI] [PubMed] [Google Scholar]
- 29. Wu T, Kansaku K, Hallett M. How self-initiated memorized movements become automatic: a functional MRI study. J Neurophysiol 91: 1690–1698, 2004. doi: 10.1152/jn.01052.2003. [DOI] [PubMed] [Google Scholar]
- 30. Hardwick RM, Rajan VA, Bastian AJ, Krakauer JW, Celnik PA. Motor learning in stroke: trained patients are not equal to untrained patients with less impairment. Neurorehabil Neural Repair 31: 178–189, 2017. doi: 10.1177/1545968316675432. [DOI] [PMC free article] [PubMed] [Google Scholar]
- 31. Rajan VA, Hardwick RM, Celnik PA. Reciprocal intralimb transfer of skilled isometric force production. J Neurophysiol 122: 60–65, 2019. doi: 10.1152/jn.00840.2018. [DOI] [PMC free article] [PubMed] [Google Scholar]
- 32. Reis J, Schambra HM, Cohen LG, Buch ER, Fritsch B, Zarahn E, Celnik PA, Krakauer JW. Noninvasive cortical stimulation enhances motor skill acquisition over multiple days through an effect on consolidation. Proc Natl Acad Sci USA 106: 1590–1595, 2009. doi: 10.1073/pnas.0805413106. [DOI] [PMC free article] [PubMed] [Google Scholar]
- 33. Shmuelof L, Yang J, Caffo B, Mazzoni P, Krakauer JW. The neural correlates of learned motor acuity. J Neurophysiol 112: 971–980, 2014. doi: 10.1152/jn.00897.2013. [DOI] [PMC free article] [PubMed] [Google Scholar]
- 34. Shmuelof L, Krakauer JW, Mazzoni P. How is a motor skill learned? Change and invariance at the levels of task success and trajectory control. J Neurophysiol 108: 578–594, 2012. doi: 10.1152/jn.00856.2011. [DOI] [PMC free article] [PubMed] [Google Scholar]
- 35. Thapar A, Ratcliff R, McKoon G. A diffusion model analysis of the effects of aging on letter discrimination. Psychol Aging 18: 415–429, 2003. doi: 10.1037/0882-7974.18.3.415. [DOI] [PMC free article] [PubMed] [Google Scholar]
- 36. Ratcliff R, Thapar A, McKoon G. The effects of aging on reaction time in a signal detection task. Psychol Aging 16: 323–341, 2001. doi: 10.1037/0882-7974.16.2.323. [DOI] [PubMed] [Google Scholar]
- 37. Starns JJ, Ratcliff R. Age-related differences in diffusion model boundary optimality with both trial-limited and time-limited tasks. Psychon Bull Rev 19: 139–145, 2012. doi: 10.3758/s13423-011-0189-3. [DOI] [PubMed] [Google Scholar]
- 38. Resulaj A, Kiani R, Wolpert DM, Shadlen MN. Changes of mind in decision-making. Nature 461: 263–266, 2009. doi: 10.1038/nature08275. [DOI] [PMC free article] [PubMed] [Google Scholar]
Associated Data
This section collects any data citations, data availability statements, or supplementary materials included in this article.
Data Availability Statement
The datasets generated during and/or analyzed during the current study are available from the corresponding author on reasonable request.


