

Abstract
Immuno-PET using desferrioxamine (DFO)-conjugated zirconium-89 ([89Zr]Zr4+)-labeled antibodies is a powerful tool used for preclinical and clinical molecular imaging. However, a comprehensive study evaluating the variables involved in DFO-conjugation and 89Zr-radiolabeling of antibodies, and their impact on the in vitro and in vivo behavior of the resulting radioimmunoconjugates has not been adequately performed. Here, we synthesized different DFO-conjugates of the HER2-targeting antibody (Ab) – trastuzumab – dubbed T5, T10, T20, T60, and T200 – to indicate the molar equivalents of DFO used for bioconjugation. Next we radiolabeled the immunoconjugates with ([89Zr]Zr4+) under a comprehensive set of reaction conditions including different buffers (PBS, chelexed-PBS, TRIS/HCl, HEPES; ± radioprotectants), different reaction volumes (0.1–1 mL), variable amounts of DFO-conjugated Ab (5, 25, 50 μg) and radioactivity (0.2–1.0 mCi; 7.4–37 MBq). We evaluated the effects of these variables on radiochemical yield (RCY), molar activity (Am)/ specific activity (As), immunoreactive fraction, and ultimately the in vivo biodistribution profile and tumor targeting ability of the trastuzumab radioimmunoconjugates. We show that increasing the degree of DFO conjugation to trastuzumab increased the RCY (~90%) and Am; As (~194 MBq/nmol; 35 mCi/mg) but decreased the HER2-binding affinity (3.5x-4.6x) and the immunoreactive fraction of trastuzumab down to 50–64%, which translated to dramatically inferior in vivo performance of the radioimmunoconjugate. Cell-based immunoreactivity assays and standard binding affinity analyses using surface plasmon resonance (SPR) did not predict the poor in vivo performance of the most extreme T200 conjugate. However, SPR-based concentration free calibration analysis yielded active antibody concentration and was predictive of the in vivo trends. Positron emission tomography (PET) imaging and biodistribution studies in a HER2-positive xenograft model revealed activity concentrations of 38.7 ± 3.8 %ID/g in the tumor and 6.3 ± 4.1 %ID/g in the liver for ([89Zr]Zr4+)-T5 (~1.4 ± 0.5 DFOs/Ab) at 120 h after injection of the radioimmunoconjugates. On the other hand, ([89Zr]Zr4+)-T200 (10.9 ± 0.7 DFOs/Ab) yielded 16.2 ± 3.2 %ID/g in the tumor versus 27.5 ± 4.1 %ID/g in the liver. Collectively, our findings suggest that synthesizing trastuzumab immunoconjugates bearing 1–3 DFOs per Ab (T5 and T10) combined with radiolabeling performed in low reaction volumes using chelexed-PBS without a radioprotectant provided radioimmunoconjugates having high Am; As (97 MBq/nmol; 17.5 ± 2.2 mCi/mg), highly preserved immunoreactive fractions (86–93%), and favorable in vivo biodistribution profile with excellent tumor uptake.
Keywords: trastuzumab, 89Zr, DFO, desferrioxamine, antibody modification, chelator conjugation, specific activity, surface plasmon resonance, radiometals, immuno-PET
Graphical Abstract

INTRODUCTION
Among the radionuclides available for use in nuclear medicine and molecular imaging, there are only a few that possess nuclear decay properties suitable for pairing with the in vivo pharmacokinetics of macromolecules such as antibodies.1–4 The last decade has witnessed a surge in the use of the radiometal zirconium-89 ([89Zr]Zr4+) owing to its excellent properties ([89Zr]Zr4+, t1/2 = 78.4 hr, β+ ratio = 22.7%, Eβ+(mean)= 396 keV) including robust chelation at ambient temperature using the chelator desferrioxamine (DFO).1–3 The popularity of 89Zr-immunoPET has inspired the development of new chelators that offer improved stability against in vitro and in vivo demetallation, which requires improvement of the coordination chemistry for ([89Zr]Zr4+) by increasing the denticity (coordination number) and type of chelating moieties.5–10 However, the bifunctional chelator – p-SCN-Ph-DFO remains the most widely used reagent for ([89Zr]Zr4+) chelation for preclinical research and clinical application.11 For almost a decade, the conjugation of p-SCN-Ph-DFO to antibodies has been performed using a method published by Vosjan et al.12 Briefly, this method relies on non-specific conjugation of an isothiocyanate-derivative of DFO via reaction with solvent-accessible lysine residues (epsilon amine) of antibodies under mildly basic conditions, followed by purification of the DFO-immunoconjugates using size-exclusion chromatography (SEC).12, 13 Alternative conjugation methods include the use of activated esters for the formation of amide bonds, maleimide conjugation to thiols, and site-specific modification of the biantennary hexasaccharide glycans on antibodies using chemoenzymatic approaches including copper-free click chemistry.14–20 Following DFO conjugation, antibodies are typically evaluated to determine the immunoreactive fraction (% of radioimmunoconjugate capable of binding to the target) using cell-based radioligand binding assays described by Lindmo et al.21, 22 The degree of chelator conjugation (average number of chelators per antibody) is typically assessed using a radiometric isotopic dilution assay,23–25 high-performance liquid chromatography (HPLC)-based UV/Vis absorption, or matrix-assisted laser desorption/ionization mass spectrometry (MALDI-TOF MS/MS).26–28 Radiolabeling experiments typically utilize ([89Zr]Zr4+) in the form of [89Zr]Zr-oxalate (~1.0 M oxalic acid), and radiochemical yields are determined via radio instant thin layer chromatography (iTLC) and/or SEC-HPLC. Finally, in vitro serum challenge assays are carried out to evaluate the stability of 89Zr-complexation.12, 19, 26, 29–31
Those engaged in the synthesis of antibody-based probes for 89Zr-immuno-PET will appreciate that reacting ~4–8 molar equivalents of p-SCN-Ph-DFO typically yields ~1–3 chelates per antibody whilst retaining upwards of 90% immunoreactive fractions for the resulting radioimmunoconjugates. However, using higher molar equivalents (>10–20) of the bifunctional chelator to an antibody can compromise its immunoreactive fraction owing to the non-site-specific nature of the reaction between the phenyl-isothiocyanate arm of the bifunctional chelator and lysine residues distributed throughout the structure of an antibody including the target/epitope-binding site. Am (molar activity) values of ~11–33 MBq/nmol; and As (specific activity) values of 2–6 mCi/mg (74–222 MBq/mg) are typically considered acceptable for cell-based assays and small animal imaging studies. The method prescribed by Vosjan et al., caters to the modification of 2–10 mg of antibody and radiolabeling of ~0.7–3.0 mg of DFO-conjugated antibody. However, other variants of this protocol have described DFO-conjugation of 0.5–2 mg of antibodies and radiolabeling of 0.010–2 mg of such DFO-immunoconjugates.13, 29 Here, we describe the radiolabeling of smaller quantities of antibody (down to 0.005 mg of DFO-trastuzumab), in addition to evaluating and optimizing many other parameters that are involved in the synthesis of radiolabeled antibodies for 89Zr-immuno-PET.
We opined that a comprehensive study investigating the many variables involved in the radiosynthesis of 89Zr-labeled antibodies for immuno-PET will be timely and informative. Therefore, we tested a number of pertinent variables including the degree of chelator conjugation per antibody, the radiolabeling buffer, the volume, the temperature, the reaction time, and the quantity (mass) of DFO-conjugated antibody used in a 89Zr-immuno-PET radiosynthesis reaction. We then evaluated the impact of these variables on radiochemical yields and molar activity. The immunoreactive fraction of the resulting radioimmunoconjugates was evaluated via traditional cell-binding assays whilst leveraging surface plasmon resonance (SPR) as an orthogonal method of analysis to determine the impact of DFO-conjugation on binding affinity and immunoreactivity. Finally, we evaluated the in vivo biodistribution and tumor-targeting ability of the resulting radioimmunoconjugates in a relevant xenograft model. Although this work focuses on trastuzumab as a model antibody and p-SCN-Ph-DFO as a model bifunctional chelator, the trends observed here should be largely applicable to conjugations and radiolabeling with other antibodies. Other popular chelators for different radiometals such as p-SCN-Ph-DOTA and p-SCN-Ph-CHX-A’’-DTPA will likely conjugate with different efficiencies due to differences in their polarity and structure. Once conjugated, these alternative chelators are used for radiolabeling with radiometals such as gallium-68, lutetium-177, and yttrium-90, which each possess different apparent molar activities and require different radiolabeling conditions than zirconium-89.
RESULTS AND DISCUSSION
Antibody Modification, Characterization and Immunoreactivity
Trastuzumab was chosen as a model antibody for this study since it is a well-studied antibody in the context of preclinical as well as clinical immuno-PET.30, 32–37 This study describes the synthesis of DFO-conjugated variants of trastuzumab produced by using different molar equivalents of the bifunctional chelator – p-SCN-Ph-DFO – followed by a systematic characterization and testing of a number of radiolabeling variables (Figs. 1A-B). The results described and discussed herein may be broadly applicable to other antibodies and chelators used for antibody-based molecular imaging and therapy – especially if the different antibodies bear the same number of chelators. However, each antibody may have different properties (e.g. stability, distribution of lysine residues and sensitivity to modification), and each chelator will have different polarity (e.g. p-SCN-Ph-DFO is more hydrophobic than p-SCN-Ph-DOTA or p-SCN-Ph-CHX-A’’-DTPA). This implies that reacting 5 molar equivalents of p-SCN-Ph-DFO to a different antibody may result in a different degree of conjugation (chelators/Ab), although for DFO the results present herein should be applicable to antibodies other than trastuzumab. Furthermore, a different bifunctional chelator may yield different chelator/Ab ratio, radiochemical yields, molar activity and immunoreactive fractions of the synthesized radioimmunoconjugate.
Figure 1. Bioconjugation and radiolabeling of antibodies for 89Zr-immuno-PET.

A) Schematic showing the conjugation of a bifunctional chelator (p-SCN-Ph-DFO) to trastuzumab, and synthesis of radiolabeled antibody [89Zr]Zr-DFO-trastuzumab for immuno-PET. B) Cartoon illustrating the syntheses of different trastuzumab-DFO-conjugates (T5, T10, T20, T60 and T200) by varying the molar equivalents (5, 10, 20, 60 and 200) of p-SCN-Ph-DFO. C) Analysis of the various trastuzumab-DFO conjugates using polyacrylamide gel electrophoresis (SDS-PAGE) showing changes in the migration of the antibody’s heavy chains (HC) and light chains (LC) attributed to changes (gain) in the molecular weight of these domains upon modification with the various molar equivalents of DFO.
Standard antibody modification techniques were used (see materials and methods). The various trastuzumab-DFO conjugates were dubbed T5, T10, T20, T60, and T200 (T = trastuzumab, numeric value = molar equivalents of p-SCN-Ph-DFO used for the bioconjugation reaction), but these numbers do not indicate the actual number of conjugated chelators. Gel electrophoresis of the trastuzumab-DFO conjugates under reducing conditions showed a distinct trend for the migration of the heavy and light chains of the antibody through the polyacrylamide gel (Figure 1C). Specifically, the heavy chains of the T5 variant showed a comparable migration profile as unmodified trastuzumab, however, there was a progressively increasing upward shift in the position of the antibody heavy chains for trastuzumab variants T10 through T200. The heavy chains of the T10 variant were positioned slightly above unmodified trastuzumab and the T5 variant. Furthermore, the heavy chains from the T60 and T200 variants trailed in their southward migration through the gel most likely due to the higher degree of DFO conjugated to these variants compared to the T5 counterpart. The heavy chains from the T20 variant showed a gel migration profile intermediate to that of the T5 and T60/T200 variants, which is reflected in the in vivo behavior of the T20 variant being between that of T5/T10 and T200 (vide infra). The lower half of the gel shows the migration and position of the antibody light chains and highlighted a similar pattern as the heavy chains. The migratory profile of the light chains suggested that the use of high molar equivalents of DFO (> 20 equiv.) was capable of modifying the light chains of the antibody as well. Of note, there are ~80 lysine residues in most immunoglobulin G (IgG) molecules, of which ~10 lysine residues may be assessible for chemical modifications. When performing non-regioselective amine-targeted conjugation using bifunctional chelators such as p-SCN-Ph-DFO, lysine residues on the heavy as well as light chains become amenable to this reaction. The presence of twice (8) as many heavy chain domains as there are light chain domains (4) ensures a high likelihood for most of the solvent accessible lysine residues of an IgG to be present within the heavy chain domains. However, mildly alkaline reaction conditions combined with the presence of a huge molar excess of p-SCN-Ph-DFO (or any other dye/chelator reactive to amines) can increase the likelihood for chemical modifications to occur on lysine residues in the light chain domains of IgGs as well. Critically, the chemical modification of lysine residues in the light chain domains can be problematic since 50% of an IgG’s light chains encompass the epitope-binding site of an antibody. Modifications of lysine residues within the epitope-binding region of an IgG can compromise the immunoreactivity and target-binding affinity of an antibody.
The average degree of DFO (chelator) conjugated to trastuzumab was determined via MALDI-TOF MS/MS mass spectrometry using unmodified trastuzumab as a reference. The chelator/Ab ratio in Table I represents the average number based on the molecular weight at the center of each mass peak, while the error was calculated from the difference between three different mass measurements (effectively error in measurement). Admittedly, this aspect highlights a potential drawback of using MALDI-TOF as a method of analysis as the variability in distribution of the number of chelators per antibody is higher than the ± 0.5–1.0 error values reported in Table I, and the number reported is the most abundant mass observed (center of peak). This distribution in mass can be seen by looking at the width of MALDI peaks (Supplemental Figs. S1–S6), showing a broadening of mass peaks going from T5 → T200 which corresponds with an increasing distribution of different molecular weights. Despite the lack of precision, MALDI-TOF analyses confirmed the expected trend of an increase in the molar equivalents of p–SCN-Ph-DFO used in the conjugation reaction yielding a higher degree of chelation and increased mass of the Ab. In sum, the results obtained from MALDI-TOF analysis were more reliable and reproducible than those obtained from traditional radiometric isotopic dilution assays. These can be improved further by use of a modern high-quality ESI-MS/MALDI-TOF MS/MS instrument. Notably, the maximum average number of DFOs conjugated per antibody was obtained in the case of the T60 and T200 variants – which yielded 10.9 ± 0.7 DFOs/Ab. Because the T60 and T200 samples were effectively identical, only T200 was used for all in vitro radiolabeling experiments, in vivo PET imaging, and biodistribution studies described in this study to avoid redundancy in data and reporting of outcomes. The immunoreactive fraction assessed using a cell-based radioligand binding assay using HER2 overexpressing SKOV3 cells yielded the results enumerated in Table I. There was no statistically significant difference in the immunoreactive fractions observed for DFO-conjugated trastuzumab variants radiolabeled at room temperature (~22 °C) versus 37 °C. However, in direct comparison to the T5 conjugate a ~10% decrease in immunoreactive fraction was observed for the T60 and T200 conjugates.
Table I.
Summary of DFO-trastuzumab immunoconjugate characterization used for all in vitro and in vivo radiochemical experiments (first conjugation batch), showing a trend for increasing average number of chelators per antibody (up to a maximum of ~11 in the case of T60 and T200 conjugates), and enumerating results from SKOV3 cell-based radioligand binding assays showing no statistically significant difference in immunoreactivity when radiolabeling was performed at ambient temperature – 22 °C vs. 37 °C.
| Trastuzumab Variants | Chelators/Antibody (MALDI, n = 3) | Radiolabeling temperature (°C) | Immunoreactivity (SKOV3 cell binding, n = 5) |
|---|---|---|---|
| T5 | 1.4 ± 0.5 | 22 | 90.8 ± 0.9% |
| T5 | 1.4 ± 0.5 | 37 | 92.9 ± 1.2% |
|
| |||
| T10 | 2.6 ± 0.6 | 22 | 90.2 ± 0.4% |
| T10 | 2.6 ± 0.6 | 37 | 90.8 ± 0.4% |
|
| |||
| T20 | 4.0 ± 1.0 | 22 | 87.7 ± 0.8% |
| T20 | 4.0 ± 1.0 | 37 | 92.1 ± 1.0% |
|
| |||
| T60 | 10.9 ± 0.7 | 22 | 81.1 ± 1.0% |
| T60 | 10.9 ± 0.7 | 37 | 79.3 ± 1.2% |
|
| |||
| T200 | 10.9 ± 0.8 | 22 | 81.5 ± 0.6% |
| T200 | 10.9 ± 0.8 | 37 | 79.1 ± 1.7% |
Surface Plasmon Resonance (SPR) Analysis
To more directly study the impact of DFO-conjugation on the immunoreactive fraction of trastuzumab, SPR was employed as an orthogonal method of analysis. The batches of DFO-trastuzumab used for all in vitro and in vivo radiolabeling studies and initial calibration and setup of SPR assays (e.g. Table I) was fully consumed. A fresh batch of the various immunoconjugates was prepared and used exclusively for SPR analyses. Whilst differing in the absolute number of DFOs per antibody (Table II), the trastuzumab-DFO conjugates used for SPR analyses showed a similar trend of increased chelator loading on the antibody when higher molar ratios of DFO were used in the conjugation reaction (Supplemental Figs. S8–S13). Notably, using >60 molar equivalents of DFO in the bioconjugation reaction consistently led to cloudiness in the reaction mixture of the T200 conjugate, ultimately yielding slightly lower DFOs conjugated to trastuzumab (Table II, Supplemental Figs S8–S13). The poor solubility of p–SCN-Ph-DFO is likely the cause for poor reproducibility of exact conjugation yields at high molar equivalents.
Table II:
Kinetic constants derived from SPR analysis of the interaction between unmodified trastuzumab (T0) and trastuzumab-DFO-immunoconjugate variants with recombinant HER2. Immunoconjugates (IC) were prepared as a second batch with different DFOs/Ab values, after consuming the first batch with radiochemical experiments (e.g. first batch used for Table I).
| ICs | DFOs/Ab | ka (1/Ms) | kd (1/s) | KD (M) |
|---|---|---|---|---|
| T0 | 0 | 1.9 × 10⁶ ± 3.0 ×10⁵ | 3.0 × 10⁻⁴ ± 5.0 ×10⁻⁵ | 1.6 × 10⁻¹⁰ ± 1.9 ×10⁻¹¹ |
| T5 | 1.3 | 1.1 × 10⁶ ± 1.8 ×10⁵ | 3.3 × 10⁻⁴ ± 7.3 ×10⁻⁵ | 2.9 × 10⁻¹⁰ ± 1.7 ×10⁻¹¹ |
| T10 | 1.5 | 7.6 × 10⁵ ± 1.2 ×10⁵ | 3.0 × 10⁻⁴ ± 6.9 ×10⁻⁵ | 3.9 × 10⁻¹⁰ ± 3.1 ×10⁻¹¹ |
| T20 | 2.5 | 6.7 × 10⁵ ± 1.1 ×10⁵ | 2.6 × 10⁻⁴ ± 5.9 ×10⁻⁵ | 3.9 × 10⁻¹⁰ ± 2.8 ×10⁻¹¹ |
| T60 | 6.7 | 3.0 × 10⁵ ± 3.5 ×10⁴ | 2.2 × 10⁻⁴ ± 4.3 ×10⁻⁵ | 7.4 × 10⁻¹⁰ ± 5.7 ×10⁻¹¹ |
| T200 | 5.8 | 3.7 × 10⁵ ± 5.0 ×10⁴ | 2.1 × 10⁻⁴ ± 3.8 ×10⁻⁵ | 5.7 × 10⁻¹⁰ ± 2.3 ×10⁻¹¹ |
All the trastuzumab-DFO variants synthesized for this study yielded sub-nanomolar binding affinities for recombinant purified HER2 as demonstrated by the kinetic analysis shown in Figure 2. However, there was a ~3.5- to 4.6-fold difference in the HER2-binding affinity (KD) for the T200 and T60 variants respectively (Figure 2G; new conjugation batch, Table II). Unlike T5, T10 and T20 which yielded robust binding and dissociation profiles between 0.195 nM – 25 nM as shown in the sensorgrams (Figure 2A-D), the T60 and T200 variants only showed binding to HER2 above 0.78 nM – indicative of a compromise in HER2-binding ability for these highly conjugated variants. On the other hand, the trastuzumab-DFO-variant with the least modification (T5) demonstrated saturation effects at 25 nM and displayed a near-identical sensorgram profile as unmodified trastuzumab (T0). Both T0 and T5 showed a plateauing effect at 25 nM – suggesting a minimal drift in HER2-binding ability of the T5 variant. Critically, an increase in the chelator/Ab ratio from T5 → T200 appeared to impact the on-rate of trastuzumab for HER2 (Figure 2H and Table II). Trastuzumab-DFO variants with a higher chelator/Ab ratio (T60 and T200) had the slowest on-rates whereas unmodified trastuzumab had the fastest on-rate followed closely by T5, T10 and T20 variants with minor statistically non-significant differences. Once bound to HER2 on the chip, all the trastuzumab-DFO variants displayed broadly similar off-rates (dissociation kinetics) as seen in the sensorgrams shown in Figs. 2A-F and the bar graph shown in Figure 2I. A relatively better binding affinity (KD) and faster on-rate (ka) of the T200 vs the T60 variant in SPR analyses might be attributed to the slightly lower number of DFOs conjugated per antibody in this immunoconjugate. The DFOs/Ab achieved for this second batch of conjugations (Table II) yielded lower numbers than the first batch (Table I).
Figure 2. Comparative SPR kinetic analysis of trastuzumab-DFO-conjugates binding to HER2.
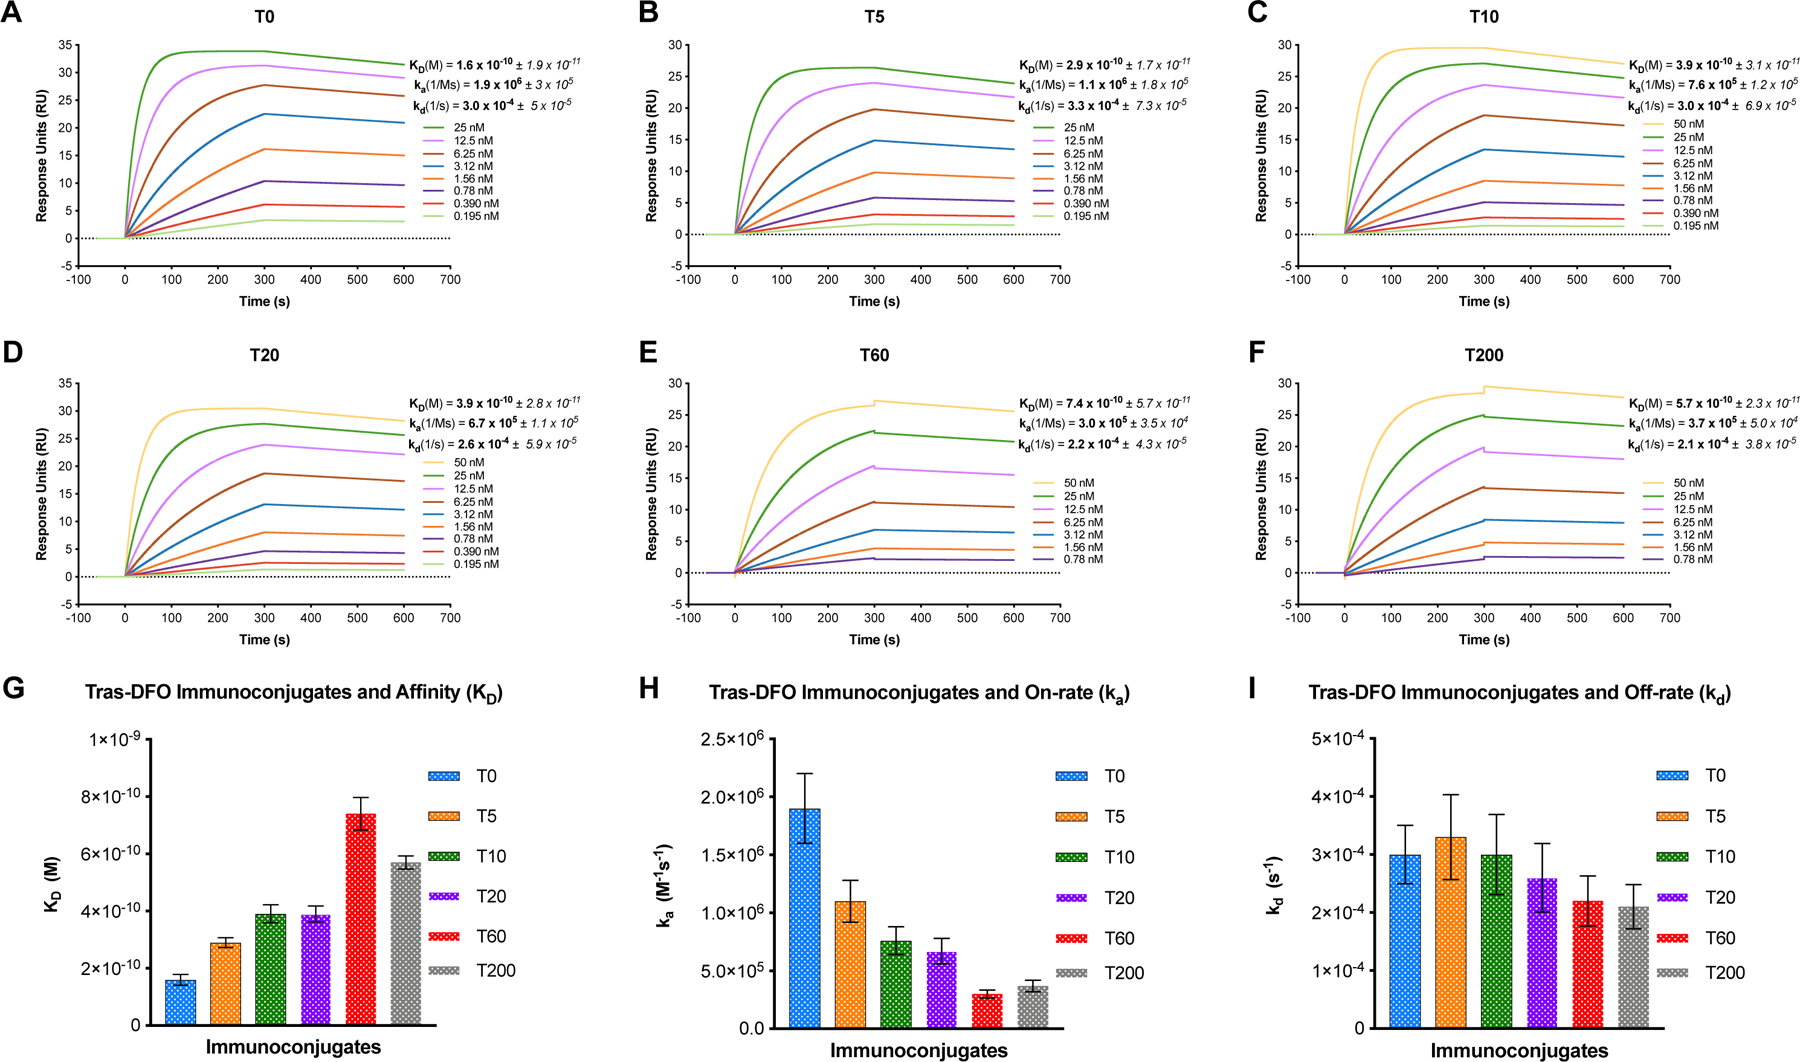
Sensorgrams showing dose-response curves and kinetic profiles for the binding of DFO-conjugated variants including A) unmodified trastuzumab-T0; B) T5; C) T10; D) T20; E) T60; and F) T200. The binding affinity (KD), and kinetic rate constants – on-rate (ka) and off-rate (kd) for each immunoconjugate are mentioned alongside the corresponding representative sensorgram plots; G) Bar graph showing the inverse relationship between an increase in the degree of chelator/Ab ratio and progressively diminishing binding affinity from T0-T200; H) Bar graph showing the maximum impact on binding affinity caused by depreciating on-rates for the trastuzumab-DFO variants with higher degree of chelator conjugation; I) Bar graph representing the comparable dissociation kinetics for all the trastuzumab-DFO variants examined.
To quantify the functionally active concentration of the antibody in each of the synthesized trastuzumab-DFO conjugates, a calibration-free concentration analysis (CFCA) was carried out on a Biacore T200 instrument. CFCA is an SPR assay that determines the active concentration of an analyte (in this case – unmodified trastuzumab and the trastuzumab-DFO variants) for binding to a high-density surface of the cognate ligand (in this case – histidine tagged HER2) without the need for a calibration curve. The high-density ligand surface facilitates mass-transport limitation and 1:1 binding to play out in the assay. The active concentration of the analyte is calculated from the slope of the curves obtained by flowing two distinct concentrations of the analyte over the high-density ligand surface at two different flow rates. To this end, a 200 nM stock of unmodified trastuzumab and each of the trastuzumab-DFO conjugates was prepared and two 10-fold serial dilutions were made to prepare 20 nM and 2 nM samples for use in the CFCA. Figure 3A-E shows curves from the CFCA for each of the trastuzumab-DFO conjugates – T5 in orange; T10 in green; T20 in purple; T60 in red; and T200 in gray – compared directly with unmodified trastuzumab (T0) shown in light blue. Interestingly, even the unmodified trastuzumab (T0) stock sample which measured 200 nM by UV-Vis spectrometry yielded an active concentration of 140 nM (Figure 3F) – suggesting only 70% HER2-reactive IgG in the parent compound used for DFO-conjugation. Some of this discrepancy may be attributed to – a) limitations of determining protein concentrations by UV-Vis spectrophotometry; b) unintended damage/loss of HER2-active IgG during buffer exchanges (PD10 SEC + spin filtration) performed prior to DFO-conjugation to remove formulation excipients such as histidine, arginine, and protein-stabilizing emulsifiers in the original trastuzumab vial obtained from the clinical pharmacy; and c) arguably CFCA being a more accurate method of analysis to determine active protein concentration. By that token, T5 yielded an active concentration of 130 nM, T10 had 120 nM, T20 showed 100 nM, whereas T60 and T200 yielded 71 and 89 nM respectively. The relatively higher HER2-active concentration of T200 than T60 may be attributed to lesser DFO conjugated to the antibody in the T200 variant in this second batch of immunoconjugates, plausibly due to inefficient bioconjugation (cloudiness/precipitation in the reaction mixture from using 200 molar equivalents of DFO).
Figure 3. CFCA analysis to determine active antibody concentration in the various trastuzumab-DFO-conjugates.

CFCA plots showing a direct comparison of the binding curves obtained from flowing 20 nM and 2 nM of unmodified trastuzumab (T0) shown in light blue at flow rates of 100 μL/min and 5μL/min versus T5 (orange) in A); T10 (green) in B); T20 (purple) in C); T60 (red) in D); T200 (gray) in E). The active concentration of trastuzumab was calculated from the region of the slope on the CFCA plots demarcated by the dashed vertical lines. F) CFCA trend plot revealing diminishing concentrations of HER2-reactive antibody in trastuzumab-DFO-conjugates with progressively increasing chelator/Ab ratios.
Collectively, the findings from SPR kinetic analysis and CFCA suggested that increasing the number of DFO chelates to trastuzumab may after all be deleterious to its ability for binding to HER2. This is contrary to cell-based immunoreactivity assays which showed little difference between these conjugates, suggesting SPR CFCA analysis is more predictive of in vivo behavior. Further, SPR analysis was able to lend a more quantitative assessment and deeper insight to evaluate the impact of DFO-conjugation on the binding affinity and immunoreactive fraction of the antibody. This is highlighted by the kinetic analysis revealing the impact of DFO-conjugation on the on-rate of trastuzumab binding to HER2, and CFCA findings indicating only 50–60% immunoreactive fraction in the T60 and T200 variant preps versus >90% immunoreactive compound for the T5 variant. The discrepancy between the immunoreactivity results obtained from cell-based radioligand binding assays and SPR may be attributed to a higher sensitivity of SPR versus cell-based assays and the stringent requirement for removal of particulate aggregates from the DFO-conjugate preps by high-speed centrifugation prior to use in the SPR assay. On the other hand, PD10-based SEC and centrifugal filtration to purify 89Zr-labeled antibodies prior to use in cell-based assays do not necessarily separate higher molecular weight aggregates of the radioimmunoconjuagtes – which may yield erroneous results in downstream cell-based assays. Although manual PD10-SEC was performed for all samples multiple times, SEC-HPLC should be performed in the future for similar experiments to ensure that no aggregates are present.
Zirconium-89 Radiolabeling – Effect of Duration and Temperature of Reaction
The next question we asked was what effect do reaction time (duration) and temperature have when radiolabeling DFO-conjugated antibodies? It’s important to note that inter-lab variability for producing and purifying zirconium-89 (e.g. apparent molar activity, metal-ion contaminants, concentration), and even inter-batch variability at one institution can cause fluctuations in RCYs when radiolabeling at the extreme end of high specific activity. To start, we aimed to achieve at least the standard radiochemical yields that are typically required for in vitro and in vivo assays (~3–5 mCi/mg; ~111–185 MBq/mg; ~17–28 MBq/nmol). Keeping the following reaction conditions constant – i.e., 50 μg antibody in 300 μL of chelexed-PBS (pH 7.4) and using ~200 μCi of [89Zr]Zr4+, we assessed radiochemical yields at 15 min, 30 min, and 60 min at ambient temperature (~22 °C) and 37 °C (n = 3 each) using radio-iTLC (iTLC-SG strips; Varian). The results enumerated in Table III and Figure 4 demonstrate excellent radiochemical yields (RCY) obtained at all measured time points for all the trastuzumab-DFO variants at both temperatures. The only measured RCY < 90% was for the T5 conjugate at ambient temperature and 15 min. However, allowing the T5 conjugate to react for a total of 30 min at ambient temperature increased the RCY to 96.4 ± 1.9 %, and up to 98.4 ± 0.1 % at 60 min. These results demonstrate that radiolabeling the DFO-conjugates bearing even 1–2 DFOs/Ab with [89Zr]Zr4+ at ambient temperature for 60 min can yield near-quantitative RCY, whilst the same result can be achieved in 15 min if the radiolabeling reaction is performed at 37 °C.
Table III.
Effects of reaction time and temperature on radiochemical yields and As using constant reaction conditions: 50 μg DFO-trastuzumab immunocojugates (T5, T10, T10, T200), 300 μL chelexed-PBS (pH 7.4), ~200 μCi [89Zr]Zr; variable reaction conditions: time (15, 30, 60 min) and temperature (22°C and 37 °C); RCY was measured using radio-iTLC.
| Equiv. DFO | RCY % 22°C - 15 min |
RCY % 22°C - 30 min |
RCY % 22°C - 60 min |
Specific Activity at 60 min (mCi/mg) |
Specific Activity at 60 min (MBq/mg) |
Average chelates/ antibody (MALDI) |
|---|---|---|---|---|---|---|
| T5 | 81.0 ± 2.1 | 96.4 ± 1.9 | 98.4 ± 0.1 | 4.0 ± 0.3 | 148 ± 11 | 1.4 ± 0.5 |
| T10 | 93.8 ± 2.4 | 98.7 ± 0.4 | 99.3 ± 0.2 | 3.6 ± 0.7 | 133 ± 26 | 2.6 ± 0.6 |
| T20 | 98.4 ± 0.9 | 99.2 ± 0.2 | 99.5 ± 0.2 | 4.0 ± 0.4 | 148 ± 15 | 4.0 ± 1.0 |
| T200 | 99.6 ± 0.1 | 99.6 ± 0.2 | 99.5 ± 0.1 | 3.8 ± 0.1 | 141 ± 4 | 10.9 ± 0.7 |
|
| ||||||
| Equiv. DFO |
RCY %
37°C - 15 min |
RCY %
37°C - 30 min |
RCY %
37°C - 60 min |
Specific Activity
at 60 min (mCi/mg) |
Specific Activity
at 60 min (MBq/mg) |
Average chelates/ antibody (MALDI) |
|
| ||||||
| T5 | 97.9 ± 1.4 | 98.9 ± 0.3 | 98.2 ± 0.8 | 3.6 ± 0.1 | 133 ± 11 | 1.4 ± 0.5 |
| T10 | 99.3 ± 0.2 | 99.2 ± 0.2 | 99.3 ± 0.1 | 3.5 ± 0.2 | 130 ± 26 | 2.6 ± 0.6 |
| T20 | 99.4 ± 0.3 | 99.5 ± 0.2 | 99.5 ± 0.2 | 3.6 ± 0.2 | 133 ± 15 | 4.0 ± 1.0 |
| T200 | 99.6 ± 0.1 | 99.6 ± 0.1 | 99.7 ± 0.1 | 4.0 ± 0.1 | 148 ± 4 | 10.9 ± 0.7 |
Figure 4. Summary of radiolabeling studies including.

A) the effect of the number of chelates per Ab on radiochemical yields at various masses (5, 25, 50 μg, n = 3 each; ~300 μL chelex treated PBS buffer, reaction performed at 37°C) showing quantitative radiolabeling yields for 50 and 25 μg of immunoconjugate used; B) the effect of buffer volume on As at constant mass of Ab (5 μg, n = 3 each), with more concentrated radiolabeling conditions providing higher As; C) the effect of number of chelators/Ab on the polarity (partition coefficient between octanol and PBS pH 7.4, n = 5, logD) of 89Zr-labeled immunoconjugates, showing decreasing polarity with increasing number of DFOs/Ab (* indicates p-value = ≤ 0.05, ** = ≤ 0.01, *** = ≤ 0.001.); and D) the effect of buffer on As at constant volume (~300 μL) and Ab mass (5 μg), showing no clear trend but chelexed-PBS generally conferring optimal results.
Zirconium-89 Radiolabeling – Effect of Mass of Antibody, Reaction Volume, Immunoconjugate lipophilicity and Buffer Composition on Radiochemical Yield and Specific Activity.
As the RCYs were very high under all conditions with 50 μg of each trastuzumab-DFO-conjugate, the experiments were repeated keeping all other reaction conditions constant (300 μL of chelexed-PBS pH 7.4, ~200 μCi of [89Zr]Zr4+, 37°C) except the mass (quantity) of antibody. In separate reactions, 25 μg and 5 μg each of the T5, T10, T20, and T200 variants were used (from first conjugation batch, Table I). The results from these experiments are summarized in Table III and Figure 4. Panel A in Figure 4 shows the difference in RCY obtained with T5, T10, T20, and T200 after 60 min (300 μL chelex treated PBS). Only the 5 μg reaction showed non-quantitative RCYs. Thus, 5 μg was chosen as the mass of antibody to perform additional radiolabeling studies whilst changing other variables as this mass of antibody would allow for differences in RCY and As to be quantified under different conditions unlike 25 and 50 μg, which showed quantitative RCY and therefore no differences. Panels A (Figure 4) shows a trend for increasing RCY and As with increasing number of chelates/Ab for the 5 μg series yielding As (Am) values of 17.5 ± 2.2 mCi/mg (648 ± 81 MBq/mg; ~97 MBq/nmol) for T5, 27.2 ± 1.5 mCi/mg (1006 ± 56 MBq/mg; ~151 MBq/nmol) for T10, 32.0 ± 0.2 mCi/mg (1184 ± 7 MBq/mg; ~178 MBq/nmol) for T20, and 35.5 ± 1.6 mCi/mg (1313 ± 59 MBq/mg, ~197 MBq/nmol) for T200. Of note, these reported maximum As (Am) values were calculated based on the mass of radiolabeled Ab (5 μg), the amount of [89Zr]Zr4+ added to the reaction (~200 μCi), and the RCY as measured by radio-iTLC. These values were not isolated RCY of the radioimmunoconjugates post-purification by PD10 SEC/spin filtration. In sum, this experiment demonstrates that increasing the degree of DFO conjugation from the typical 1–2 DFOs/Ab up to the theoretical maximum of ~10 (equivalent to the number of solvent accessible lysine residues present on most IgGs) can yield 89Zr-labeled antibodies with higher As (Am) values than the typical ~2–8 mCi/mg (~74–296 MBq/mg, ~11– 44 MBq/nmol). We were able to achieve [89Zr]Zr-DFO-trastuzumab with As (Am) values as high as 35.5 ± 1.6 mCi/mg (1313 ± 59 MBq/mg, ~197 MBq/nmol). Furthermore, the same immunoconjugates were radiolabeled in buffer volumes of 0.1 mL and 1.0 mL for 60 min at 37°C (chelexed-PBS pH 7.4, ~200 μCi of [89Zr]Zr4+) to determine the effect of concentration on RCY and As (Am). The results shown in Panel B (Figure 4) demonstrate that using the same mass (quantity) of trastuzumab-DFO-conjugate and the same amount of activity (~200 μCi [89Zr]Zr4+) under the same reaction conditions yielded higher As (Am) when lower radiolabeling buffer volumes were used. These results suggest the use of lowest possible reaction volumes or higher concentration of immunoconjugate in order to maximize RCY and As (Am).
Since DFO is a hydrophobic chelator, we evaluated its impact on the lipophilicity of the antibody. To this end, we evaluated the polarity of the various trastuzumab-DFO-conjugates using standard shake-flask octanol/buffer partitioning. Panel C (Figure 4) shows the changes in polarity of the various 89Zr-labeled trastuzumab immunoconjugates as measured by logD (octanol/PBSpH-7.4 partition coefficients), demonstrating a statistically significant decrease in polarity between T5 and the rest of the radioimmunoconjugate variants bearing relatively higher number of DFOs/Ab. These logD values do not appear to predict in vivo behavior, as T10/T20/T200 have similar logD values but different in vivo biodistribution profiles and SPR results. Finally, radiolabeling was attempted with different buffers to determine if one of the commonly used buffers was better for the purpose radiolabeling antibodies with [89Zr]Zr4+. For this experiment, 5 μg of each of the DFO-conjugates was radiolabeled (~200 μCi of [89Zr]Zr4+, 60 min, 37°C) with ~300 μL of PBS (not chelexed, pH 7.4), PBS treated with chelex resin (pH 7.4), HEPES buffer (chelex-treated, pH 7.4, 500 mM), and TRIS/HCl buffer (chelex-treated, pH 7.4, 10 mM). Most results in this experiment were not statistically significant, but there was a clear and consistent trend suggesting chelexed-PBS as the most suitable buffer of choice for 89Zr-radiolabeling reactions in our hands. A firm statement on which buffer is best is not possible from these results alone, and inter-lab variability may yield different results and preferences, but treatment of buffers with chelex resin is recommended. The buffer HEPES is perhaps the most popular choice for zirconium-89 radiolabeling as it is superior to PBS in buffering capability and does not natively contain chloride ions (unless pH adjusted using HCl). It has been suggested that chloride ions in buffers such as PBS and saline are responsible for the formation of destructive hypochlorite ions via radiolysis.38
Zirconium-89 Radiolabeling – Effect of Radiolysis.
Next, we attempted to determine the degree of radiolysis of 89Zr-labeled trastuzumab immunoconjugates in the following buffers – PBS, saline, TRIS/HCl, HEPES, and PBS with radio-protectants ascorbic acid or gentisic acid. The T10 immunoconjugate was used in this experiment as a representative sample assuming that the number of chelates/Ab is not expected to affect radiolysis. After performing the radiolabeling in chelexed-PBS, aliquots of [89Zr]Zr-T10 were buffer-exchanged using Amicon spin filters (50 kDa MWCO) with saline, TRIS/HCl, HEPES, PBS + ascorbic acid (~1 mg/mL), or PBS + gentisic acid (~1 mg/mL). Buffer-exchanged [89Zr]Zr-T10 was made up to a total volume of ~100 μL in microcentrifuge tubes and allowed to sit at ambient temperature (22 °C) for 48 h prior to testing the immunoreactive fraction via cell-based radioligand binding assay using HER2-expressing SKOV3 cells. Only a single microcentrifuge tube of each different [89Zr]Zr-T10 buffer mixture was prepared and immunoreactive fraction for each mixture was measured (n = 4). Immunoreactivity of [89Zr]Zr-T10 immediately following radiolabeling in PBS was determined to be ~90%. Critically, the error values reported in Table IV are the error in measurement of n = 4 immunoreactivity assays for each mixture (error in assay), but each [89Zr]Zr-T10 buffer mixture was only a single preparation (n = 1). No obvious trend was observed for this experiment, and more replicates would be needed to make any firm statements; however, PBS + ascorbic acid yielded the highest immunoreactive fraction – 87.0 ± 0.9% with PBS + gentisic acid yielding only 63.6 ± 1.6 %, suggesting that PBS + ascorbic acid conferred better radioprotection. Of note, adding ascorbic acid into the radiolabeling mixture caused a substantial drop in RCY, plausibly due to the interaction of the oxygen-rich ascorbic acid with the oxophilic [89Zr]Zr4+, thus compromising the ability of DFO for radiometal chelation. Gentisic acid is said to be more compatible with zirconium-89 and hinder RCYs less than ascorbic acid. This suggests that despite being a good radioprotectant for [89Zr]Zr experiments, ascorbic acid should be added after radiolabeling is complete and during buffer exchange and purification of the radioimmunoconjugate product. More recently, Wadas et al., published a report showing prolonged radio-stability of 89Zr-labeled antibodies conferred from the use of 0.5 mg/ml N-acetyl-L-cysteine in 0.25 M sodium acetate buffer.39 Another flaw of this experiment is that radiolysis is not typically observed until large quantities of radioactivity are present (e.g. > 5 mCi/185 MBq), and therefore the quantities used here weren’t high enough to properly assess radiolysis effects.
Table IV.
Evaluation of radiolysis using T10 (50 μg, 0.1 mL, 37°C, 60 min, purified with PD10 SEC followed by 50 kDa Amicon spin filter). Purified [89Zr]Zr-T10 was buffer exchanged using spin filters, transferred to microcentrifuge tubes at ~100 μL buffer, and left to sit at ambient temperature for 48 h before the immunoreactive fraction (IRF) was determined using SKOV3 cells in radioligand binding assays.
| Buffer | IRF (%) |
Activity (μCi) |
Volume (μL) |
Concentration (μCi/μL) |
|---|---|---|---|---|
| PBS (~1 h post labeling, control) | 90.8 ± 0.4% | n/a | n/a | n/a |
|
| ||||
| PBS | 64.9 ± 0.9 | 387 | 100 | 3.9 |
| Saline | 81.2 ± 0.8 | 246 | 100 | 2.5 |
| TRIS/HCl | 61.9 ± 0.6 | 250 | 100 | 2.5 |
| HEPES | 73.1 ± 1.1 | 315 | 100 | 3.2 |
| PBS + Ascorbic Acid | 87.0 ± 0.9 | 407 | 100 | 4.1 |
| PBS + Gentisic Acid | 63.6 ± 1.6 | 493 | 100 | 4.9 |
PET Imaging and Biodistribution.
Ultimately, to confirm if a correlation between in vitro analysis and in vivo tumor-targeting performance could be made, all the trastuzumab-DFO variants (first conjugation batch, Table I) were radiolabeled and injected into female nude mice bearing subcutaneous SKOV3 tumors. As is typical for a full-length Ab radiotracer, the tumor uptake of activity increased from 24–120 h post-injection (p.i.), whilst activity concentrations in the blood pool gradually decreased, reaching maximum tumor uptake at 120 p.i (Figure 5). Surprisingly, the in vivo profile of [89Zr]Zr-T200 was profoundly different from [89Zr]Zr-T5, [89Zr]Zr-T10, and [89Zr]Zr-T20, with significantly lower tumor uptake and remarkably high liver uptake as early as 24 h p.i. Despite showing a difference of only ~10% for the immunoreactive fraction between [89Zr]Zr-T5 and [89Zr]Zr-T200 as determined by in vitro cell-based radioligand binding assays, the in vivo tumor-targeting and PET imaging performance was drastically different for these two radioimmunoconjugate variants of trastuzumab in the same animal model. Despite the T200 modification having a seemingly high immunoreactive fraction via cell-based assay (~80%; Table I) and a comparable binding affinity (KD) to other conjugates via SPR (Table II), detailed SPR analysis revealed a decrease in HER2 binding kinetics (Figure 2). Furthermore, CFCA evaluation revealed a substantial drop in immunoreactive fraction to 50–60 % (>90% for T5) (Figure 3). It is also possible that the increased hydrophobicity (logD measurement; Figure 4D) of T200 may have promoted the formation of higher molecular weight aggregates, which could result in higher uptake of activity in organs of the reticuloendothelial system (e.g. liver, spleen) as early as 24 h p.i. This is perhaps unlikely, as the logD values of the T10 and T20 conjugates were very similar to T200 but did not show the same drop in tumor uptake and concomitant increase in liver uptake. Visual inspection of the PET images (Figure 5) shows lower tumor uptake and higher liver/background uptake of the T20 immunoconjugate when compared with T5 and T10, but far superior to T200.
Figure 5. PET images delineating the in vivo profile of 89Zr-labeled DFO-trastuzumab variants in a SKOV3 xenograft model.

A) Coronal 2D slices from PET images of [89Zr]Zr-DFO-trastuzumab variants (~190 μCi, ~7 MBq, ~40 μg per mouse) in mice bearing subcutaneous SKOV3 xenografts; B) Corresponding maximum intensity projection (MIP) of PET images shown in A. Progressive washout from systemic circulation and a concomitant increase in activity concentration of targeted antibody-based tracer uptake in the tumor (yellow arrows) on left shoulder of mice injected with [89Zr]Zr-T5, [89Zr]Zr-T10 and [89Zr]Zr-T20. PET images of [89Zr]Zr-T200 showed dramatically low activity concentration in the tumor (yellow arrow) but heightened liver uptake (white arrow) as early as 24 h p.i. Increasing the DFO chelator conjugation ratio from 5–200 molar equivalents yielded 1–11 chelates/Ab, which appears to impact the in vivo tumor-targeting ability of trastuzumab.
Mice were euthanized immediately following PET imaging at 120 h p.i. and ex vivo biodistribution analysis was performed to obtain quantitative organ distribution data. The data for key organs at 120 h p.i. is displayed in Figure 6 with data from all collected organs presented in the supporting information (Supplementary Figure S7, Table SI). Collectively, the PET imaging and biodistribution data revealed statistically significant differences in tumor uptake between [89Zr]Zr-T5 (38.6 ± 3.8 %ID/g), [89Zr]Zr-T10 (42.9 ± 5.1%ID/g), [89Zr]Zr-T20 (34.9 ± 8.9 %ID/g), and [89Zr]Zr-T200 (16.2 ± 3.2 %ID/g). On the other hand, liver uptake values were determined to be 6.3 ± 1.8 %ID/g for [89Zr]Zr-T5, 4.6 ± 0.7 %ID/g for [89Zr]Zr-T10, 6.1 ± 3.4 %ID/g for [89Zr]Zr-T20, and 16.3 ± 6.2 %ID/g for [89Zr]Zr-T200. Although the PET images of T20 look inferior to T5 and T10 (Figure 5) and the biodistribution values for tumor and liver uptake were trending away from T5 and T10, unlike the T200 results the tumor and liver uptake values for T20 were not statistically significantly different from those of T5 and T10 (Figure 6)
Figure 6.

Comparative analysis showing ex vivo biodistribution data from mice used for PET imaging. Data from all collected organs presented in the supporting information (Supplementary Figure S7, Table SI). Statistical significance was assessed for tumor and liver activity concentrations for [89Zr]Zr-T5, [89Zr]Zr-T10 and [89Zr]Zr-T20 in comparison to [89Zr]Zr-T200; p-values * = ≤ 0.05, ** = ≤ 0.01, *** = ≤ 0.001. The bottom panel illustrates misdirected in vivo distribution of trastuzumab radioimmunoconjugates highlighted by the trend for decreased on-target (tumor) and increased off-target (liver) activity concentrations for the radioimmunoconjugates bearing higher number of DFOs/Ab – [89Zr]Zr-T20 and [89Zr]Zr-T200. The heightened liver uptake may also be related to a trend for decreasing logD (octanol/PBS partition coefficients) for the various trastuzumab-DFO conjugates (blue dashed lines).
CONCLUSIONS
Results from all the experiments undertaken in this study are summarized in Table V. Collectively, the work at hand reveals a direct relationship between the degree of chelator conjugation per Ab, radiochemical yields, As (Am), and an inverse correlation between the number of chelators per Ab and the active concentration, binding kinetics, and in vivo tumor targeting. Cell-based immunoreactive fraction assays and SPR binding affinity assays did not predict the poor in vivo performance of the most extreme T200 conjugate. However, SPR-based CFCA assays yielded active concentration values, which best predicted the in vivo trends of the various radioimmunoconjugates. Our findings suggest that whilst As (Am) can be increased by changing the degree of DFO conjugation from the standard 1–2 chelators/Ab to the theoretical maximum of ~10 chelators/Ab achievable via lysine conjugation, it clearly comes with compromised in vivo performance of the resulting radioimmunoconjugate. When more than ~3 chelators/Ab were conjugated, modification of the antibody light chains was observed by SDS-PAGE, active concentrations (immunoreactive fraction) decreased, and in vivo performance decreased. Although the polarity of the [89Zr]Zr-trastuzumab conjugates decreased with increasing DFOs/Ab as determined by logD values, these did not appear to predict in vivo behavior. Generally speaking, radiochemical yields can be maximized by using a minimum buffer volume (<300 uL), Chelex-treated PBS or HEPEs (pH 7.4), and avoiding ascorbic acid (radioprotectant) during radiolabeling reactions. We realize that clinical immuno-PET for imaging most oncologic targets utilizes [89Zr]Zr-Ab tracers with fairly low As. However, immuno-PET imaging of low abundance oncologic targets or endogenous immunologic markers may require the use of antibody-based tracers with high As. For the latter, we contend that a high degree of non-site-specific conjugation of DFO to lysine residues may not be ideal, and alternative strategies such as site-specific conjugation and dendrimer-/polymer-based multi-chelate platforms should be adopted.
Table V.
Summary of radiolabeling, in vitro, and in vivo results, revealing that conjugating 5–10 equivalents of p-SCN-Ph-DFO to trastuzumab conferred ~1–3 chelates/Ab and yielded radioimmunoconjugates that retained high immunoreactive fractions, good binding affinity, and resulted in high tumor uptake. Conversely, a high degree of chelator conjugation yielded radioimmunoconjugates with compromised binding affinity and sub-optimal in vivo performance.
| DFO Equiv. | Chelates/Ab (MALDI) | % IRF (Cell-based) |
nM Binding Affinity (SPR) | % Active Conc. (CFCA/SPR) | Max. Specific Activity (mCi/mg) | Tumor Uptake (%ID/g) | Liver Uptake (%ID/g) |
|---|---|---|---|---|---|---|---|
| 5 | 1.4 ± 0.5 | 92.9 ± 1.2 | 0.29 | 92.8 | 17.5 ± 2.2 | 38.7 ± 3.8 | 6.3 ± 1.8 |
| 10 | 2.6 ± 0.6 | 90.8 ± 0.5 | 0.39 | 85.7 | 27.2 ± 1.5 | 42.9 ± 5.1 | 4.6 ± 0.7 |
| 20 | 4.0 ± 1.0 | 92.1 ± 1.0 | 0.39 | 71.4 | 32.0 ± 0.2 | 34.9 ± 8.9 | 6.1 ± 3.4 |
| 60/200 | 10.9 ± 0.7 | 82.4 ± 1.7 | 0.74/0.57 | 56.4/63.5 | 33.7 ± 0.6 | 16.2 ± 3.2 | 27.6 ± 4.1 |
MATERIALS AND METHODS
Reagents and Instrumentation.
Unless indicated otherwise, all solvents and reagents were purchased from commercial suppliers (Sigma Aldrich; Fisher Scientific) and were used as received. DMSO used for chelator stock solutions was of molecular biology grade (>99.9%: Sigma, D8418). The bifunctional chelator 1-(4-isothiocyanatophenyl)-3-[6,17-dihydroxy-7,10,18,21-tetraoxo-27-(N-acetylhydroxylamino)-6,11,17,22-tetraazaheptaeicosine] thiourea (p-SCN-Ph-DFO) was purchased from Macrocyclics, Inc. UV-Vis measurements for determining antibody stock solution concentrations were taken on a Thermo Scientific Nanodrop 2000 spectrophotometer or a Shimadzu Biospec nano microvolume spectrophotometer, using the full-sized antibody (150 kDa) molar extinction coefficient of 210,000 L mol-1. [89Zr]Zr was produced at Memorial Sloan Kettering Cancer Center using an EBCO TR19/9 variable-beam energy cyclotron (Ebco Industries Inc.) via the 89Y(p,n) 89Zr reaction. [89Zr]Zr was purified in accordance with previously reported methods to create [89Zr]Zr with a specific activity of 5.3 – 13.4 mCi/μg (195 – 497 MBq/μg). Radioimmunoconjugate syntheses reactions were monitored using silica-gel impregnated glass-microfiber instant thin layer chromatography paper (iTLC-SG, iTLC-SA, Varian) and analyzed on a Bioscan AR-2000 radio-TLC plate reader using Winscan Radio-TLC software (Bioscan Inc.). All radiolabeling chemistry was performed with ultrapure milli-Q water (>18.2 MΩ cm−1 at 25 °C, Milli-Q) and as indicated some were treated for 24 h with mild stirring with 1.2 g/L Chelex-100 resin (BioRad Laboratories). Radioactivity in the samples was measured using a Capintec CRC-15R dose calibrator (Capintec). For ex vivo biodistribution studies, an automated Wizard II Gamma Counter (Perkin-Elmer) was used for counting radioactivity in organ samples and creating calibration curves for [89Zr]Zr. All animal experiments were performed under a Memorial Sloan Kettering Institutional Animal Care and Use Committee-approved (IACUC) protocol, and the experiments followed institutional guidelines for the proper and humane use of animals in research.
Antibody Modification.
Trastuzumab (purchased commercially as Herceptin; Genentech, San Francisco, CA) was purified using SEC columns (PD10, Sephadex G-25 M, PD10 column, GE Healthcare, PBS pH 7.4, 3 times), followed by centrifugal filter units with a 50,000 molecular weight cut off (Amicon® ultra centrifuge filters, Ultracel®−50: regenerated cellulose, Millipore Corp., Billerica, MA) (PBS, pH 7.4) to remove α-α-trehalose dihydrate, L-histidine, and polysorbate 20 additives. After purification, the antibody was dissolved in PBS pH 7.4 and kept in the fridge at 4 °C as a stock solution for no longer than a month. Subsequently, aliquots of antibody stock solution (3.0 mg antibody) were combined with PBS (up to 1000 μL total, pH 7.4) in microcentrifuge tubes, the pH of the resulting solution was adjusted to 8.8–9.0 with 0.1 M Na2CO3 (~30 μL), and varying quantities (5, 10, 20, 60, 200 molar equivalents) of p-SCN-Ph-DFO (in DMSO stock solution, ~15–20 mg/mL, Macrocyclics, Inc. Dallas, TX) was added in 10–50 μL DMSO (maximum 5% DMSO in final mixture). For brevity, these immunoconjugates were dubbed T5, T10, T20, T60, and T200 (T = trastuzumab, numeric value = molar equivalents of p-SCN-Ph-DFO conjugated), but these numbers do not indicate the actual number of conjugated chelators. The antibody and DFO mixture was allowed to react for 1 h, at 37 ºC in a thermomixer agitated at 500 rpm, and was then purified by SEC (PD10) followed by spin filtration (Amicon 50 kDa), followed by another round of SEC and spin filtration. Following modification and purification, gel electrophoresis was performed to confirm antibody modification and approximate location (heavy chain vs. light chain) of chelator conjugation. The final immunoconjugate stock solutions were stored in PBS (pH 7.4) at 4 °C for up to one month.
MALDI-TOF MS/MS Analysis to Determine the Number of Chelates per Antibody.
The number of benzylthiourea-linked desferrioxamine (DFO) chelates conjugated to trastuzumab was determined using MALDI-TOF MS/MS (Alberta Proteomics and Mass Spectrometry Facility, University of Alberta, Canada). All experiments were performed in triplicate, and all samples were run along with standard samples of unmodified trastuzumab (run on the same day). 1 μL of each sample (1 mg/mL) was mixed with 1 μL of sinapic acid (10 mg/ml in 50% acetonitrile:water and 0.1% trifluoroacetic acid). 1 μL of the sample/ matrix solution was then spotted onto a stainless steel target plate and allowed to air dry. All mass spectra were obtained using a Bruker Ultraflex MALDI-TOF/TOF (Bruker Daltonic GmbH). Ions were analyzed in positive mode, and external calibration was performed using a standard protein mixture (Bovine Serum Albumin). The mass signals (M+2/2) at half of the parent molecular weight of the antibody were taken from each chromatogram and averaged (n = 3), and the average unmodified trastuzumab weight was subtracted from the modified antibody weight to determine the mass contribution from conjugated chelator. The mass difference was divided by the molecular weight of the attached bifunctional chelator (p-SCN-Ph-DFO), and the error in each triplicate set of measurements (unmodified trastuzumab vs modified trastuzumab) was propagated to the final value of the number of chelates per antibody. Full MALDI-TOF spectra are shown in Supplementary Figures S1–S6.
Gel Electrophoresis
SEC-purified and concentrated samples of trastuzumab and the five DFO-conjugated variants – T5, T10, T20, T60 and T200 were characterized by sodium dodecyl sulfate-polyacrylamide gel electrophoresis (SDS-PAGE). Briefly, 3 μg of each of the antibody preparations mentioned above were combined with PBS and 500 mM dithiothreitol (NuPAGE® 10X Sample Reducing Agent, Thermo Fisher Scientific), and 4X electrophoresis buffer (NuPAGE® LDS Sample Buffer, Thermo Fisher Scientific). The mixture was denatured by heating to 95°C for 5 min using an agitating thermomixer. Subsequently each sample was loaded alongside an appropriate molecular weight marker (Novex™ Sharp pre-stained protein ladder; Thermo Fisher Scientific) onto a 1.5 mm, 15-well NuPAGE™ 4–12% Bis-Tris protein gel (Thermo Fisher Scientific) and run for ~4 h at 60 V/cm in NuPAGE™ MOPS SDS running buffer (Thermo Fisher Scientific). Upon completion of the electrophoresis to the desired extent to allow deciphering the migratory shifts in the position of the heavy chain and light chain fragments of the antibody samples, the gel was washed 3 times with milli-Q water prior to staining with SimplyBlue™ SafeStain (Thermo Fisher Scientific) for 1 h, and destained overnight in milli-Q water with mild agitation on a platform shaker. The gel was scanned and analyzed using an Odyssey Infrared Gel Scanner (Li-Cor Biosciences).
Surface Plasmon Resonance (SPR) Analysis
An SPR kinetic analysis was set up on the Biacore T200 instrument (GE Healthcare) to determine the binding affinities (KD) and kinetic constants (on-rate [ka] and off-rate [kd] for unmodified trastuzumab and the five immunoconjugates – T5, T10, T20, T60 and T200.
To investigate the impact of increasing DFO:Ab ratio upon conjugation with trastuzumab, we evaluated the interaction of the 5 DFO-conjugated variants of trastuzumab mentioned above and compared them directly to the interaction of unmodified trastuzumab with recombinant human HER2. To this end, a histidine-tagged variant of recombinant human HER2 (HE2-H822R Acro Biosystems) was used as the ligand whilst trastuzumab and its DFO-conjugated variants were used as the analyte in the SPR kinetic analysis assay. A series S sensor chip CM5 (29401988; GE Healthcare) was functionalized with an anti-histidine antibody using components from the his-capture kit (28995056; GE Healthcare). The amine coupling kit (BR-1000–50; GE Healthcare) was used to functionalize the CM5 sensor chip with the anti-histidine antibody according to the standard procedure prescribed by the application wizard on the Biacore T200. After the CM5 chip was functionalized with the anti-histidine antibody, a 41 nM solution of HER2 in running buffer (HBS-P+ buffer containing 50 μM EDTA) was injected over flow-cell 2 for 60 seconds at a flow rate of 10 μL/min. High performance injections of the various analyte concentrations of trastuzumab or its DFO-conjugates (50 nM, 25 nM, 12.5 nM, 6.25 nM, 3.13 nM, 1.56 nM, 0.78 nM, 0.39 nM and 0.195 nM) were performed over flow cells 1 and 2 for 5 min at a flow-rate of 30 μL/min. The dissociation of the analyte was evaluated by allowing the running buffer to flow over the chip surface for 5 min at a flow rate of 30 μL/min. Finally, the chip surface was regenerated using a 60s injection of 10 mM Glycine-HCl (his-capture kit) at a flow rate of 30 μL/min over both flow cell 1 and 2, followed by an extra wash using the running buffer. The kinetic data was analyzed using the BIAcore T200 evaluation software. A 1:1 fit (RI set to 0) was used to derive kinetic constants for the interaction between trastuzumab and its various DFO-conjugates with purified HER2 protein.
Calibration-free concentration assay (CFCA) was performed to determine the active concentration of the HER2-reactive antibody in the native unmodified trastuzumab and compared directly with the trastuzumab-DFO conjugate preparations. To this end, 200 nM stocks of unmodified trastuzumab and the various DFO-conjugates was prepared. The concentration of IgG (mg/mL) in the stock samples was determined using UV-Vis measurements on a Shimadzu Biospec-nano microvolume spectrophotometer. Next, two 10-fold dilutions of the 200 nM stock samples were prepared to yield 20 nM and 2 nM of unmodified trastuzumab and the 5 DFO-conjugated variants – T5, T10, T20, T60 and T200.
To carry out the CFCA, an NTA (nitrilotriacetic acid) Series S sensor chip (BR-1005–32; GE Healthcare) was charged with nickel ions (Ni2+) by performing a low sample consumption injection of 0.5 mM NiCl2 from the NTA Reagent kit (28–9950-43; GE Healthcare) for 60 seconds at a flow rate of 10 μL/min in flow cell 2. Next, the histidine-tagged recombinant human HER2 (HE2-H822R Acro Biosystems) was captured as the ligand on the Ni2+-coated flow-cell of the NTA chip. To capture the ligand, an 8nM solution of HER2 in running buffer (HBS-P+ buffer containing 50 μM EDTA) was injected over flow-cell 2 for 180 seconds at a flow rate of 10 μL/min. High performance injections of the 2 dilutions – 20 nM (1:10) and 2 nM (1:100) of unmodified trastuzumab or the DFO-conjugated variants was flowed at 2 flow rates – one high (100 μL/min) and one low (5 μL/min) were performed over flow cells 1 and 2 for a contact time of 36 sec and a dissociation time of 5 sec. Finally, the surface of the flow cells on the NTA chip was regenerated using two 30s injections of 350 mM EDTA (NTA Reagent kit) at a flow rate of 30 μL/min, followed by an extra wash using the running buffer. The data from the CFCA assay was analyzed using the BIAcore T200 evaluation software.
Zirconium-89 Radiolabeling Studies
For in vivo experiments, aliquots of chelate-modified antibody (~350 μg) were transferred to 2 mL microcentrifuge tubes and made up to ~0.5 mL with various buffers, depending on the experiment. For various radiolabeling and stability assays, different constructs (T5, T10, T20, T60/T200), variable antibody quantities (5 μg, 25 μg, 50 μg), volumes (0.1 and 1.0 mL), and other conditions were used and indicated for each in the results and discussion section. Buffers included phosphate buffered saline (PBS, pH 7.4) with some treated with chelex resin at 1.2 g/L Chelex overnight before use, chelex-treated TRIS/HCl buffer (tris(hydroxymethyl)aminomethane pH 7.4, 10 mM), or chelex-treated HEPES buffer (4-(2-Hydroxyethyl)piperazine-1-ethanesulfonic acid pH 7.4, 500 mM). For all radiolabeling reactions, aliquots of [89Zr]Zr-oxalate were neutralized to ~pH 7.0–7.4 using 1 M sodium carbonate, and subsequently mixed with the DFO-Trastuzumab samples (~2.0 mCi for in vivo studies, ~74 MBq) and reacted for 60 minutes at 37 °C. Radiochemical yields obtained were >98% after 1 hour by radio-iTLC (EDTA mobile phase, 50 mM, pH 5) using silica-gel impregnated glass-microfiber paper strips (iTLC-SG, Varian, Lake Forest, CA) (analyzed by AR-2000, Bioscan Inc., Washington, DC). 89Zr-labeled antibodies were then purified using SEC (PD10 column; GE Healthcare), followed by centrifugal filtration (Amicon® ultra 50k, with saline) to concentrate the final volume for formulation. The radiochemical purity of the final purified radiolabeled antibodies was confirmed to be >99% by radio-iTLC before injection. The [89Zr]Zr-DFO-Trastuzumab radioimmunoconjugate was assessed for stability in human blood serum (Sigma) for 7 days at 37 °C (radio-iTLC, >98%).
Cell-based Immunoreactivity Assays
The immunoreactive fraction (%IRF) of all [89Zr]Zr-DFO-trastuzumab immunoconjugates was determined using a cell-based radioligand binding assay. The assay relies on the use of at least 10 million target antigen-expressing cancer cells per microcentrifuge tube. The use of this quantity of cells is assumed to provide “infinite antigen” excess relative to the quantity of radiolabeled antibody (~6 ng) added to each microcentrifuge tube. To this end, 10 million HER2-expressing SKOV3 cells were suspended in microcentrifuge tubes in ~0.2 mL of media. 20 μL aliquots of the respective [89Zr]Zr-DFO-trastuzumab radioimmunoconjugates from a stock solution (~10–20 μCi, ~0.37–0.73 MBq of activity and ~3 μg of radioimmunoconjugate suspended in 10 mL of 1% bovine serum albumin) were added to each microcentrifuge tube of cells and mixed by gentle pipetting (n = 5 per immunoconjugate; final volume: ~220 μL). The samples were then left to sit on ice for 60 min with intermittent tapping to allow the cells to remain suspended. Subsequently, the cells were pelleted by centrifugation (600 g, 4 °C, for 3 min), and the media supernatant was transferred to a clean microcentrifuge tube using a pipette. Without resuspending, the cell pellets were washed three times with ice-cold PBS (1 mL) with re-centrifugation (600 g, 4 °C, 3 min) between each wash. The supernatant from the wash of each sample was collected into a new appropriately labeled microcentrifuge tube (1 mL). Each tube (cell pellet, media, and 3 PBS washes) was measured in an automated gamma counter (Perkin Elmer). The activity data were background-corrected, and the amount of activity (antibody) bound to the cells was compared to the total amount of activity present in the media and washes. The % immunoreactive fraction (IRF) was determined by dividing the amount of radioactivity bound to the cell pellet by the total amount of radioactivity present in the cell pellet, the media, and the washes.
Cell Culture
The HER2/neu overexpressing human ovarian cancer cell line SKOV3 was purchased from American Type Culture Collection (ATCC) and cultured in McCoy’s 5A Medium, modified to contain 1.5 mM L-glutamine and 2200 mg/L sodium bicarbonate and was grown with 100 units/mL penicillin G and 100 µg/mL streptomycin and 10% fetal bovine serum. Tissue culture flasks containing SKOV3 cells were stored under sterile conditions in incubators maintained at 37 °C and a 5% CO2 concentration. SKOV3 cells were handled under aseptic conditions in a tissue culture hood and harvested for splitting and passaging on a weekly-basis using a formulation of 0.25% trypsin/0.53 mM EDTA in Hank’s Buffered Salt Solution (HBSS) without calcium and magnesium, which was then neutralized with at least 200% the volume of trypsin with the appropriate medium containing fetal bovine serum.
Xenograft Mouse Models
Eight- to ten-week-old athymic nu/nu female mice (NCRNU-M) were obtained from Charles River Laboratories. Animals were housed in ventilated cages and provided food and water ad libitum, allowing them to acclimatize for 1 week prior to handling for implantation of tumors. HER2-expressing SKOV3 tumors were induced on the left shoulder by a subcutaneous injection of 5.0 × 10⁶ cells in a 100 μL cell suspension of a 1:1 mixture of fresh media/BD Matrigel (BD Biosciences). PET imaging and biodistribution studies were performed between 2–3 weeks after the subcutaneous implantation of tumor cells.
PET Imaging and Biodistribution
PET imaging was performed using a micro-PET rodent scanner (Focus 120, Concord Microsystems). Mice were administered radiolabeled antibody (~40 μg, ~190 μCi, ~7 MBq) in 200 μL sterile saline (0.9% NaCl) via lateral tail vein injection. Approximately 5 minutes prior to PET image acquisition, mice were anesthetized via inhalation of 2% isoflurane/oxygen gas mixture (Baxter Healthcare, Deerfield, IL) and placed on the scanner bed where anesthesia was maintained. PET images were acquired at 24, 72, and 120 h, with data being recorded via static scans with a minimum of 15 million coincident events (~20–30 minutes). An energy window of 350–700 keV and a coincidence timing window of 6 ns was used. Data was sorted into 2D histograms by Fourier rebinning, and transverse images were reconstructed by filtered back-projection (FBP) into a 128 × 128 × 63 (0.72 × 0.72 × 1.3 mm3) matrix. The image data was normalized to correct for non-uniformity of response of the PET, dead-time count losses, positron branching ratio, and physical decay to the time of injection, but no attenuation, scatter, or partial-volume averaging correction was applied. The counting rates in the reconstructed images were converted to activity concentrations (percentage injected dose [%ID] per gram of tissue) by use of a system calibration factor derived from the imaging of a mouse-sized water-equivalent phantom containing [89Zr]Zr. Images were analyzed using ASIPro VM software (Concorde Microsystems).
For ex vivo biodistribution studies, mice bearing subcutaneous xenografts as described above were intravenously injected through the tail vein with each of the [89Zr]Zr-trastuzumab conjugates (T5, T10, T20, T200) (~20–30 μCi, 0.74–1.1 MBq, ~5 μg, in 200–250 μL of sterile saline; tumor volume ~ 100–150 mm3). Mice were euthanized by isoflurane anesthesia followed by CO2 (g) asphyxiation and then cardiac puncture for drawing blood at time points of 24, 72, and 120 hours (n = 4 per time point). Following euthanasia, the following organs were collected including blood, tumor, heart, lungs, liver, spleen, pancreas, kidneys, large intestine, small intestine, muscle, bone (femur), and skin (ear). All organs were briefly rinsed in water and air-dried for 5 minutes. The organs from 89Zr-biodistribution experiments were placed in pre-weighed tubes, weighed again to obtain tissue weights, and the amount of radioactivity present was determined using a Perkin-Elmer automated Wizard II gamma counter. The counts were background- and decay-corrected from the time of injection and then converted to the percentage of injected dose (%ID) per gram of organ tissue (%ID/g). The radioactivity counts measured in each organ were converted to activity (μCi) using a calibration curve created from known standards of [89Zr]Zr (serial dilution from ~3 μCi 89Zr).
Supplementary Material
ACKNOWLEDGEMENTS
Eric W. Price was supported by the Natural Sciences and Engineering Research Council (NSERC) (Discovery Grant, RGPIN-2017–03952 2017–2022), the Canada Research Chairs program (CRC in Radiochemistry, 2016–2021, #231072), the Canadian Foundation for Innovation John Evans Leadership Fund (2016 #35162), the Sylvia Fedoruk Canadian Centre for Nuclear Innovation, the Saskatchewan Health Research Foundation (SHRF) Establishment Grant (2018–2020), and startup funds from the University of Saskatchewan (College of Arts and Science, Chemistry). SKS was supported by the Tow postdoctoral fellowship program. EKS was supported by a Saskatchewan Health Research Foundation (SHRF) postdoctoral fellowship (2017–2019). The MSKCC Small-Animal Imaging Core Facility, supported in part by NIH Small-Animal Imaging Research Program (SAIRP) Grant R24 CA83084 and NIH Center Grant P30 CA08748, are gratefully acknowledged. JSL was supported by R01 CA204167 and R35CA232130 as well as the Mr. William H. Goodwin and Mrs. Alice Goodwin and the Commonwealth Foundation for Cancer Research and The Center for Experimental Therapeutics at Memorial Sloan Kettering Cancer Center. The authors would like to thank Michael Murphy and Brian Lang at Biacore GE Life Sciences for advice and assistance with SPR analysis, and Z. H. Hume for thoughtful editing and discussions.
ABBREVIATIONS
- Ab
antibody
- PET
positron emission tomography
- 89Zr
zirconium-89
- RCY
radiochemical yield
- As
specific activity
- Am
molar activity
Footnotes
ASSOCIATED CONTENT
Supporting Information
The Supporting Information is available online and includes MALDI-TOF MS spectra and additional biodistribution data.
Disclosures: None.
REFERENCES
- 1.Holland JP, Williamson MJ, and Lewis JS (2010) Unconventional nuclides for radiopharmaceuticals. Mol. Imaging 9, 1–20. [PMC free article] [PubMed] [Google Scholar]
- 2.Deri MA, Zeglis BM, Francesconi LC, and Lewis JS (2013) PET imaging with 89Zr: From radiochemistry to the clinic. Nucl. Med. Biol 40, 3–14. [DOI] [PMC free article] [PubMed] [Google Scholar]
- 3.Holland JP, Sheh Y, and Lewis JS (2009) Standardized methods for the production of high specific-activity zirconium-89. Nucl. Med. Biol 36, 729–739. [DOI] [PMC free article] [PubMed] [Google Scholar]
- 4.Ikotun OF, and Lapi SE (2011) The rise of metal radionuclides in medical imaging: copper-64, zirconium-89 and yttrium-86. Future Med Chem 3, 599–621. [DOI] [PubMed] [Google Scholar]
- 5.Deri MA, Ponnala S, Zeglis BM, Pohl G, Dannenberg JJ, Lewis JS, and Francesconi LC (2014) Alternative Chelator for 89Zr Radiopharmaceuticals: Radiolabeling and Evaluation of 3,4,3-(LI-1,2-HOPO). J. Med. Chem 57, 4849–4860. [DOI] [PMC free article] [PubMed] [Google Scholar]
- 6.Patra M, Bauman A, Mari C, Fischer CA, Blacque O, Haussinger D, Gasser G, and Mindt TL (2014) An octadentate bifunctional chelating agent for the development of stable zirconium-89 based molecular imaging probes. Chem. Commun 50, 11523–11525. [DOI] [PubMed] [Google Scholar]
- 7.Briand M, Aulsebrook ML, Mindt TL, and Gasser G (2017) A solid phase-assisted approach for the facile synthesis of a highly water-soluble zirconium-89 chelator for radiopharmaceutical development. Dalton Trans 46, 16387–16389. [DOI] [PubMed] [Google Scholar]
- 8.Vugts DJ, Klaver C, Sewing C, Poot AJ, Adamzek K, Huegli S, Mari C, Visser GWM, Valverde IE, Gasser G, et al. (2017) Comparison of the octadentate bifunctional chelator DFO*-pPhe-NCS and the clinically used hexadentate bifunctional chelator DFO-pPhe-NCS for (89)Zr-immuno-PET. Eur. J. Nucl. Med. Mol. Imaging 44, 286–295. [DOI] [PMC free article] [PubMed] [Google Scholar]
- 9.Bhatt NB, Pandya DN, and Wadas TJ (2018) Recent Advances in Zirconium-89 Chelator Development. Molecules 23, 638. [DOI] [PMC free article] [PubMed] [Google Scholar]
- 10.Raave R, Sandker G, Adumeau P, Jacobsen CB, Mangin F, Meyer M, Moreau M, Bernhard C, Da Costa L, Dubois A, et al. (2019) Direct comparison of the in vitro and in vivo stability of DFO, DFO* and DFOcyclo* for (89)Zr-immunoPET. Eur. J. Nucl. Med. Mol. Imaging 46, 1966–1977. [DOI] [PMC free article] [PubMed] [Google Scholar]
- 11.Perk L, Vosjan M, Visser G, Budde M, Jurek P, Kiefer G, and van Dongen G (2010) p-Isothiocyanatobenzyl-desferrioxamine: a new bifunctional chelate for facile radiolabeling of monoclonal antibodies with zirconium-89 for immuno-PET imaging. Eur. J. Nucl. Med. Mol. Imaging 37, 250–259. [DOI] [PMC free article] [PubMed] [Google Scholar]
- 12.Vosjan MJWD, Perk LR, Visser GWM, Budde M, Jurek P, Kiefer GE, and van Dongen GAMS (2010) Conjugation and radiolabeling of monoclonal antibodies with zirconium-89 for PET imaging using the bifunctional chelate p-isothiocyanatobenzyl-desferrioxamine. Nat. Protocols 5, 739–743. [DOI] [PubMed] [Google Scholar]
- 13.Zeglis BM, and Lewis JS (2015) The bioconjugation and radiosynthesis of 89Zr-DFO-labeled antibodies. Journal of visualized experiments : JoVE, 52521. [DOI] [PMC free article] [PubMed] [Google Scholar]
- 14.Adumeau P, Davydova M, and Zeglis BM (2018) Thiol-Reactive Bifunctional Chelators for the Creation of Site-Selectively Modified Radioimmunoconjugates with Improved Stability. Bioconjugate Chem 29, 1364–1372. [DOI] [PMC free article] [PubMed] [Google Scholar]
- 15.Houghton JL, Zeglis BM, Abdel-Atti D, Aggeler R, Sawada R, Agnew BJ, Scholz WW, and Lewis JS (2015) Site-specifically labeled CA19.9-targeted immunoconjugates for the PET, NIRF, and multimodal PET/NIRF imaging of pancreatic cancer. Proc. Natl. Acad. Sci 112, 15850–15855. [DOI] [PMC free article] [PubMed] [Google Scholar]
- 16.Zeng D, Zeglis BM, Lewis JS, and Anderson CJ (2013) The Growing Impact of Bioorthogonal Click Chemistry on the Development of Radiopharmaceuticals. J. Nucl. Med 54, 829–832. [DOI] [PMC free article] [PubMed] [Google Scholar]
- 17.Zeglis BM, Sevak KK, Reiner T, Mohindra P, Carlin SD, Zanzonico P, Weissleder R, and Lewis JS (2013) A Pretargeted PET Imaging Strategy Based on Bioorthogonal Diels–Alder Click Chemistry. J. Nucl. Med 54, 1389–1396. [DOI] [PMC free article] [PubMed] [Google Scholar]
- 18.Zeglis BM, Davis CB, Aggeler R, Kang HC, Chen A, Agnew BJ, and Lewis JS (2013) Enzyme-Mediated Methodology for the Site-Specific Radiolabeling of Antibodies Based on Catalyst-Free Click Chemistry. Bioconjugate Chem 24, 1057–1067. [DOI] [PMC free article] [PubMed] [Google Scholar]
- 19.Zeglis BM, and Lewis JS (2011) A practical guide to the construction of radiometallated bioconjugates for positron emission tomography. Dalton Trans 40, 6168–6195. [DOI] [PMC free article] [PubMed] [Google Scholar]
- 20.Zeglis BM, Mohindra P, Weissmann GI, Divilov V, Hilderbrand SA, Weissleder R, and Lewis JS (2011) Modular Strategy for the Construction of Radiometalated Antibodies for Positron Emission Tomography Based on Inverse Electron Demand Diels-Alder Click Chemistry. Bioconjugate Chem 22, 2048–2059. [DOI] [PMC free article] [PubMed] [Google Scholar]
- 21.Lindmo T, and Bunn PA Jr (1986) Determination of the true immunoreactive fraction of monoclonal antibodies after radiolabeling. Methods Enzymol 121, 678–691. [DOI] [PubMed] [Google Scholar]
- 22.Lindmo T, Boven E, Cuttitta F, Fedorko J, and Bunn PA Jr (1984) Determination of the immunoreactive function of radiolabeled monoclonal antibodies by linear extrapolation to binding at infinite antigen excess. J. Immunol. Methods 72, 77–89. [DOI] [PubMed] [Google Scholar]
- 23.Holland JP, Divilov V, Bander NH, Smith-Jones PM, Larson SM, and Lewis JS (2010) 89Zr-DFO-J591 for ImmunoPET of Prostate-Specific Membrane Antigen Expression In Vivo. J. Nucl. Med 51, 1293–1300. [DOI] [PMC free article] [PubMed] [Google Scholar]
- 24.Anderson CJ, Schwarz SW, Connett JM, Cutler PD, Guo LW, Germain CJ, Philpott GW, Zinn KR, Greiner DP, Meares CF, et al. (1995) Preparation, Biodistribution and Dosimetry of Copper-64-Labeled Anti-Colorectal Carcinoma Monoclonal Antibody Fragments 1A3-F(ab’). J. Nucl. Med 36, 850–858. [PubMed] [Google Scholar]
- 25.Anderson CJ, Connett JM, Schwarz SW, Rocque PA, Guo LW, Philpott GW, Zinn KR, Meares CF, and Welch MJ (1992) Copper-64-Labeled Antibodies for PET Imaging. J. Nucl. Med 33, 1685–1691. [PubMed] [Google Scholar]
- 26.Price EW, Carnazza KE, Carlin SD, Cho A, Edwards KJ, Sevak KK, Glaser JM, de Stanchina E, Janjigian YY, and Lewis JS (2017) 89Zr-DFO-AMG102 Immuno-PET to Determine Local HGF Protein Levels in Tumors for Enhanced Patient Selection. J. Nucl. Med 58, 1386–1394. [DOI] [PMC free article] [PubMed] [Google Scholar]
- 27.Price EW, Edwards KJ, Carnazza KE, Carlin SD, Zeglis BM, Adam MJ, Orvig C, and Lewis JS (2016) A comparative evaluation of the chelators H4octapa and CHX-A″-DTPA with the therapeutic radiometal 90Y. Nucl. Med. Biol 43, 566–576. [DOI] [PMC free article] [PubMed] [Google Scholar]
- 28.Price EW, Zeglis BM, Cawthray JF, Ramogida CF, Ramos N, Lewis JS, Adam MJ, and Orvig C (2013) H4octapa-Trastuzumab: Versatile Acyclic Chelate System for 111In and 177Lu Imaging and Therapy. J. Am. Chem. Soc 135, 12707–12721. [DOI] [PMC free article] [PubMed] [Google Scholar]
- 29.Knight JC, Paisey SJ, Dabkowski AM, Marculescu C, Williams AS, Marshall C, and Cornelissen B (2016) Scaling-down antibody radiolabeling reactions with zirconium-89. Dalton Trans 45, 6343–6347. [DOI] [PubMed] [Google Scholar]
- 30.Ulaner GA, Hyman DM, Lyashchenko SK, Lewis JS, and Carrasquillo JA (2017) 89Zr-Trastuzumab PET/CT for Detection of Human Epidermal Growth Factor Receptor 2-Positive Metastases in Patients With Human Epidermal Growth Factor Receptor 2-Negative Primary Breast Cancer. Clin. Nucl. Med 42, 912–917. [DOI] [PMC free article] [PubMed] [Google Scholar]
- 31.Osborne JR, Green DA, Spratt DE, Lyashchenko S, Fareedy SB, Robinson BD, Beattie BJ, Jain M, Lewis JS, Christos P, et al. (2014) A Prospective Pilot Study of 89Zr-J591/PSMA Positron Emission Tomography (PET) in Men with Localized Prostate Cancer Undergoing Radical Prostatectomy. The Journal of Urology 5, 1439–1445. [DOI] [PMC free article] [PubMed] [Google Scholar]
- 32.Chang AJ, DeSilva R, Jain S, Lears K, Rogers B, and Lapi S (2012) 89Zr-Radiolabeled Trastuzumab Imaging in Orthotopic and Metastatic Breast Tumors. Pharmaceuticals 5, 79–93. [DOI] [PMC free article] [PubMed] [Google Scholar]
- 33.Gajria D, and Chandarlapaty S (2011) HER2-amplified breast cancer: mechanisms of trastuzumab resistance and novel targeted therapies. Expert Rev. Anticancer Ther 11, 263–75. [DOI] [PMC free article] [PubMed] [Google Scholar]
- 34.Oude Munnink TH, Dijkers EC, Netters SJ, Lub-de Hooge MN, Brouwers AH, Haasjes JG, Schroder CP, and de Vries EG (2010) Trastuzumab pharmacokinetics influenced by extent human epidermal growth factor receptor 2-positive tumor load. J. Clin. Oncol 28, e355–6; author reply e357. [DOI] [PubMed] [Google Scholar]
- 35.Dijkers EC, Oude Munnink TH, Kosterink JG, Brouwers AH, Jager PL, de Jong JR, van Dongen GA, Schroder CP, Lub-de Hooge MN, and de Vries EG (2010) Biodistribution of 89Zr-trastuzumab and PET Imaging of HER2-Positive Lesions in Patients With Metastatic Breast Cancer. Clin. Pharmacol. Ther 87, 586–592. [DOI] [PubMed] [Google Scholar]
- 36.Milenic DE, Wong KJ, Baidoo KE, Nayak TK, Regino CAS, Garmestani K, and Brechbiel MW (2010) Targeting HER2: A report on the in vitro and in vivo pre-clinical data supporting trastuzumab as a radioimmunoconjugate for clinical trials. mAbs 2, 550–564. [DOI] [PMC free article] [PubMed] [Google Scholar]
- 37.Dijkers ECF, Kosterink JGW, Rademaker AP, Perk LR, van Dongen GAMS, Bart J, de Jong JR, de Vries EGE, and Lub-de Hooge MN (2009) Development and Characterization of Clinical-Grade 89Zr-Trastuzumab for HER2/neu ImmunoPET Imaging. J. Nucl. Med 50, 974–981. [DOI] [PubMed] [Google Scholar]
- 38.Saran M, and Bors W (1997) Radiation Chemistry of Physiological Saline Reinvestigated: Evidence That Chloride-Derived Intermediates Play a Key Role in Cytotoxicity. Radiat. Res 147, 70–77. [PubMed] [Google Scholar]
- 39.Bhatt NB, Pandya DN, Rideout-Danner S, Gage HD, Marini FC, and Wadas TJ (2018) A comprehensively revised strategy that improves the specific activity and long-term stability of clinically relevant (89)Zr-immuno-PET agents. Dalton Trans 47, 13214–13221. [DOI] [PMC free article] [PubMed] [Google Scholar]
Associated Data
This section collects any data citations, data availability statements, or supplementary materials included in this article.