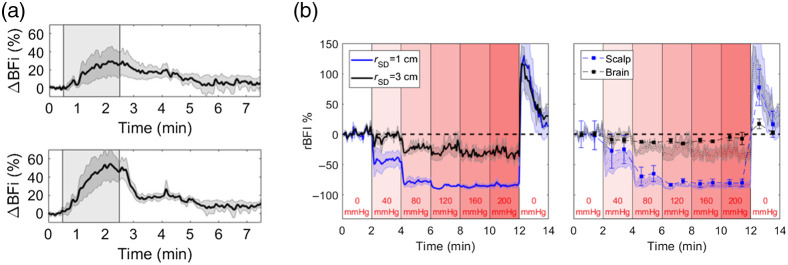
Fig. 4.
(a) Average increase in the blood flow index () during a 2-min period of hypercapnia as indicated by the shaded region (N = 9). Time courses are presented for source-detector separations of 1 (top) and 2.7 cm (bottom). Shading surrounding each line represented the standard error of the mean. (b) Left: relative changes in BFI (rBFI) in response to increases in tourniquet pressure recorded at source-detector separations () of 1 and 3 cm. Shading around each line represents the standard error (N = 5). Right: rBFI for brain and scalp derived from the three-layer model. Error bars represent the standard error of the mean. For reference, the shading represents the individual time courses recorded at and 3 cm.

