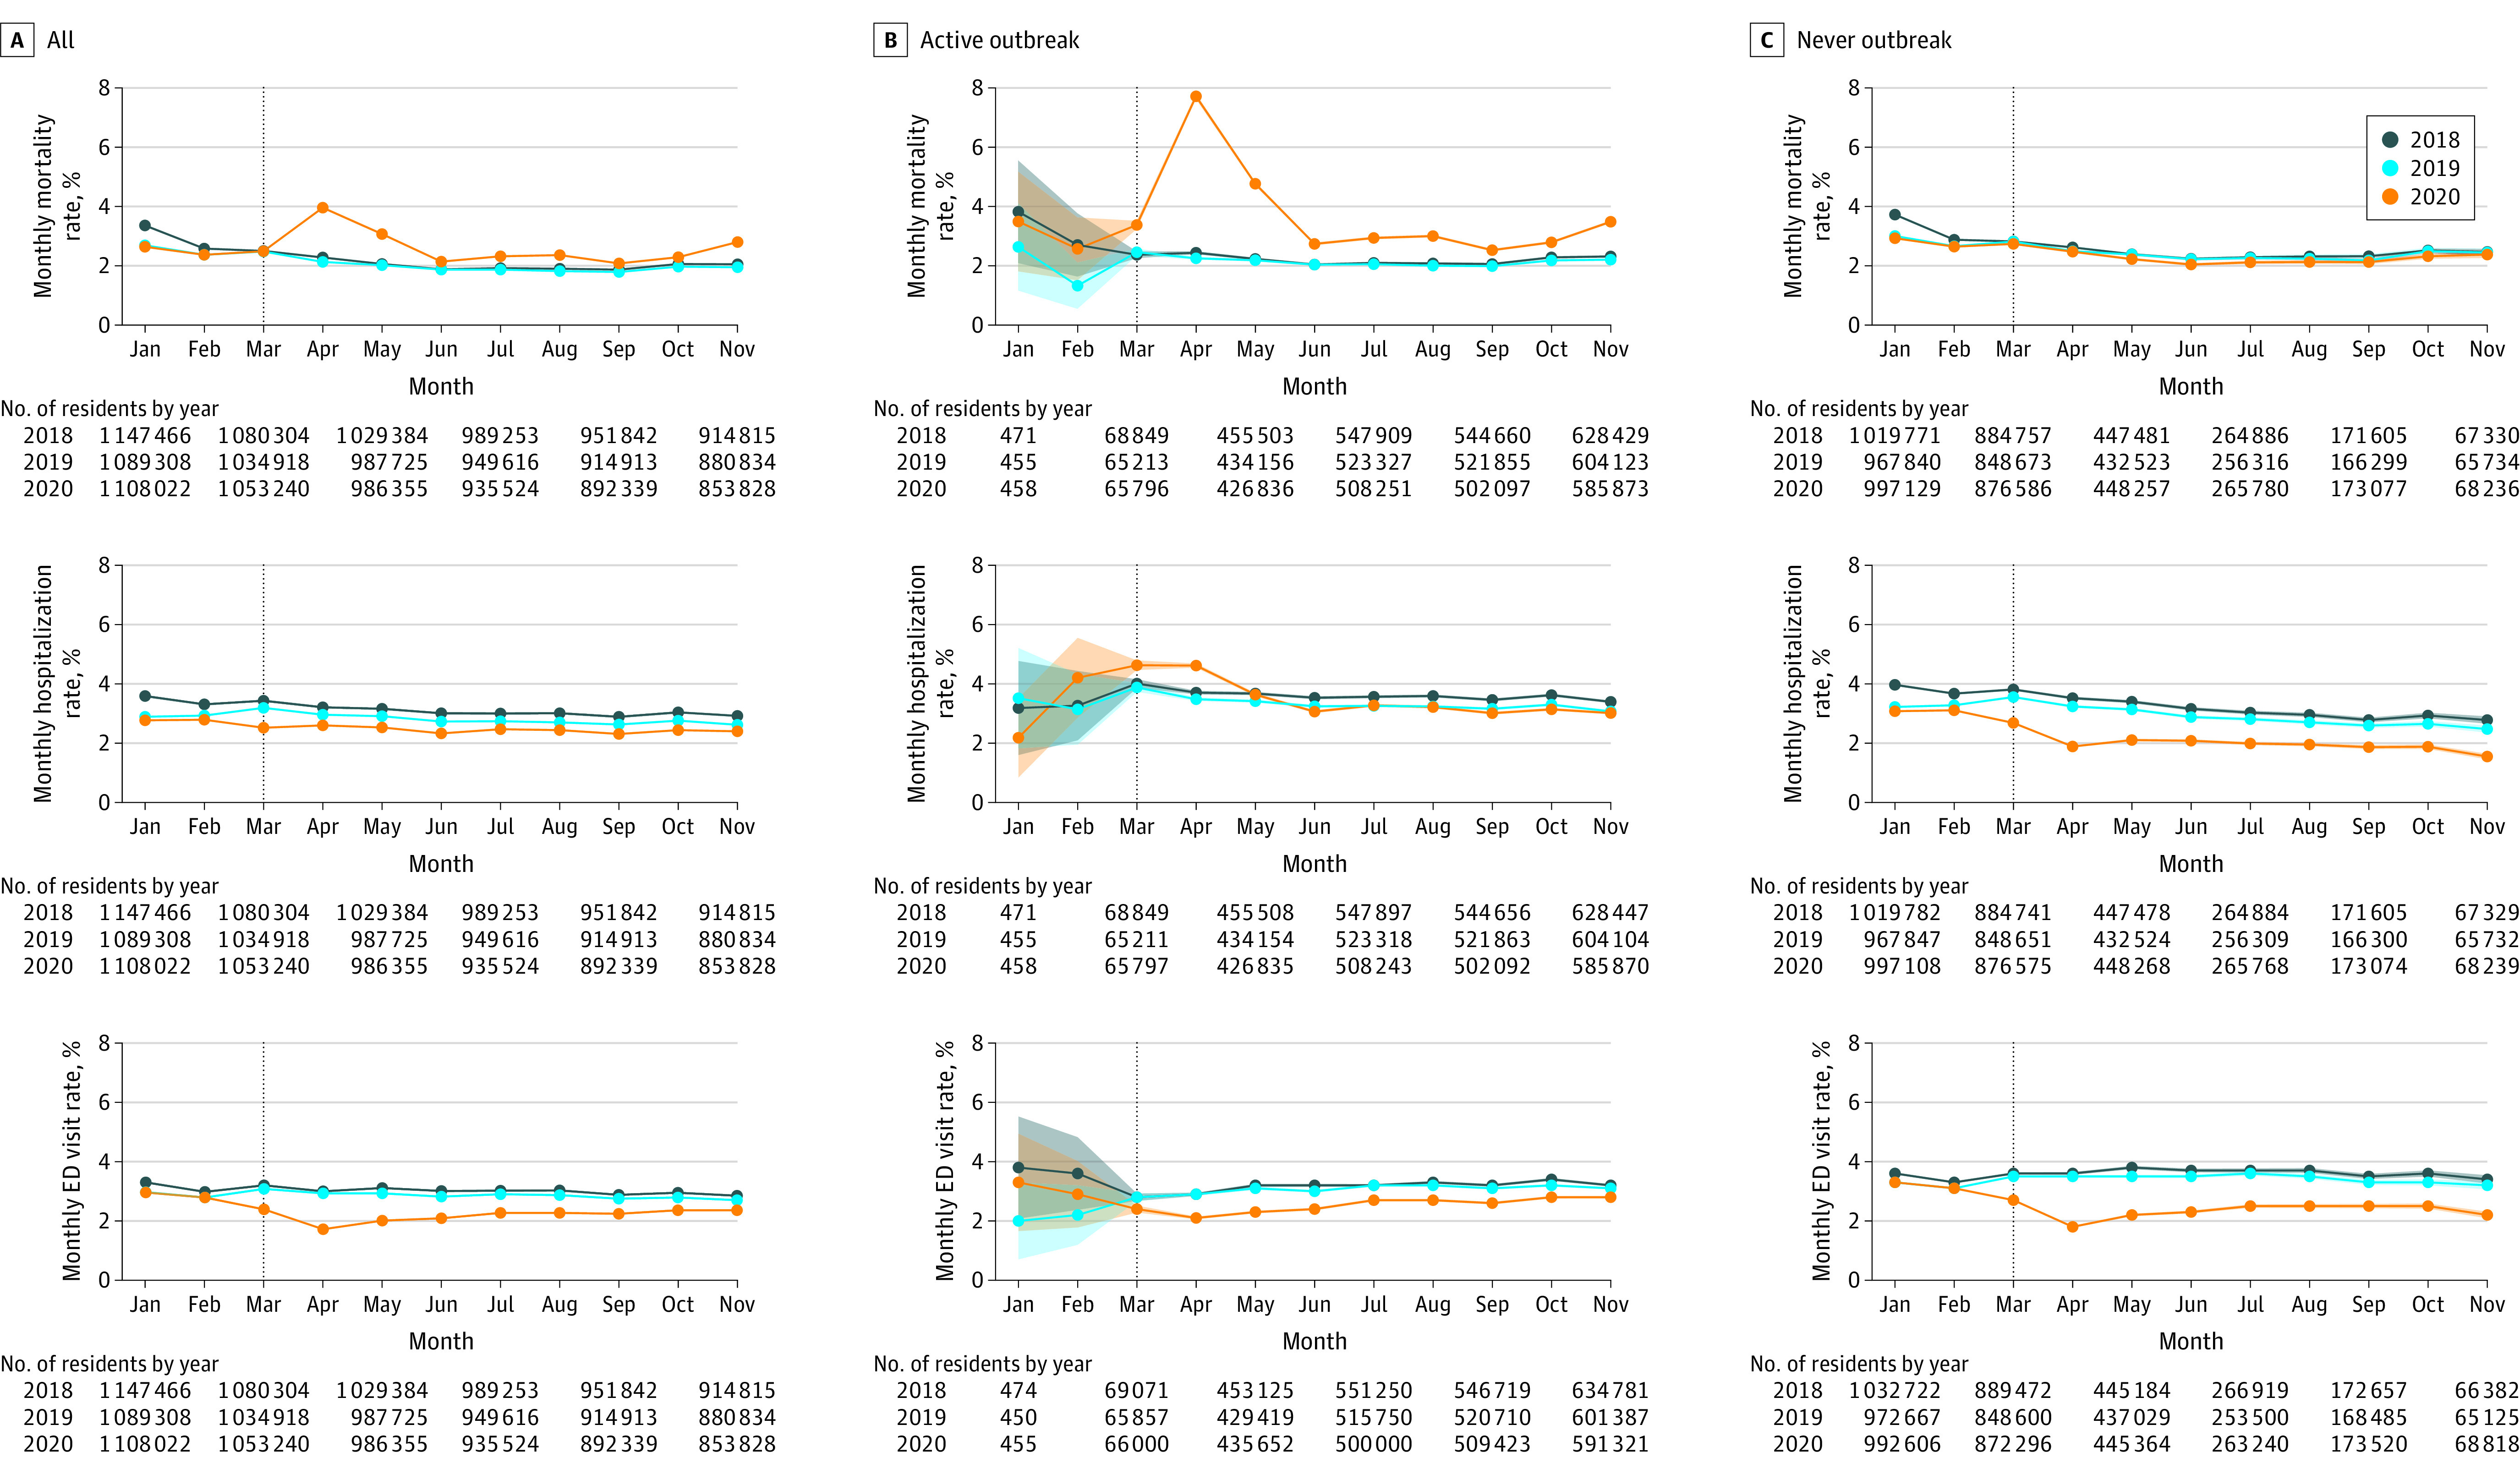
Figure 1. Health and Utilization Outcomes for Long-term Care Residents by Skilled Nursing Facility COVID-19 Exposure Status in 2018, 2019, 2020.

Each figure shows an array of all 15 477 skilled nursing facilities (SNFs) stratified by COVID-19 exposure group vs outcome measured monthly. Within the panels, results are reported for 2018, 2019, and 2020 with 95% CIs (shaded lines; shown only for the time intervals where N is small). The vertical line denotes March 2020, the month when the SNF lockdown policies became effective in the US. For the first 2 rows, outcomes represent average within-individual changes from the current month compared with the most recent assessment from the prior year. Higher scores indicate worse symptoms.
ED indicates emergency department.
