

Abstract
The effect of sarcopenic visceral obesity on the risk of nonalcoholic fatty liver disease (NAFLD) is uncertain. We investigated (a) whether the skeletal muscle mass to visceral fat area ratio (SV ratio), as a measure of sarcopenic visceral obesity, is a risk factor for NAFLD; and (b) whether the SV ratio adds to conventional adiposity measures to improve prediction of incident NAFLD. Adults without NAFLD (n = 151,017) were followed up for a median of 3.7 years. Hepatic steatosis was measured using ultrasonography, and liver fibrosis scores were estimated using the Fibrosis‐4 index (FIB‐4) and the NAFLD Fibrosis Score (NFS). Cox proportional hazards models were used to determine sex‐specific adjusted hazard ratios (aHRs) (95% confidence intervals [CIs]). The incremental predictive performance was assessed using the area under the receiver operating characteristic curve, net reclassification improvement, and integrated discrimination improvement. Multivariable aHRs (95% CIs) for incident NAFLD comparing the lowest versus the highest quintile of SV ratio were 3.77 (3.56–3.99) for men and 11.69 (10.46–13.06) for women (p–interaction by sex < 0.001). For incident NAFLD with intermediate/high FIB‐4, aHRs were 2.83 (2.19–3.64) for men and 7.96 (3.85–16.44) for women (similar results were obtained for NFS). Associations remained significant even after adjustment for body mass index, waist circumference, and time‐varying covariates. These associations were also more pronounced in nonobese than obese participants (p–interaction < 0.001). The addition of SV ratio to conventional adiposity measures modestly improved risk prediction for incident NAFLD. SV ratio was inversely associated with risk of developing NAFLD, with effect modification by sex and obesity. Conclusion: Low SV ratio is a complementary index to conventional adiposity measures in the evaluation of NAFLD risk.
Skeletal muscle mass to visceral fat area ratio (SV ratio) measures a sarcopenic visceral obesity. Low SV ratio was a strong and independent risk factor for developing NAFLD. Associations were most pronounced in women and in lean individuals.
INTRODUCTION
Nonalcoholic fatty liver disease (NAFLD) is the most prevalent chronic liver disease, with an overall estimated global prevalence of 25%–30% in adults.[ 1 ] NAFLD is a multisystem disease that increases the risk of liver‐specific complications and extrahepatic diseases, such as cardio‐metabolic morbidity and mortality.[ 2 , 3 , 4 , 5 ] Currently, there is no approved medical therapy for NAFLD.[ 6 ] Further research is needed to understand the heterogeneous factors that are involved in the etiology and pathogenesis of this complex liver condition, to give better insight into how best to identify high‐risk individuals and design effective treatments for the disease.
Obesity, specifically abdominal obesity, is a well‐established risk factor for NAFLD.[ 7 , 8 ] Visceral fat area (VFA) is an accurate and reproducible measure of abdominal obesity and has a stronger association with metabolic syndrome (MetS) and NAFLD risk than proxy measures of adiposity, such as body mass index (BMI) and waist circumference (WC).[ 7 , 9 ] Along with visceral obesity, reduced skeletal muscle mass, an essential component of sarcopenia, has been reported as a risk factor for NAFLD.[ 10 ] Skeletal muscle is a key tissue, given that glucose disposal is facilitated by insulin, and reduced skeletal muscle mass may induce relative insulin resistance.[ 11 , 12 ] Visceral adipose tissue is also strongly associated with insulin resistance[ 13 ]; thus, the combination of decreased muscle mass and increased visceral fat mass may markedly perturb metabolism and increase NAFLD risk.
Recently, it has been reported that “sarcopenic visceral obesity” (i.e., the coexistence of sarcopenia and high visceral adiposity levels) is associated with higher levels of insulin resistance and metabolic impairment than either the presence of low muscle mass or obesity as individual risk factors.[ 14 , 15 ] The skeletal muscle mass to VFA ratio (SV ratio) is a single integrated measure used to describe sarcopenic visceral obesity, and the SV ratio is generated by dividing the appendicular skeletal muscle mass (ASM) by VFA.[ 16 ] Recent studies have shown a close association between SV ratio and cardiometabolic diseases, including type 2 diabetes mellitus, MetS, and arterial stiffness, independent of conventional obesity measures.[ 16 , 17 ] To the best of our knowledge, no cohort studies to date have investigated the effect of SV ratio on the risk of developing incident NAFLD in the general population.
This study aimed to test the hypothesis that people with a low SV ratio, as an indicator of sarcopenic visceral obesity, have a greater risk of incident NAFLD (defined by liver fat) and incident NAFLD with increased risk of liver fibrosis (defined by liver fat and increased liver fibrosis scores), and that addition of the SV ratio to BMI or WC, as conventional adiposity measures, improves risk prediction for incident NAFLD.
MATERIALS AND METHODS
Study population
The present study was performed in a subsample of the Kangbuk Samsung Health Study, a large‐scale cohort study of Korean adults who attended health check‐ups annually or biennially at the Kangbuk Samsung Hospital Total Healthcare Centers in Seoul and Suwon, South Korea.[ 18 ] A total of 310,740 participants underwent an initial health check‐up, including bioelectrical impedance analyzer (BIA) measurements between 2011 and 2018 and at least one follow‐up examination until December 31, 2019. After excluding participants who met the exclusion criteria (Figure 1), 151,017 participants were included in the current analysis. All procedures involved in this study of human participants were in accordance with the Ethical Principles for Medical Research Involving Human Subjects outlined in the 2013 Declaration of Helsinki. This study was approved by the institutional review board of Kangbuk Samsung Hospital (IRB No. KBSMC 2021‐04‐048), which waived the requirement for informed consent due to the use of anonymized retrospective data that were routinely collected during the health screening process.
FIGURE 1.
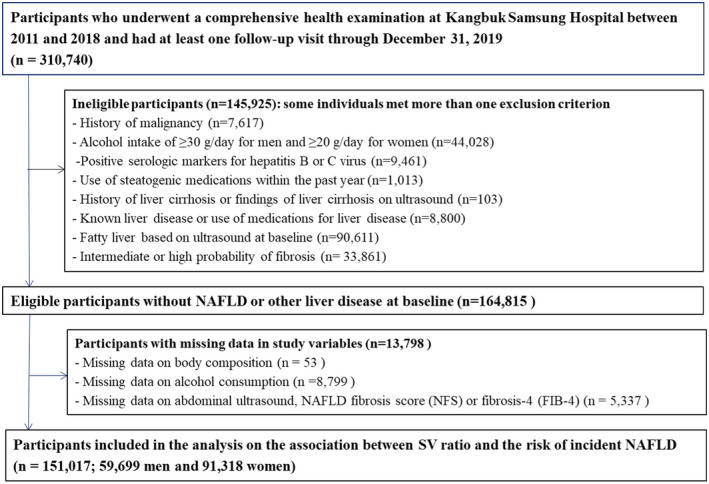
Flow chart of study participants. FIB‐4, Fibrosis‐4 index; NAFLD, nonalcoholic fatty liver disease; NFS, NAFLD fibrosis score
Data collection
Health screening examinations, including questionnaires, impedance analyses and liver ultrasounds, were repeated every year or 2 years during the follow‐up visits. Physical activity levels were recorded using the validated Korean version of the International Physical Activity Questionnaire short form and were converted to metabolic equivalents (METs; min/week).[ 19 ] They were classified into one of the following three categories: inactive, minimally active, or health‐enhancing physical activity, meeting one of the following two standards: (i) vigorous‐intensity activity on ≥3 days per week totaling ≥1,500 MET min/week, or (ii) 7 days with any combination of walking, moderate‐intensity, or vigorous‐intensity activities, achieving at least 3,000 MET min/week.[ 19 ]
Measurement and definition of SV ratio, a sarcopenic visceral obesity index
A multifrequency BIA (InBody 720; Biospace Inc.) was used to measure body composition after all participants had fasted overnight (≥10 h) before BIA measurement. The BIA technique has been validated for body composition assessment, with a good correlation with those obtained by dual‐energy X‐ray absorptiometry or abdominal computed tomography (CT), including VFA and ASM.[ 20 , 21 ] A previous study of 200 Korean adults aged 20–69 years estimated the validity of lean body mass (LBM) and percent body fat (PBF) measurements assessed using BIA and DXA.[ 22 ] The correlation coefficients between DXA and BIA for LBM and PBF were high (r = 0.951 and r = 0.889 for men and r = 0.956 and r = 0.898 for women, respectively).[ 22 ] In addition, in a study of children with obesity and NAFLD in the United States, total fat mass and skeletal muscle mass determined using BIA and MRI were strongly correlated (r = 0.813 and r = 0.701, respectively).[ 23 ] It has also been reported that visceral fat mass measured using BIA is highly correlated with visceral fat mass measured using abdominal CT scan (r = 0.759).[ 24 ] In our study, ASM was defined as the sum of the lean tissue mass in the arms and legs, and SV ratio (kg/cm2) was calculated as ASM (kg) divided by VFA (cm2).[ 16 , 25 ]
Liver ultrasound measures and definition of fatty liver and its severity
Abdominal ultrasound was performed by experienced radiologists who were unaware of the study's aims. Hepatic steatosis (HS) was diagnosed based on the standard criteria: a diffuse increase in fine echoes in the liver parenchyma compared with the kidney or spleen parenchyma, deep beam attenuation, and bright vessel walls.[ 26 ] The interobserver and intra‐observer reliability values for HS diagnosis were substantial (kappa statistic of 0.74) and excellent (kappa statistic of 0.94), respectively.[ 18 ] We used the Fibrosis‐4 (FIB‐4) and NAFLD fibrosis score (NFS), two validated noninvasive indices of advanced fibrosis, to evaluate HS severity.[ 27 , 28 ] The FIB‐4 cutoff points were defined as <1.30 (low risk), 1.30–2.67 (intermediate risk), and ≥2.67 (high risk) for predicting probability of advanced fibrosis.[ 27 , 28 ] The NFS cutoff points were <−1.455 for a low risk, 0.676 to −1.455 for an intermediate risk, and >0.676 for a high probability of advanced fibrosis.[ 27 , 28 ] Because the number of the study participants who progressed to high fibrosis score category (FIB‐4 ≥ 2.67 or NFS > 0.676) during a median follow‐up of 3.7 years was too small to obtain a reliable estimate, we combined the individuals with an intermediate and high risk of HS severity for FIB‐4 and NFS scores.
Statistical analysis
No standard cutoff points have been established for SV ratio to define sarcopenic visceral obesity. To assess the relationship between the SV ratio as a continuous factor and NAFLD risk, we modeled the SV ratio as restricted cubic splines with knots at the 5th, 27.5th, 50th, 72.5th, and 95th percentiles of the sample distribution to provide a flexible estimate of the concentration–response relationship between the SV ratio and incident NAFLD. Then, we defined sex‐specific quintiles of SV ratio within the study population as follows: 0.09–0.26, 0.26–0.31, 0.31–0.36, 0.36–0.45, and 0.45–8.04 for men, and 0.06–0.18, 0.18–0.22, 0.22–0.25, 0.25–0.30, and 0.30–6.34 for women. The fifth quintile representing the highest SV ratio was used as the reference group. The primary endpoints for the study were (a) incident HS and (b) incident HS with intermediate/high probability of advanced fibrosis at follow‐up, assessed by two noninvasive fibrosis markers (FIB‐4 and NFS levels). The incidence rate was presented as the number of cases per 1,000 person‐years. Cox proportional hazard models were used to estimate the adjusted hazard ratios (aHRs) with 95% confidence intervals (CIs) for incident HS by comparing the highest (reference) to each of the other four SV ratio quintiles.
The models were adjusted incrementally as follows: Model 1 was adjusted for age, center (Seoul or Suwon), year of the screening exam, education level (below college graduate, college graduate or higher, or unknown), alcohol consumption (<10 g/day or ≥10 g/day), smoking (never, former, current smoking, and unknown), physical activity (inactive, minimally active, health‐enhancing physical activity, or unknown), total energy intake (quintiles or unknown), medication for hyperlipidemia, history of diabetes, and history of hypertension. Model 2 was adjusted for all covariates in Model 1, plus BMI as a continuous variable. To incorporate change in SV ratio and change in covariates during the follow‐up period, we conducted time‐dependent analyses, in which updated status of SV ratio and other covariates were treated as time‐varying covariates.
We performed further analyses to compare the predictive ability of the SV ratio (and its individual components) using Harrell's C‐index (the area under the receiver operating characteristic curve [AUROC]) and also calculated net reclassification improvement (NRI), and integrated discrimination improvement (IDI) to quantify the incremental predictive ability by adding the SV ratio relative to BMI or WC.
Furthermore, to assess whether SV ratio provides additional information beyond BMI, an indicator of overall obesity, we performed stratified analyses based on obesity status (BMI of < 25 vs. ≥25 kg/m2[ 29 ]).
All analyses were conducted using STATA version 16.0 (StataCorp LP), and we defined the p value for statistical significance as a two‐sided p < 0.05.
RESULTS
Baseline characteristics
The baseline characteristics of 59,699 men and 91,318 women are presented according to SV ratio quintiles (Table 1 and Tables S1 and S2). Individuals in the lowest quintile of the SV ratio had the least appendicular skeletal muscle mass with the highest fat mass and greatest visceral fat area. Individuals in the lowest SV ratio (first quintile) tended to be older, consumed more alcohol, and had higher homeostasis model assessment of insulin resistance (HOMA‐IR) and hs‐CRP levels than those in the fifth quintile. Moreover, there were a higher proportion of subjects with hypertension, hyperlipidemia, and physical inactivity in this quintile compared to the highest SV ratio quintile. There was a modest inverse association between both obesity and abdominal obesity with SV ratio quintile; the correlation coefficients between SV ratio and BMI were −0.53 for women and −0.43 for men, while coefficients between SV ratio and WC were −0.49 for women and −0.43 for men. The baseline characteristics of the participants are presented according to the presence of missing data (Tables S3 and S4). Although most baseline characteristics were different between the two groups, main exposure and other anthropometric measures, including body composition, BMI, and waist circumference, after adjusting for age and sex were similar between the two groups.
TABLE 1.
Estimated a mean values (95% CI) and adjusted a proportion (95% CI) of baseline characteristics by SV ratio quintiles (n = 151,017)
| Characteristics | SV ratio (kg/cm2) quintiles | p trend | ||||
|---|---|---|---|---|---|---|
| Q1 | Q2 | Q3 | Q4 | Q5 | ||
| Number of participants | 30,205 | 30,209 | 30,198 | 30,205 | 30,200 | |
| Age (years) | 40.2 (40.1–40.2) | 37.8 (37.7–37.9) | 36.7 (36.6–36.8) | 35.9 (35.8–35.9) | 34.6 (34.6–34.7) | <0.001 |
| Male (%) | 38.3 (37.8–38.9) | 39.2 (38.7–39.8) | 39.7 (39.1–40.2) | 40.0 (39.4–40.5) | 40.4 (39.9–41.0) | <0.001 |
| Alcohol intake (%) b | 26.4 (25.9–26.8) | 24.5 (24.1–25.0) | 23.2 (22.7–23.6) | 22.9 (22.5–23.4) | 21.9 (21.4–22.3) | <0.001 |
| Current smoker (%) | 11.4 (11.1–11.7) | 11.7 (11.4–12.1) | 11.4 (11.1–11.8) | 11.5 (11.2–11.9) | 12.5 (12.1–12.8) | 0.001 |
| HEPA (%) | 11.4 (11.1–11.8) | 12.0 (11.6–12.3) | 12.6 (12.2–12.9) | 14.2 (13.8–14.6) | 16.2 (15.8–16.6) | <0.001 |
| Education level (%) c | 82.7 (82.3–83.1) | 86.4 (86.0–86.8) | 87.8 (87.4–88.2) | 87.7 (87.4–88.1) | 87.1 (86.7–87.5) | <0.001 |
| History of diabetes (%) | 0.6 (0.5–0.6) | 0.6 (0.5–0.7) | 0.5 (0.4–0.6) | 0.5 (0.4–0.5) | 0.6 (0.5–0.7) | 0.764 |
| History of hypertension (%) | 4.4 (4.2–4.6) | 3.3 (3.1–3.5) | 3.0 (2.8–3.2) | 2.9 (2.7–3.1) | 2.5 (2.3–2.7) | <0.001 |
| History of CVD (%) | 0.6 (0.5–0.7) | 0.6 (0.5–0.7) | 0.6 (0.5–0.7) | 0.6 (0.5–0.7) | 0.5 (0.4–0.6) | 0.342 |
| Antilipid medication use (%) | 1.4 (1.3–1.5) | 1.1 (0.9–1.2) | 0.9 (0.7–1.0) | 0.7 (0.6–0.8) | 0.6 (0.5–0.7) | <0.001 |
| Obesity (%) d | 36.6 (36.1–37.2) | 15.7 (15.3–16.1) | 8.6 (8.3–8.9) | 4.2 (3.9–4.4) | 1.1 (1.0–1.2) | <0.001 |
| Abdominal obesity (%) e | 28.0 (27.5–28.5) | 11.5 (11.1–11.8) | 5.5 (5.2–5.7) | 2.1 (1.9–2.2) | 0.4 (0.3–0.4) | <0.001 |
| Body mass index (kg/m2) | 24.2 (24.2–24.3) | 22.7 (22.7–22.8) | 21.9 (21.8–21.9) | 21.1 (21.1–21.1) | 19.9 (19.9–19.9) | <0.001 |
| Waist circumference (cm) | 82.8 (82.7–82.8) | 79.3 (79.3–79.4) | 77.2 (77.1–77.3) | 75.2 (75.1–75.3) | 71.8 (71.8–71.9) | <0.001 |
| Glucose (mg/dl) | 92.2 (92.1–92.3) | 91.5 (91.5–91.6) | 91.2 (91.1–91.3) | 90.8 (90.7–90.9) | 90.2 (90.1–90.3) | <0.001 |
| HbA1c (%) | 5.5 (5.5–5.5) | 5.5 (5.5–5.5) | 5.5 (5.5–5.5) | 5.5 (5.5–5.5) | 5.5 (5.5–5.5) | 0.682 |
| SBP (mm Hg) | 107.1 (107–107.2) | 105.1 (105–105.2) | 104.2 (104.1–104.3) | 103.6 (103.5–103.7) | 102.5 (102.4–102.6) | <0.001 |
| DBP (mmHg) | 68.4 (68.3–68.5) | 67.3 (67.2–67.3) | 66.8 (66.7–66.9) | 66.5 (66.4–66.6) | 66.0 (65.9–66.1) | <0.001 |
| Total cholesterol (mg/dl) | 195.5 (195.1–195.8) | 190.2 (189.9–190.6) | 187.0 (186.6–187.3) | 184.3 (183.9–184.6) | 180.5 (180.1–180.8) | <0.001 |
| LDL‐C (mg/dl) | 123.5 (123.2–123.8) | 118.0 (117.7–118.3) | 114.7 (114.4–115.0) | 111.3 (111–111.6) | 106.0 (105.7–106.3) | <0.001 |
| HDL‐C (mg/dl) | 60.6 (60.5–60.8) | 62.1 (61.9–62.2) | 63.4 (63.2–63.6) | 65.3 (65.2–65.5) | 68.0 (67.9–68.2) | <0.001 |
| Triglycerides (mg/dl) | 100.1 (99.5–100.6) | 93.0 (92.5–93.6) | 88.2 (87.7–88.7) | 83.1 (82.6–83.6) | 75.4 (74.9–75.9) | <0.001 |
| ALT (U/L) | 19.0 (18.9–19.1) | 17.7 (17.6–17.8) | 16.9 (16.0.8–17) | 16.2 (16.1–16.3) | 15.4 (15.3–15.5) | <0.001 |
| AST (U/L) | 19.3 (19.2–19.3) | 18.8 (18.7–18.9) | 18.6 (18.5–18.6) | 18.5 (18.5–18.6) | 18.6 (18.6–18.7) | <0.001 |
| GTP (U/L) | 24.7 (24.5–24.9) | 21.6 (21.4–21.8) | 20.2 (20.0–20.4) | 19.0 (18.8–19.2) | 17.7 (17.5–17.9) | <0.001 |
| hs‐CRP (mg/L) | 1.25 (1.17–1.33) | 0.91 (0.84–0.99) | 0.85 (0.78–0.93) | 0.83 (0.75–0.91) | 0.78 (0.70–0.85) | <0.001 |
| HOMA‐IR | 1.56 (1.56–1.57) | 1.36 (1.35–1.37) | 1.25 (1.24–1.26) | 1.14 (1.14–1.15) | 1.00 (0.99–1.00) | <0.001 |
| Total energy intake (kcal/d) f | 1374 (1366‐1382) | 1382 (1374‐1390) | 1373 (1365‐1381) | 1375 (1367‐1383) | 1395 (1387‐1403) | 0.002 |
| ASM (kg) | 18.4 (18.4–18.5) | 18.8 (18.8–18.8) | 19.0 (19.0–19.0) | 19.1 (19.1–19.2) | 19.3 (19.2–19.3) | <0.001 |
| Visceral fat area (cm2) | 96.5 (96.4–96.7) | 77.4 (77.3–77.5) | 67.0 (66.9–67.1) | 57.1 (57.0–57.3) | 41.9 (41.8–42.1) | <0.001 |
| Fat mass (kg) | 21.0 (20.9–21.0) | 17.5 (17.4–17.5) | 15.4 (15.4–15.5) | 13.5 (13.5–13.6) | 10.7 (10.7–10.7) | <0.001 |
Note: The mean SV ratio in each quintile among men: Q1, 0.23; Q2, 0.29; Q3, 0.33; Q4, 0.40; and Q5, 0.63.
The mean SV ratio in each quintile among women: Q1, 0.17; Q2, 0.21; Q3, 0.25; Q4, 0.29; and Q5, 0.40.
Abbreviations: ALT, alanine aminotransferase; ASM, appendicular skeletal muscle mass; AST, aspartate transaminase; CI, confidence interval; CVD, cardiovascular disease; DBP, diastolic blood pressure; GTP, guanosine triphosphate; HbA1c, hemoglobin A1c; HDL‐C, high‐density lipoprotein–cholesterol; HEPA, health‐enhancing physically active; HOMA‐IR, homeostasis model assessment of insulin resistance; hs‐CRP, high‐sensitivity C‐reactive protein; LDL‐C, low‐density lipoprotein–cholesterol; SBP, systolic blood pressure.
Adjusted for age and sex.
≥10 g/day.
≥College graduate.
Body mass index ≥ 25 kg/m2.
Waist circumference ≥ 90 cm for men and ≥85 cm for women.
Among the 103,890 participants with plausible estimated energy intake levels (within 3 SDs from the log‐transformed mean energy intake).
Development of NAFLD according to SV ratio
During 523145.8 person‐years of follow‐up, 26,543 cases of incident NAFLD were identified (27.0 per 103 person‐years for women; and 91.7 per 103 person‐years for men), and the median follow‐up duration was 3.7 years (interquartile range: 2.0–4.8 years; maximum: 7.3 years). In the spline regression models, the NAFLD risk decreased across the range of the SV ratios in men (Figure 2). In women, the SV ratio showed an inverted J‐shaped association with the incidence of NAFLD, while the overall trend tended to be inverse between the SV ratio and NAFLD risk. SV ratio quintile was inversely associated with the risk of incident NAFLD (p–trend < 0.001) and this association differed by sex (p–interaction < 0.001) (Table 2). After adjustment for confounders, multivariable‐adjusted HRs (95% CIs) for incident NAFLD, comparing the lowest to the highest SV ratio quintile, were 3.42 (3.24–3.61) for men and 11.27 (10.10–12.58) for women. These associations were attenuated after adjusting for BMI, but values remained highly statistically significant. Importantly, all of these associations were similarly observed in time‐dependent analyses; wherein, the updated status of SV ratio and other confounders were incorporated as time‐varying covariates. These data indicated that change in SV ratio or other key covariates between baseline and follow up, did not materially affect the results. After adjusting for WC instead of BMI, this association persisted (Table S5).
FIGURE 2.
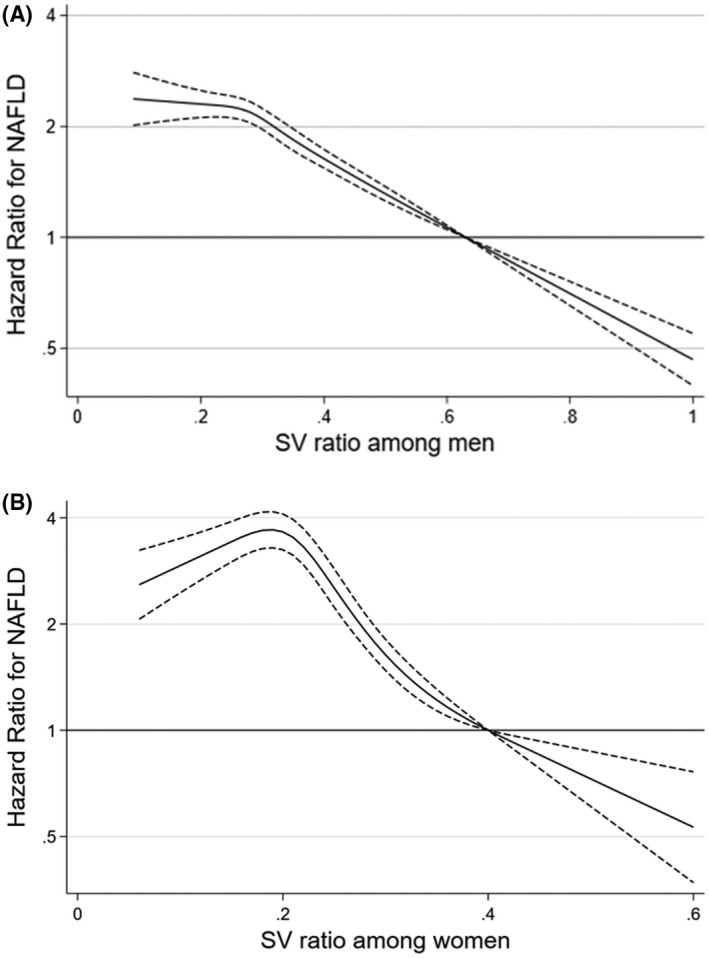
Multivariable adjusted hazard ratios (95% confidence intervals) for incident NAFLD using the skeletal muscle mass and visceral fat area ratio (SV ratio) as a continuous factor in men (A) and women (B). The curves represent adjusted hazard ratios (solid line) and their 95% confidence intervals (dashed lines) for incident NAFLD on the basis of restricted cubic splines for the SV ratios with knots at the 5th, 27.5th, 50th, 72.5th, and 95th percentiles of sex‐specific sample distribution. The model was adjusted for age, center, year of screening exam, alcohol consumption, smoking, physical activity, total energy intake, education level, hyperlipidemia medication, history of diabetes, history of hypertension, and body mass index
TABLE 2.
Development of NAFLD by SV ratio quintiles
| SV ratio (kg/cm2) quintiles | Person‐years | Incident cases | Incidence density (per 103 person‐years) | Age‐adjusted HR (95% CI) | Multivariable‐adjusted HR a (95% CI) | HR (95% CI) b in a model with time‐dependent variables | |
|---|---|---|---|---|---|---|---|
| Model 1 | Model 2 | ||||||
| Men | |||||||
| Q1 (<0.26) | 34,429 | 4,937 | 143.4 | 3.42 (3.24–3.61) | 3.77 (3.56–3.99) | 1.92 (1.8–2.05) | 2.46 (2.30–2.63) |
| Q2 (0.26–0.30) | 36,754 | 4,275 | 116.3 | 2.75 (2.60–2.90) | 2.97 (2.81–3.15) | 1.84 (1.74–1.96) | 2.29 (2.15–2.44) |
| Q3 (0.31–0.35) | 38,362 | 3,628 | 94.6 | 2.23 (2.10–2.36) | 2.36 (2.23–2.50) | 1.66 (1.56–1.76) | 2.00 (1.88–2.13) |
| Q4 (0.36–0.44) | 39,930 | 2,961 | 74.2 | 1.74 (1.65–1.85) | 1.81 (1.70–1.92) | 1.44 (1.35–1.53) | 1.64 (1.54–1.75) |
| Q5 (≥0.45) | 42,393 | 1,800 | 42.5 | 1.00 (reference) | 1.00 (reference) | 1.00 (reference) | 1.00 (reference) |
| p–trend | <0.001 | <0.001 | <0.001 | <0.001 | |||
| Per 0.1 decrease in SV ratio | 1.41 (1.39–1.43) | 1.45 (1.43–1.48) | 1.21 (1.19–1.23) | 1.28 (1.26–1.31) | |||
| Women | |||||||
| Q1 (<0.19) | 59,022 | 3,928 | 66.6 | 11.27 (10.10–12.58) | 11.69 (10.46–13.06) | 3.37 (2.99–3.8) | 3.65 (3.18–4.19) |
| Q2 (0.19–0.22) | 66,574 | 2,406 | 36.1 | 6.44 (5.76–7.21) | 6.73 (6.01–7.53) | 3.19 (2.84–3.57) | 3.76 (3.28–4.31) |
| Q3 (0.23–0.26) | 67,680 | 1,433 | 21.2 | 3.87 (3.45–4.35) | 4.02 (3.58–4.51) | 2.46 (2.19–2.77) | 2.50 (2.17–2.87) |
| Q4 (0.27–0.31) | 68,393 | 819 | 12.0 | 2.24 (1.98–2.54) | 2.31 (2.04–2.61) | 1.74 (1.54–1.98) | 1.74 (1.50–2.02) |
| Q5 (≥0.32) | 69,611 | 356 | 5.1 | 1.00 (reference) | 1.00 (reference) | 1.00 (reference) | 1.00 (reference) |
| p–trend | <0.001 | <0.001 | <0.001 | <0.001 | |||
| Per 0.1 decrease in SV ratio | 3.46 (3.32–3.60) | 3.55 (3.40–3.70) | 1.68 (1.60–1.76) | 1.53 (1.47–1.60) | |||
Note: The mean SV ratio in each quintile among men: Q1, 0.23; Q2, 0.29; Q3, 0.33; Q4, 0.40; and Q5, 0.63. The mean SV ratio in each quintile among women: Q1, 0.17; Q2, 0.21; Q3, 0.25; Q4, 0.29; and Q5, 0.40.
Abbreviation: HR, hazard ratio.
Estimated from Cox proportional hazard models. Multivariable model 1 was adjusted for age, center, year of screening exam, alcohol consumption, smoking, physical activity, total energy intake, education level, medication for hyperlipidemia, history of diabetes, and history of hypertension. Model 2: Model 1 plus adjustment for body mass index.
Estimated from Cox proportional hazard models with quintiles of SV ratio, smoking, alcohol consumption, physical activity, total energy intake, body mass index, medication for hyperlipidemia, history of diabetes, and history of hypertension as time‐dependent categorical variables, and baseline age, center, year of screening exam, and education level as time‐fixed variables.
In the analyses to evaluate the predictive ability of the SV ratio (and its individual components), a significant but modest increase in category‐based NRI and IDI were observed when the SV ratio was added to the BMI‐based model or WC‐based model (Table 3, Table S6). The improvement was greater than that observed with the individual components (Table S6). The predictive performance of the SV ratios was not superior to that of BMI or WC‐based on the AUROC (Table S7). Although in our study, the predictive performance of BMI, waist circumference, and SV ratio was inadequate to predict incident NAFLD on an individual level (Table S7), adding the SV ratio improved the NRI and IDI (Table 3). Thus, the SV ratio may be a complementary index to conventional adiposity measures for evaluating NAFLD risk.’
TABLE 3.
Comparison of the discriminatory power of the SV ratios in the detection of NAFLD
| AUROC (95% CI) | NRI a | IDI | ||||
|---|---|---|---|---|---|---|
| Harrel's C (95% CI) | p value | Index | p value | Index | p value | |
| Addition of SV ratio to BMI | ||||||
| Men | ||||||
| Base model (age and BMI) b | 0.643 (0.638–0.647) | reference | reference | reference | ||
| + SV ratio | 0.650 (0.646–0.654) | <0.001 | 0.03994 | <0.001 | 0.00636 | <0.001 |
| Women | ||||||
| Base model (age and BMI) b | 0.779 (0.774–0.783) | reference | reference | reference | ||
| + SV ratio | 0.782 (0.778–0.787) | <0.001 | 0.00757 | 0.013 | 0.00041 | 0.073 |
| Addition of SV ratio to waist circumference | ||||||
| Men | ||||||
| Base model (age and waist circumference) c | 0.649 (0.644–0.653) | reference | reference | reference | ||
| + SV ratio | 0.656 (0.652–0.660) | <0.001 | 0.04078 | <0.001 | 0.00537 | <0.001 |
| Women | ||||||
| Base model (age and waist circumference) c | 0.769 (0.765–0.774) | reference | reference | reference | ||
| +SV ratio | 0.778 (0.774–0.783) | <0.001 | 0.02538 | <0.001 | 0.00371 | <0.001 |
Abbreviations: AUROC, area under the receiver operating characteristic curve; BMI, body mass index; IDI, integrated discrimination improvement; NRI, net reclassification improvement.
Risk cutoffs of 10% and 30% were used.
Base model adjusted for age and BMI.
Base model adjusted for age and waist circumference.
Development of NAFLD with intermediate/high fibrosis score according to SV ratio
During follow‐up, 1329 cases of incident NAFLD with intermediate/high FIB4 score were identified (0.9 per 103 person‐years for women; and 4.3 per 103 person‐years for men), while 1986 cases of incident NAFLD with intermediate/high NFS score were identified (1.3 per 103 person‐years for women; and 6.5 per 103 person‐years for men). The risk of incident NAFLD with increased fibrosis scores decreased as SV ratio increased (p–trend < 0.001) and this association was stronger in women than in men (p–interaction < 0.001) (Table 4), although the age‐standardized incidence of NAFLD was much lower in women than in men (Table S8). Comparing the lowest to the highest SV ratio quintile, the multivariable‐adjusted HRs (95% CIs) for incident NAFLD with intermediate/high FIB4 were 2.83 (2.19–3.64) for men and 7.96 (3.85–16.44) for women. These associations were attenuated after adjustment for either BMI or WC (Table S3) but remained statistically significant. These associations were also consistently observed in time‐dependent analyses, again indicating that change in status of SV ratio or other covariates between baseline and follow up did not materially affect the results. The results were also more pronounced when NFS was used instead of the FIB‐4 score. Further adjustment for HOMA‐IR and high‐sensitivity C‐reactive protein also did not materially change the results (Table S9).
TABLE 4.
Development of hepatic steatosis plus intermediate‐to‐high probability of advanced fibrosis by SV ratio quintiles
| SV ratio (kg/cm2) quintiles | HS plus intermediate‐to‐high FIB‐4 | HS plus intermediate‐to‐high NFS | ||||||
|---|---|---|---|---|---|---|---|---|
| Person‐years | Incident cases | Incidence density (per 103 person‐years) | Multivariable‐adjusted HR a (95% CI) | Person‐years | Incident cases | Incidence density (per 103 person‐years) | Multivariable‐adjusted HR a (95% CI) | |
| Men | ||||||||
| Q1 (<0.26) | 46,789 | 368 | 7.9 | 2.83 (2.19–3.64) | 46,297 | 570 | 12.3 | 3.98 (3.21–4.93) |
| Q2 (0.26–0.30) | 47,295 | 223 | 4.7 | 2.20 (1.70–2.84) | 46,950 | 386 | 8.2 | 3.23 (2.60–4.00) |
| Q3 (0.31–0.35) | 47,094 | 186 | 3.9 | 2.01 (1.56–2.61) | 46,972 | 251 | 5.3 | 2.20 (1.76–2.75) |
| Q4 (0.36–0.44) | 46,728 | 153 | 3.3 | 1.71 (1.31–2.23) | 46,628 | 195 | 4.2 | 1.70 (1.35–2.14) |
| Q5 (≥0.45) | 46,344 | 86 | 1.9 | 1.00 (reference) | 46,292 | 114 | 2.5 | 1.00 (reference) |
| p–trend | <0.001 | <0.001 | ||||||
| Per 0.1 decrease in SV ratio | 1.36 (1.27–1.45) | 1.55 (1.46–1.65) | ||||||
| Women | ||||||||
| Q1 (<0.19) | 67,879 | 177 | 2.6 | 7.96 (3.85–16.44) | 67,702 | 274 | 4.0 | 12.69 (6.88–23.41) |
| Q2 (0.19–0.22) | 72,083 | 65 | 0.9 | 4.60 (2.20–9.61) | 72,014 | 105 | 1.5 | 6.27 (3.36–11.69) |
| Q3 (0.23–0.26) | 70,823 | 35 | 0.5 | 3.01 (1.39–6.49) | 70,759 | 54 | 0.8 | 3.74 (1.95–7.16) |
| Q4 (0.27–0.31) | 70,163 | 28 | 0.4 | 2.84 (1.29–6.23) | 70,176 | 26 | 0.4 | 2.01 (0.99–4.07) |
| Q5 (≥0.32) | 70,365 | 8 | 0.1 | 1.00 (reference) | 70,350 | 11 | 0.2 | 1.00 (reference) |
| p–trend | <0.001 | <0.001 | ||||||
| Per 0.1 decrease in SV ratio | 2.57 (2.01–3.28) | 3.95 (3.21–4.87) | ||||||
Note: The mean SV ratio in each quintile among men: Q1, 0.23; Q2, 0.29; Q3, 0.33; Q4, 0.40; and Q5, 0.63. The mean SV ratio in each quintile among women: Q1, 0.17; Q2, 0.21; Q3, 0.25; Q4, 0.29; and Q5, 0.40.
Abbreviation: HS, hepatic steatosis.
Estimated from Cox proportional hazard models with adjustment for age, center, year of screening exam, alcohol consumption, smoking, physical activity, total energy intake, education level, medication for hyperlipidemia, history of diabetes (only for HS plus intermediate‐to‐high FIB‐4), and history of hypertension.
The risk of developing NAFLD with a high fibrosis score, either high FIB‐4 or high NFS, was significantly higher in the lowest SV ratio quintile than in the highest SV ratio quintile among men; although a similar tendency was observed among women, this did not reach statistical significance (Table S10).
Subgroup analysis
The associations between SV ratio quintiles and incident NAFLD differed by obesity status defined as BMI ≥ 25 kg/m2 (p–interaction < 0.001), in which the association was considerably stronger in nonobese individuals than obese individuals (Table 5). For men, the HR (95% CI) for NAFLD comparing the lowest to the highest SV ratio quintile was 2.92 (2.73–3.13) for nonobese participants and 1.72 (1.42–2.07) for obese participants. In contrast to men, women with the lowest SV ratio had a markedly increased risk of NAFLD in nonobese subjects (HR: 7.97, 95% CI: 7.10–8.94). In obese women in the lowest SV ratio quintile, there was a trend toward increased risk of incident NAFLD (HR: 1.87, 95% CI: 0.47–7.48).
TABLE 5.
Hazard ratios a (95% CIs) of NAFLD according to SV ratio quintiles by overall obesity
| SV ratio (kg/cm2) quintiles | No obesity | Obesity | p value b | ||||||
|---|---|---|---|---|---|---|---|---|---|
| Person‐years | Incident cases | Incidence density (per 103 person‐years) | Multivariable‐adjusted HR a (95% CI) | Person‐years | Incident cases | Incidence density (per 103 person‐years) | Multivariable‐adjusted HR a (95% CI) | ||
| Men | |||||||||
| Q1 (<0.26) | 20,065 | 2,203 | 109.8 | 2.92 (2.73–3.13) | 14,363 | 2,734 | 190.3 | 1.72 (1.42–2.07) | <0.001 |
| Q2 (0.26–0.30) | 27,067 | 2,716 | 100.3 | 2.63 (2.47–2.80) | 9,686 | 1,559 | 161.0 | 1.42 (1.17–1.72) | |
| Q3 (0.31–0.35) | 31,908 | 2,664 | 83.5 | 2.15 (2.02–2.28) | 6,455 | 964 | 149.4 | 1.31 (1.08–1.59) | |
| Q4 (0.36–0.44) | 36,326 | 2,526 | 69.5 | 1.75 (1.64–1.86) | 3,604 | 435 | 120.7 | 1.05 (0.85–1.28) | |
| Q5 (≥0.45) | 41,404 | 1,686 | 40.7 | 1.00 (reference) | 988 | 114 | 115.4 | 1.00 (reference) | |
| p–trend | <0.001 | <0.001 | |||||||
| Per 0.1 decrease in SV ratio | 1.34 (1.32–1.36) | 1.31 (1.26–1.37) | 0.308 | ||||||
| Women | |||||||||
| Q1 (<0.19) | 45,524 | 2141 | 47.0 | 7.97 (7.10–8.94) | 13,498 | 1,787 | 132.4 | 1.87 (0.47–7.48) | <0.001 |
| Q2 (0.19–0.22) | 62,913 | 2034 | 32.3 | 5.93 (5.29–6.65) | 3,661 | 372 | 101.6 | 1.49 (0.37–5.99) | |
| Q3 (0.23–0.26) | 66,588 | 1328 | 19.9 | 3.75 (3.33–4.22) | 1,092 | 105 | 96.2 | 1.39 (0.34–5.62) | |
| Q4 (0.27–0.31) | 68,134 | 789 | 11.6 | 2.22 (1.96–2.52) | 259 | 30 | 115.8 | 1.69 (0.40–7.09) | |
| Q5 (≥0.32) | 69,580 | 354 | 5.1 | 1.00 (reference) | 30 | 2 | 66.5 | 1.00 (reference) | |
| p–trend | <0.001 | <0.001 | |||||||
| Per 0.1 decrease in SV ratio | 2.77 (2.65–2.90) | 1.50 (1.32–1.69) | <0.001 | ||||||
Note: The mean SV ratio in each quintile among men: Q1, 0.23; Q2, 0.29; Q3, 0.33; Q4, 0.40; and Q5, 0.63. The mean SV ratio in each quintile among women: Q1, 0.17; Q2, 0.21; Q3, 0.25; Q4, 0.29; and Q5, 0.40.
Estimated from Cox proportional hazard models. Multivariable model was adjusted for age, center, year of screening exam, alcohol consumption, smoking, physical activity, total energy intake, education level, medication for hyperlipidemia, history of diabetes (only for HS plus intermediate‐to‐high FIB‐4), and history of hypertension.
p value for interaction.
The inverse association between SV ratio and NAFLD was much stronger in nonobese women than in obese women (p–interaction < 0.001). Importantly, all of these associations were consistently observed when BMI was replaced by WC as a measure of abdominal obesity (Table S11). In additional analyses stratified using re‐categorization including “lean,” “overweight,” and “obese,” the association between the low SV ratio and risk of NAFLD was most pronounced in lean individuals with BMI of < 23 kg/m2 (Table S12).
The association between SV ratio and the risk of incident NAFLD with intermediate/high FIB‐4 (or NFS score) was statistically significant only in nonobese participants, and the associations were consistently observed in nonobese participants grouped by WC instead of BMI (Tables S13–S16). Due to a small number of outcomes within the highest (fifth) SV ratio quintile in women with obesity or abdominal obesity, the fourth quintile was used as the reference group. Among women, the association between SV ratio and NAFLD tended to be stronger in premenopausal women than in postmenopausal women, but without significant interaction by menopausal status (Table S17).
DISCUSSION
Our findings show that in a retrospective cohort study of >150,000 adults with over half a million person‐years of follow‐up, low SV ratio was an independent risk factor for developing incident NAFLD during the follow‐up period (both overall NAFLD and NAFLD with increased levels of liver fibrosis markers). Interestingly, our data show that the inverse association between SV ratio and NAFLD was stronger in women than in men, and in nonobese than in obese participants, and the association between SV ratio and NAFLD was significantly modified by sex and obesity. Low SV ratio is a complementary index to conventional adiposity measures in the evaluation of NAFLD risk. These associations persisted even after adjustment for either BMI or WC or when adjusted for changes in potential confounders during follow‐up, as time‐varying covariates. Importantly, the time‐dependent analyses take account of any potential change in status of SV ratio or other key covariates, between baseline and follow‐up.
In analyses assessing the incremental predictive ability after adding the SV ratio to conventional adiposity indices (either BMI or WC), the addition of the SV ratio consistently showed a significant, although modest, improvement in the AUROC, NRI and IDI, compared with the base model based on age and conventional adiposity measures. Thus, the SV ratio may be a complementary index that adds to conventional adiposity measures in the evaluation of NAFLD risk, and this finding needs to be tested further in other cohorts and in different ethnic groups.
Recent cross‐sectional and longitudinal studies have shown a positive association between low skeletal muscle mass and NAFLD risk,[ 10 , 30 , 31 ] focusing on ASM adjusted for proxy indicators of obesity, such as BMI or body weight, without considering visceral adiposity.
SV ratio combines two body composition measures, ASM and VFA, and can be used to identify sarcopenic visceral obesity. Several studies have evaluated the association between SV ratio and NAFLD.[ 25 , 32 , 33 , 34 ] However, previous studies have had at least one of the following limitations: cross‐sectional study design; use of proxy measures for diagnosing NAFLD, such as fatty liver index or hepatic steatosis index (rather than liver biopsy or liver imaging); lack of adjustment for potential confounders, including BMI or WC; or lack of consideration of effect modification by sex or obesity.
In our study, the relative impact of the SV ratio on the risk of NAFLD was more pronounced in women than in men, although the absolute incidence of NAFLD was much lower in women than in men. Women, especially premenopausal women, tend to have metabolically more favorable fat distribution, such as more fat in the gluteofemoral region and subcutaneous area, whereas fat is predominantly stored in the visceral area in men.[ 35 , 36 ] Additionally, the amount of skeletal muscle mass in women was lower than that in men.[ 37 ] Proxy measures of overall adiposity, such as BMI, may not be particularly useful as a measure of metabolic risk in women. We suggest that better differentiation between fat and lean mass is needed in women. Measures such as sarcopenic visceral obesity may be helpful as a measure of metabolic risk in women. Further research using detailed phenotyping of fat distribution and measurement of skeletal muscle mass will help us understand the differential effect of SV ratio on NAFLD risk between men and women.
Furthermore, in our study, the independent and inverse association between SV ratio and NAFLD risk was much stronger among nonobese participants than among obese participants, with the strongest association seen in lean individuals with BMI < 23 kg/m2. These findings were consistently observed even when the changes in SV ratio, BMI, and other confounders over time were treated as time‐varying covariates, suggesting that obesity is an effect modifier of the association between the SV ratio and NAFLD risk. Potential contributory factors include that lean subjects with NAFLD who have been identified by BMI might also include people with an unfavorable combination of excess abdominal adipose tissue, decreased protective fat tissue, and low levels of skeletal muscle mass. Indeed, although NAFLD is strongly associated with overall and central obesity, it also occurs in nonobese subjects, with approximately 40% of the global NAFLD population being classified as nonobese.[ 38 ] Nonobese subjects with NAFLD also show higher all‐cause mortality, and mortality due to CVD and liver disease, than obese individuals with NAFLD.[ 38 ] Further research using detailed fat distribution phenotyping and skeletal muscle mass measurement will be helpful in understanding the differential effect of SV ratio on risk of NAFLD in men and women, and between nonobese and obese individuals.
Several plausible mechanisms may explain the concurrent roles of skeletal muscle and visceral fat mass in the risk of NAFLD, including insulin resistance (previously described) and inflammation. The skeletal muscle is capable of secreting myokines, such as myostatin and irisin, which are involved in oxidative stress and inflammation.[ 12 ] Dysregulation of these myokines may promote liver injury by increasing insulin resistance and oxidative stress.[ 39 ] Visceral adipose tissue macrophages produce proinflammatory cytokines, such as interleukin‐6 (IL‐6), and tumor necrosis factor α, which are correlated with muscle atrophy, and may increase the risk of NAFLD progression.[ 40 ] Moreover, cytokines such as IL‐6, which are produced by inflamed adipose tissue, may further increase muscle wasting and exacerbate the situation in chronic inflammatory states.[ 41 ]
Despite these findings, our study has certain limitations. First, BIA could overestimate fat‐free mass and underestimate fat mass in obese elderly populations.[ 20 ] BIA may also be affected by certain factors, such as fluid status, pregnancy, and malnutrition.[ 42 ] The hydration status of the study participants was not determined before the body composition assessment. All participants performed an overnight fast of ≥10 h before the BIA measurements, because fasting blood samples were collected at this time. Women in our study were supposed to be nonpregnant to be eligible for a comprehensive health screening test that included imaging studies. However, any inaccuracy in the BIA assessment would be universally applicable to all participants in the study. The results of this study might not be generalizable to other adult populations with extreme body weight and abnormal hydration status. Second, we used liver ultrasound and liver fibrosis index (NFS and FIB‐4) in our analyses. It was neither feasible nor ethical to obtain histological data on liver steatosis and fibrosis from liver biopsies of this occupational cohort of relatively healthy participants. The noninvasive diagnosis of the fatty liver using ultrasonography and liver fibrosis indices has been validated with acceptable accuracy and reproducibility and has been widely used in population‐based studies.[ 28 , 43 ] Third, the relatively short follow‐up time (median of 3.7 years) precluded an evaluation of advanced fibrosis (FIB‐4 ≥ 2.67 or NFS > 0.676) due to small case numbers. Considering that the natural history of fibrosis progression in patients with NAFLD has a long duration of 14.3 (95% CI, 9.1–50.0) years in one stage of fibrosis progression for patients with NAFLD,[ 44 ] future studies with longer follow‐up durations are needed to determine the risk of NAFLD with high fibrosis score, a more severe form of NAFLD, according to the SV ratio. Fourth, in our study, dietary intake was assessed using a 103‐item self‐administered food frequency questionnaire (FFQ) reflective of usual food intake over the past year that was developed and validated for use in South Korea.[ 45 ] Additionally, seasonings and oils, typically included in Korean diet, are not considered in this FFQ, which tends to underestimate total calorie intake compared with that in dietary records, the reference standard[ 45 ]; thus, we cannot exclude measurement errors in the dietary assessments. Fifth, data on myokine and adipokine levels were not available, although dysregulation of the myokines and adipokines may contribute to liver injury by chronic inflammation.[ 13 , 39 ] Future studies with a detailed assessment of myokine and adipokine levels may help elucidate the mechanism underlying the association between SV ratio and NAFLD. Finally, our study population consisted of healthy middle‐aged adults of Korean ethnicity, who had good access to health care facilities; therefore, the generalizability of our findings to other ethnic groups needs to be tested.
In conclusion, we have identified that low SV ratio is an independent risk factor for developing NAFLD. Notably, low SV ratio was a stronger risk factor for NAFLD in women than in men and was a much stronger risk factor in nonobese (especially, lean) than in obese participants. This association was independent of BMI, WC, time‐varying covariates (that take into account change in status between baseline and follow‐up), and other potential confounders, such as physical activity, in a large Korean cohort. Low SV ratio is a complementary index that adds to conventional adiposity measures in the evaluation of NAFLD risk. Future studies with consideration of effect modification by sex and obesity are needed to examine whether similar findings exist in other ethnic groups.
AUTHOR CONTRIBUTIONS
Study design and implementation, including quality assurance and control: Yoosun Cho, Yoosoo Chang, Seungho Ryu, and Christopher D. Byrne. Data analysis and analytic strategy design: Seungho Ryu. Field activity supervision: Hyun‐Suk Jung and Seungho Ryu. Manuscript draft: Yoosun Cho and Yoosoo Chang. All authors interpreted the results and contributed to critical revisions of the manuscript. All authors approved the final version of this manuscript.
CONFLICT OF INTEREST
SW advises for Gilead.
Supporting information
Appendix S1 Supporting Information
ACKNOWLEDGMENT
We thank our staff members at the Kangbuk Samsung Health Study for their hard work, dedication, and continuing support. This study was supported by the SKKU Excellence in Research Award Research Fund, Sungkyunkwan University, 2020, and by the National Research Foundation of Korea, funded by the Ministry of Science, ICT & Future Planning (NRF‐2021R1A2C1012626). CDB is supported in part by the Southampton National Institute for Health Research Biomedical Research Center (IS‐BRC‐20004), UK.
Cho Y, Chang Y, Ryu S, Jung H‐S, Kim C‐w, Oh H, Skeletal muscle mass to visceral fat area ratio as a predictor of NAFLD in lean and overweight men and women with effect modification by sex. Hepatol Commun. 2022;6:2238–2252. 10.1002/hep4.1975
Contributor Information
Yoosoo Chang, Email: yoosoo.chang@gmail.com.
Seungho Ryu, Email: sh703.yoo@gmail.com.
DATA AVAILABILITY STATEMENT
The data are not publicly available outside of the hospital because of institutional review board restrictions (the data were not collected in a way that could be distributed widely). However, the analytical methods are available from the corresponding author upon request.
REFERENCES
- 1. Younossi ZM, Koenig AB, Abdelatif D, Fazel Y, Henry L, Wymer M. Global epidemiology of nonalcoholic fatty liver disease—meta‐analytic assessment of prevalence, incidence, and outcomes. Hepatology. 2016;64:73–84. [DOI] [PubMed] [Google Scholar]
- 2. Byrne CD, Targher G. NAFLD: a multisystem disease. J Hepatol. 2015;62:S47–64. [DOI] [PubMed] [Google Scholar]
- 3. Byrne CD, Targher G. NAFLD as a driver of chronic kidney disease. J Hepatol. 2020;72:785–801. [DOI] [PubMed] [Google Scholar]
- 4. Mantovani A, Petracca G, Beatrice G, Tilg H, Byrne CD, Targher G. Non‐alcoholic fatty liver disease and increased risk of incident extrahepatic cancers: a meta‐analysis of observational cohort studies. Gut. 2021;70:962–9. [DOI] [PubMed] [Google Scholar]
- 5. Mantovani A, Csermely A, Petracca G, Beatrice G, Corey KE, Simon TG, et al. Non‐alcoholic fatty liver disease and risk of fatal and non‐fatal cardiovascular events: an updated systematic review and meta‐analysis. Lancet Gastroenterol Hepatol. 2021;6:903–13. [DOI] [PubMed] [Google Scholar]
- 6. Chalasani N, Younossi Z, Lavine JE, Charlton M, Cusi K, Rinella M, et al. The diagnosis and management of nonalcoholic fatty liver disease: practice guidance from the American Association for the Study of Liver Diseases. Hepatology. 2018;67:328–57. [DOI] [PubMed] [Google Scholar]
- 7. Jakobsen MU, Berentzen T, Sorensen TI, Overvad K. Abdominal obesity and fatty liver. Epidemiol Rev. 2007;29:77–87. [DOI] [PubMed] [Google Scholar]
- 8. Fabbrini E, Sullivan S, Klein S. Obesity and nonalcoholic fatty liver disease: biochemical, metabolic, and clinical implications. Hepatology. 2010;51:679–89. [DOI] [PMC free article] [PubMed] [Google Scholar]
- 9. Shuster A, Patlas M, Pinthus JH, Mourtzakis M. The clinical importance of visceral adiposity: a critical review of methods for visceral adipose tissue analysis. Br J Radiol. 2012;85:1–10. [DOI] [PMC free article] [PubMed] [Google Scholar]
- 10. Cai C, Song X, Chen Y, Chen X, Yu C. Relationship between relative skeletal muscle mass and nonalcoholic fatty liver disease: a systematic review and meta‐analysis. Hepatol Int. 2020;14:115–26. [DOI] [PMC free article] [PubMed] [Google Scholar]
- 11. Klip A, Paquet MR. Glucose transport and glucose transporters in muscle and their metabolic regulation. Diabetes Care. 1990;13:228–43. [DOI] [PubMed] [Google Scholar]
- 12. Severinsen MCK, Pedersen BK. Muscle‐organ crosstalk: the emerging roles of myokines. Endocr Rev. 2020;41:594–609. [DOI] [PMC free article] [PubMed] [Google Scholar]
- 13. Mirza MS. Obesity, visceral fat, and NAFLD: querying the role of adipokines in the progression of nonalcoholic fatty liver disease. ISRN Gastroenterol. 2011;2011:592404. [DOI] [PMC free article] [PubMed] [Google Scholar]
- 14. Batsis JA, Villareal DT. Sarcopenic obesity in older adults: aetiology, epidemiology and treatment strategies. Nat Rev Endocrinol. 2018;14:513–37. [DOI] [PMC free article] [PubMed] [Google Scholar]
- 15. Alalwan TA. Phenotypes of sarcopenic obesity: exploring the effects on peri‐muscular fat, the obesity paradox, hormone‐related responses and the clinical implications. Geriatrics (Basel). 2020;5:8. [DOI] [PMC free article] [PubMed] [Google Scholar]
- 16. Kim TN, Park MS, Lim KI, Yang SJ, Yoo HJ, Kang HJ, et al. Skeletal muscle mass to visceral fat area ratio is associated with metabolic syndrome and arterial stiffness: The Korean Sarcopenic Obesity Study (KSOS). Diabetes Res Clin Pract. 2011;93:285–91. [DOI] [PubMed] [Google Scholar]
- 17. Wang Q, Zheng D, Liu J, Fang L, Li Q. Skeletal muscle mass to visceral fat area ratio is an important determinant associated with type 2 diabetes and metabolic syndrome. Diabetes Metab Syndr Obes. 2019;12:1399–407. [DOI] [PMC free article] [PubMed] [Google Scholar]
- 18. Chang Y, Ryu S, Sung KC, Cho YK, Sung E, Kim HN, et al. Alcoholic and non‐alcoholic fatty liver disease and associations with coronary artery calcification: evidence from the Kangbuk Samsung Health Study. Gut. 2019;68:1667–75. [DOI] [PubMed] [Google Scholar]
- 19. Craig CL, Marshall AL, Sjostrom M, Bauman AE, Booth ML, Ainsworth BE, et al. International physical activity questionnaire: 12‐country reliability and validity. Med Sci Sports Exerc. 2003;35:1381–95. [DOI] [PubMed] [Google Scholar]
- 20. Ling CH, de Craen AJ, Slagboom PE, Gunn DA, MPM S, RGJ W, et al. Accuracy of direct segmental multi‐frequency bioimpedance analysis in the assessment of total body and segmental body composition in middle‐aged adult population. Clin Nutr. 2011;30:610–5. [DOI] [PubMed] [Google Scholar]
- 21. Kyle UG, Genton L, Hans D, Pichard C. Validation of a bioelectrical impedance analysis equation to predict appendicular skeletal muscle mass (ASMM). Clin Nutr. 2003;22:537–43. [DOI] [PubMed] [Google Scholar]
- 22. Yang SW, Kim TH, Choi HM. The reproducibility and validity verification for body composition measuring devices using bioelectrical impedance analysis in Korean adults. J Exerc Rehabil. 2018;14:621–7. [DOI] [PMC free article] [PubMed] [Google Scholar]
- 23. Orkin S, Yodoshi T, Romantic E, Hitchcock K, Arce‐Clachar AC, Bramlage K, et al. Body composition measured by bioelectrical impedance analysis is a viable alternative to magnetic resonance imaging in children with nonalcoholic fatty liver disease. JPEN J Parenter Enteral Nutr. 2021;46:378–84. [DOI] [PMC free article] [PubMed] [Google Scholar]
- 24. Ogawa H, Fujitani K, Tsujinaka T, Imanishi K, Shirakata H, Kantani A, et al. InBody 720 as a new method of evaluating visceral obesity. Hepatogastroenterology. 2011;58:42–4. [PubMed] [Google Scholar]
- 25. Shida T, Akiyama K, Oh S, Sawai A, Isobe T, Okamoto Y, et al. Skeletal muscle mass to visceral fat area ratio is an important determinant affecting hepatic conditions of non‐alcoholic fatty liver disease. J Gastroenterol. 2018;53:535–47. [DOI] [PubMed] [Google Scholar]
- 26. Mathiesen UL, Franzen LE, Aselius H, Resjö M, Jacobsson L, Foberg U, et al. Increased liver echogenicity at ultrasound examination reflects degree of steatosis but not of fibrosis in asymptomatic patients with mild/moderate abnormalities of liver transaminases. Dig Liver Dis. 2002;34:516–22. [DOI] [PubMed] [Google Scholar]
- 27. Angulo P, Hui JM, Marchesini G, Bugianesi E, George J, Farrell GC, et al. The NAFLD fibrosis score: a noninvasive system that identifies liver fibrosis in patients with NAFLD. Hepatology. 2007;45:846–54. [DOI] [PubMed] [Google Scholar]
- 28. Shah AG, Lydecker A, Murray K, Tetri BN, Contos MJ, Sanyal AJ, et al. Comparison of noninvasive markers of fibrosis in patients with nonalcoholic fatty liver disease. Clin Gastroenterol Hepatol. 2009;7:1104–12. [DOI] [PMC free article] [PubMed] [Google Scholar]
- 29. World Health Organization, Regional Office for the Western Pacific . The Asia‐Pacific Perspective: Redefining Obesity and Its Treatment. Sydney, Australia: Health Communications Australia; 2000. [Google Scholar]
- 30. Kim G, Lee SE, Lee YB, Jun JE, Ahn J, Bae JC, et al. Relationship between relative skeletal muscle mass and nonalcoholic fatty liver disease: a 7‐year longitudinal study. Hepatology. 2018;68:1755–68. [DOI] [PubMed] [Google Scholar]
- 31. Koo BK, Kim D, Joo SK, Kim JH, Chang MS, Kim BG, et al. Sarcopenia is an independent risk factor for non‐alcoholic steatohepatitis and significant fibrosis. J Hepatol. 2017;66:123–31. [DOI] [PubMed] [Google Scholar]
- 32. Moon JS, Yoon JS, Won KC, Lee HW. The role of skeletal muscle in development of nonalcoholic Fatty liver disease. Diabetes Metab J. 2013;37:278–85. [DOI] [PMC free article] [PubMed] [Google Scholar]
- 33. Su X, Xu J, Zheng C. The relationship between non‐alcoholic fatty liver and skeletal muscle mass to visceral fat area ratio in women with type 2 diabetes. BMC Endocr Disord. 2019;19:76. [DOI] [PMC free article] [PubMed] [Google Scholar]
- 34. Shida T, Oshida N, Oh S, Okada K, Shoda J. Progressive reduction in skeletal muscle mass to visceral fat area ratio is associated with a worsening of the hepatic conditions of non‐alcoholic fatty liver disease. Diabetes Metab Syndr Obes. 2019;12:495–503. [DOI] [PMC free article] [PubMed] [Google Scholar]
- 35. Karpe F, Pinnick KE. Biology of upper‐body and lower‐body adipose tissue—link to whole‐body phenotypes. Nat Rev Endocrinol. 2015;11:90–100. [DOI] [PubMed] [Google Scholar]
- 36. Pinnick KE, Nicholson G, Manolopoulos KN, McQuaid SE, Valet P, Frayn KN, et al. Distinct developmental profile of lower‐body adipose tissue defines resistance against obesity‐associated metabolic complications. Diabetes. 2014;63:3785–97. [DOI] [PubMed] [Google Scholar]
- 37. Stevens J, Katz EG, Huxley RR. Associations between gender, age and waist circumference. Eur J Clin Nutr. 2010;64:6–15. [DOI] [PMC free article] [PubMed] [Google Scholar]
- 38. Ye Q, Zou B, Yeo YH, Li J, Huang DQ, Wu Y, et al. Global prevalence, incidence, and outcomes of non‐obese or lean non‐alcoholic fatty liver disease: a systematic review and meta‐analysis. Lancet Gastroenterol Hepatol. 2020;5:739–52. [DOI] [PubMed] [Google Scholar]
- 39. Bhanji RA, Narayanan P, Allen AM, Malhi H, Watt KD. Sarcopenia in hiding: the risk and consequence of underestimating muscle dysfunction in nonalcoholic steatohepatitis. Hepatology. 2017;66:2055–65. [DOI] [PubMed] [Google Scholar]
- 40. Boutari C, Perakakis N, Mantzoros CS. Association of adipokines with development and progression of nonalcoholic fatty liver disease. Endocrinol Metab (Seoul). 2018;33:33–43. [DOI] [PMC free article] [PubMed] [Google Scholar]
- 41. Munoz‐Canoves P, Scheele C, Pedersen BK, Serrano AL. Interleukin‐6 myokine signaling in skeletal muscle: a double‐edged sword? FEBS J. 2013;280:4131–48. [DOI] [PMC free article] [PubMed] [Google Scholar]
- 42. Buchholz AC, Bartok C, Schoeller DA. The validity of bioelectrical impedance models in clinical populations. Nutr Clin Pract. 2004;19:433–46. [DOI] [PubMed] [Google Scholar]
- 43. Hernaez R, Lazo M, Bonekamp S, Kamel I, Brancati FL, Guallar E, et al. Diagnostic accuracy and reliability of ultrasonography for the detection of fatty liver: a meta‐analysis. Hepatology. 2011;54:1082–90. [DOI] [PMC free article] [PubMed] [Google Scholar]
- 44. Singh S, Allen AM, Wang Z, Prokop LJ, Murad MH, Loomba R. Fibrosis progression in nonalcoholic fatty liver vs nonalcoholic steatohepatitis: a systematic review and meta‐analysis of paired‐biopsy studies. Clin Gastroenterol Hepatol. 2015;13:643–54 e1–e9; quiz e39–e40. [DOI] [PMC free article] [PubMed] [Google Scholar]
- 45. Ahn Y, Kwon E, Shim JE, Park MK, Joo Y, Kimm K, et al. Validation and reproducibility of food frequency questionnaire for Korean genome epidemiologic study. Eur J Clin Nutr. 2007;61:1435–41. [DOI] [PubMed] [Google Scholar]
Associated Data
This section collects any data citations, data availability statements, or supplementary materials included in this article.
Supplementary Materials
Appendix S1 Supporting Information
Data Availability Statement
The data are not publicly available outside of the hospital because of institutional review board restrictions (the data were not collected in a way that could be distributed widely). However, the analytical methods are available from the corresponding author upon request.