

Abstract
Lipophilic but not hydrophilic statins have been shown to be associated with reduced risk for hepatocellular carcinoma (HCC) in patients with chronic viral hepatitis. We investigated differential actions of lipophilic and hydrophilic statins and their ability to modulate a clinical prognostic liver signature (PLS) predicting HCC risk in patients with liver disease. Hepatitis C virus (HCV)–infected Huh7.5.1 cells, recently developed as a model to screen HCC chemopreventive agents, were treated with lipophilic statins (atorvastatin and simvastatin) and hydrophilic statins (rosuvastatin and pravastatin), and then analyzed by RNA sequencing and PLS. Lipophilic statins, particularly atorvastatin, more significantly suppressed the HCV‐induced high‐risk pattern of PLS and genes in YAP and AKT pathway implicated in fibrogenesis and carcinogenesis, compared with the hydrophilic statins. While atorvastatin inhibited YAP activation through the mevalonate pathway, the distinctive AKT inhibition of atorvastatin was mediated by stabilizing truncated retinoid X receptor alpha, which has been known to enhance AKT activation, representing a target for HCC chemoprevention. In addition, atorvastatin modulated the high‐risk PLS in an in vitro model of nonalcoholic fatty liver disease (NAFLD). Conclusion: Atorvastatin distinctively inhibits YAP and AKT activation, which are biologically implicated in HCC development, and attenuates a high‐risk PLS in an in vitro model of HCV infection and NAFLD. These findings suggest that atorvastatin is the most potent statin to reduce HCC risk in patients with viral and metabolic liver diseases.
Atorvastatin suppresses HCC risk gene signature through modulation of YAP/AKT/metallothionein pathways.
![]()
INTRODUCTION
Hepatitis C virus (HCV) infection is the major etiology of hepatocellular carcinoma (HCC) in the United States and Europe; 25% of HCC cases worldwide are attributable to chronic HCV infection.[ 1 ] The risk of HCC in patients with HCV infection is estimated to be 15‐fold to 20‐fold higher than in the uninfected population.[ 2 ] Approximately 20% of the patients with chronic HCV infection develop cirrhosis within 20–30 years, and once cirrhosis is established, the rate of HCC development is 1%–4% annually.[ 3 ] Several large cohort studies demonstrated that direct‐acting antiviral agents (DAAs), which have been reported to achieve sustained virologic response in over 95% of patients with HCV infection, reduce the risk of de novo HCC. However, the risk of HCC after HCV clearance with DAA treatment, while reduced overall, remains elevated in patients with advanced liver disease.[ 4 , 5 ] Therefore, effective strategies to prevent HCV‐associated HCC are still needed.[ 6 ]
Statins, 3‐hydroxy‐3‐methylglutaryl coenzyme A (HMG‐CoA) reductase inhibitors, are effective cholesterol‐lowering agents commonly used to treat dyslipidemia. Statins also appear to have beneficial effects on liver diseases, mediated by their pleiotropic effects on inflammation, fibrogenesis, and carcinogenesis.[ 7 ] A recent meta‐analysis has demonstrated the chemopreventive effect of statins against HCC, which is more pronounced with lipophilic statins.[ 8 ] Our group has demonstrated that lipophilic but not hydrophilic statins have been associated with decreased rates of cirrhosis and HCC in patients with chronic HCV and hepatitis B virus (HBV) infection.[ 9 , 10 ] However, the differential actions between lipophilic statins and hydrophilic statins have not been well studied. A small number of studies have investigated the differential effect of lipophilic and hydrophilic statins on cancer cell growth[ 11 , 12 ] but not in HCC. It is unclear whether the lipophilicity of statins, which is associated with differential cellular uptake, is the key factor in the differential chemopreventive effect or whether there are other (as of yet) undiscovered mechanisms of lipophilic statins.
This study was designed to confirm the chemopreventive effect of lipophilic statins compared with hydrophilic statins in an in vitro model with HCV infection and to identify a mechanism for the differential effect of lipophilic statins. To normalize the biochemical effect of statins, we normalized the concentration of statins to their effect on intracellular low‐density lipoprotein (LDL) cholesterol levels. To evaluate the chemopreventive effect of statins, we used a validated prognostic liver signature (PLS), an 186‐gene signature shown to predict long‐term risk of liver disease progression for HCC in patients across etiologies of chronic liver disease, including HCV infection,[ 13 , 14 ] and for which a cell culture model for high‐risk signature generation has been demonstrated by Crouchet et al.[ 15 ] We then compared the effects of lipophilic and hydrophilic statins on HCV‐infected Huh7.5.1 cells through RNA sequencing (RNA‐seq) and subsequently investigated the signaling pathway differentially affected by lipophilic statins.
METHODS
Induction of the PLS by HCV infection in Huh7.5.1 cells
The hepatocyte‐derived HCC cell line, Huh7.5.1 cells, were cultured in Dulbecco's modified Eagle medium (Invitrogen, Foster City, CA) supplemented with 10% fetal bovine serum (FBS) (Invitrogen) and 1% penicillin/streptomycin (Invitrogen) at 37°C in the presence of 5% CO2 unless otherwise specified. A total of 4.5 × 10⁶ Huh7.5.1 cells were seeded in a T75 flask and cultured for 4 h, and then incubated with infectious HCV clone Jc1FLAG2(p7‐nsGluc2A) expressing Gaussia luciferase (multiplicity of infection = 1) for 4 h. The cells with Jc1 were washed and cultured in fresh medium for 8 days.
Statin treatment
After 8 days of HCV infection, 2 × 10⁵ HCV‐infected Huh7.5.1 cells were seeded in 6‐well plates and then treated with atorvastatin (50 μΜ), simvastatin (100 μM), rosuvastatin (50 μM), and pravastatin (500 μM) (Sigma, St. Louis, MO) for 2 days in the presence or absence of geranyl‐geranyl pyrophosphate (Sigma). At the end of treatment, intracellular LDL cholesterol levels, cell viability, and HCV infectivity were evaluated by Human LDL C ELISA kit (MyBioSource, San Diego, CA), CellTiter‐Glo Luminescent Cell Viability Assay (Promega, Madison, WA), and Renilla Luciferase Assay System (Promega), respectively, following the manufacturer's protocol.
RNA‐seq
Total RNA was extracted using the RNeasy mini kit (Qiagen, Hilden, Germany) following the manufacturer's protocol. RNA‐seq libraries were sequenced on Illumina HiSeq instruments, resulting in approximately 30 million reads per sample. The STAR aligner was used to map sequencing reads to transcriptome in the homo sapiens hg19 reference genome.[ 16 ] Read counts for individual genes were produced using the unstranded count function in HTSeq v.0.6.0,[ 17 ] followed by the estimation of expression values and detection of differentially expressed transcripts using EdgeR and including only the genes with count per million reads > 1 for one or more samples.[ 18 , 19 ] Differentially expressed genes were defined by at least 2‐fold change with false discovery rate < 0.01. The Database for Annotation, Visualization, and Integrated Discovery (DAVID; https://david.ncifcrf.gov/) was used to analyze the functions and signaling pathways of the differentially expressed genes (DEGs). Biological processes that DEGs were involved in were identified through gene ontology (GO) analysis in DAVID with a cutoff adjusted p value < 0.05. For Gene‐Set Enrichment Analysis (GSEA), DEGs modulated by each statin were ranked by fold change, and then the enrichment of DEGs in the gene set (YAP‐related genes up‐regulated by HCV infection) were calculated by GSEAPreranked analysis of GSEA software.
PLS score
Experimental modulation of the PLS was quantitatively measured as a PLS score as follows. For each sample in the expression data set, nearest template prediction (NTP)[ 20 ] was performed to determine prognostic risk level based on the PLS gene‐expression profiles as previously described,[ 21 ] and a PLS score was calculated as − log 10(NTP prediction p value) × (+ 1 for high risk prediction; − 1 for low risk prediction).
Reactive oxygen species measurement
Intracellular reactive oxygen species (ROS) were measured using a DCFDA cellular ROS detection assay kit (Abcam, Cambridge, MA) following the manufacturer's protocol. Briefly, 2 × 10⁴ HCV‐infected Huh7.5.1 cells were seeded in 96‐well microplate and treated with statins for 2 days in the presence or absence of N‐acetylcysteine (Sigma). The cells were then incubated with DCFDA solution for 45 min at 37°C in the dark. The microplate was immediately read on a fluorescence plate reader at excitation/emission = 485/535 nm.
Retinoid X receptor alpha knock‐down
We followed Santa Cruz small interfering RNA (siRNA) transfection protocol and used related reagents (Santa Cruz Biotechnology, Santa Cruz, CA). Briefly, 2 × 10⁵ HCV‐infected Huh7.5.1 cells were seeded in 6‐well plate with the medium supplemented with 10% FBS only. The cells were incubated with 1 ml of siRNA transfection reagent mixture containing retinoid X receptor alpha (RXR‐α) siRNA or control siRNA for 6 h. Then 1 ml of fresh medium supplemented with 20% FBS and 2% penicillin/streptomycin was added to each well and cultured for an additional 24 h. After washed, the cells were treated with statins for 1 day in the presence or absence of mevalonate (Sigma).
Quantitative reverse‐transcription polymerase chain reaction
Complementary DNA was synthesized from messenger RNA (mRNA) using the High‐Capacity cDNA Reverse Transcription Kit (Applied Biosystems, Foster City, CA) following the manufacturer's protocol. The mRNA expression levels were analyzed by quantitative reverse‐transcription polymerase chain reaction (PCR) with glyceraldehyde 3‐phosphate dehydrogenase (GAPDH) as a reference gene (Table S1), using PowerUP SYBR Green Master Mix (Thermo Fisher Scientific, Waltham, MA) and CFX Manager Software 3.1 (Bio‐Rad Laboratories, Hercules, CA) following the manufacturer's protocol.
Western blot
Proteins were extracted using a radio immunoprecipitation assay buffer (Boston Bioproducts, Worcester, MA), and electrophoresis was conducted using NuPAGE Bis‐Tris Mini Gels and related reagents (Thermo Fisher Scientific) following the manufacturer's protocol. After electrophoresis, the proteins were transferred to nitrocellulose membranes using the iBlot 2 Dry Blotting System (Thermo Fisher Scientific) following the manufacturer's protocol. After blocking with 5% skim milk for 1 h, the membranes were incubated with primary antibodies overnight at 4°C: GAPDH (#5174), YAP (#4912), phospho‐S397 YAP (#13619), AKT (#9272), phospho‐S473 AKT (#4060) from Cell Signaling Technology (Beverly, MA); phospho‐S127 YAP (ab76252) from Abcam (Cambridge, MA); and RXR‐α (sc‐515,929) from Santa Cruz. After washed, the membranes were incubated with secondary antibody for 1 h at room temperature: anti‐mouse horseradish peroxidase (HRP; sc‐516,102; Santa Cruz) for RXR‐α primary antibody, and anti‐rabbit HRP (#7074; Cell Signaling Technology) for the other primary antibodies. After washing, proteins of interest were detected using Clarity Western ECL Substrate (Bio‐Rad Laboratories).
Immunofluorescence
Cells were fixed with 4% paraformaldehyde for 15 min at 4°C. After washed, the cells were incubated in UltraCruz Blocking Reagent (sc‐516,214; Santa Cruz) supplemented with 0.1% Triton × −100 for 30 min at room temperature. Then, the cells were incubated with anti‐YAP1 antibody (sc‐376,830; Santa Cruz) overnight at 4°C. After 4´,6‐diamidino‐2‐phenylindole staining, YAP expression was observed by EVOS FL Cell Imaging System (Thermo Fisher Scientific).
In vitro model of NAFLD
Human primary hepatic stellate cells (pHSCs), isolated from human immunodeficiency virus/HBV/HCV‐free donor livers (Triangle Research Labs, Durham, NC), and Huh7 cells were used to generate Huh7/pHSC spheroids using the hanging drop method. Briefly, 10 μl medium drops consisting of 2 × 10⁴ Huh7 cells were laid on the inside surface of 100‐mm cell culture dish lid. The lid was inverted onto the bottom chamber filled with phosphate‐buffered saline. The cells were incubated at 37°C in the presence of 5% CO2. After 2 days, 10 μl medium drops consisting of 2 × 10⁴ pHSCs were added to each drop of Huh7 cells to form the outer layer of the spheroid. After 24 h, Huh7/pHSC spheroids had formed and were subsequently placed on a shaker at 350 rpm for 2 more days to take round shape. After the statin treatment in the presence of 400 μΜ Linoleic Acid‐Oleic Acid‐Albumin (Sigma) as described previously, the cells were subjected to quantitative reverse‐transcription PCR analysis of the expression of 11 genes (collagen type VI alpha 3 chain [COL6A3], immediate early response 3 [IER3], AE binding protein 1 [AEBP1], C‐C motif chemokine ligand 19 [CCL19], BAR/IMD domain containing adaptor protein 2 [BAIAP2], chitobiase [CTBS], ankyrin repeat domain 46 [ANKRD46], aldo‐keto reductase family 1 member D1 [AKR1D1], insulin like growth factor 1 [IGF1], thioredoxin 2 [TXN2], and transmembrane protein 97 [TMEM97]), reduced version of 186‐gene PLS[ 21 ] (Table S1a).
Statistics
Unless otherwise specified, bar graphs were displayed as means ± SEM, with experimental conditions compared by the Mann–Whitney U test and Kruskal‐Wallis test, with Dunn's multiple comparisons test for nonparametric data using Prism 9.0 (GraphPad Software Inc., San Diego, CA).
RESULTS
Statins decrease the PLS score in HCV‐infected Huh7.5.1 cells
Our group previously demonstrated that HCV infection successfully induces a high‐risk PLS in a human liver cell‐based system modeling a clinical PLS.[ 15 ] We confirmed the suppressive effect of statins on PLS by RNA‐seq in HCV‐infected Huh7.5.1 cells treated with lipophilic (atorvastatin, simvastatin) and hydrophilic (rosuvastatin, pravastatin) statins (Figure 1A). At the concentration of each statin that reduced intracellular LDL cholesterol to equivalent levels (Figure S1A), cell viability and HCV replication were not affected (Figure 1B–D). According to GO analysis of DEGs, HCV‐infected cells exhibited typical characteristics: up‐regulation of the interferon signaling pathway in response to viral infection, down‐regulation of cholesterol metabolism, and the unfolded protein response (Figure 1E). Finally, a high‐risk PLS score was induced by HCV infection, and statins attenuated this induction. In fact, atorvastatin significantly suppressed the PLS score to a level even lower than observed in uninfected cells (Figure 1F).
FIGURE 1.
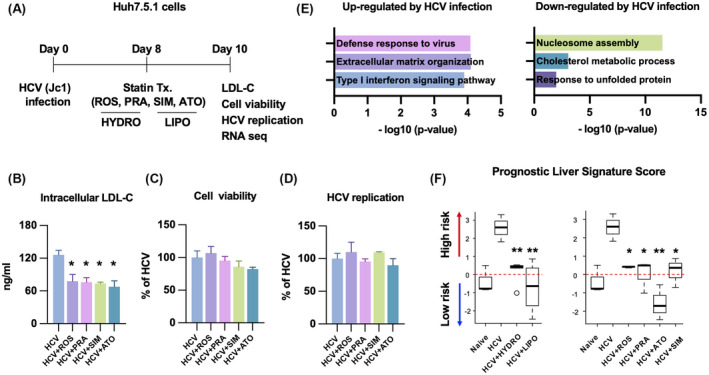
(A) Statins decrease the prognostic liver signature (PLS) score in hepatitis C virus (HCV)–infected Huh7.5.1 cells. Huh7.5.1 cells were infected with HCV (Jc1 at a multiplicity of infection of 1) for 8 days and treated with hydrophilic (rosuvastatin [ROS]: 50 μM; pravastatin [PRA]: 500 μM) and lipophilic (simvastatin [SIM]: 100 μM; atorvastatin [ATO]: 50 μM) statins for 2 days. Then, the cells were harvested for analysis: intracellular low‐density lipoprotein (LDL) cholesterol (B), cell viability (C), HCV replication (D), and RNA sequencing (RNA‐seq) (E,F) of each condition. (E) Gene ontology analysis of differentially expressed genes by HCV infection (fold change > 2; false discovery rate [FDR] < 0.01). (F) PLS score was calculated by gene‐set enrichment analysis and depicted as box and whiskers plots (*p < 0.05, **p < 0.01 compared with HCV).
Lipophilic statins differentially modulate specific genes
To assess the differential actions of statins, we identified DEGs modulated by lipophilic and hydrophilic statins, respectively, in HCV‐infected Huh7.5.1 cells. Sixty‐six genes were specifically modulated by lipophilic statins; 104 genes were commonly modulated by both sets of statins; and 110 genes were specifically modulated by hydrophilic statins (Figure 2A). As expected, genes involved in cholesterol and isoprenoid metabolism were commonly modulated by all statins, and other known statin‐regulated genes such as kruppel like factor 2 (KLF2), ras homolog family member B (RHOB), and dickkopf WNT signaling pathway inhibitor 1 (DKK1) were commonly regulated (Figure 2A,B). Hydrophilic statin–specific genes were involved in glucose metabolism and DNA replication (Figure 2C); these genes were similarly modulated by both hydrophilic statins. In contrast, lipophilic statin–specific genes were differentially modulated by lipophilic statins, particularly atorvastatin, compared with hydrophilic statins (Figure 2D). Among lipophilic statin–specific genes, down‐regulated genes were involved in cell differentiation, cell proliferation, fibrogenesis, and ROS metabolism; up‐regulated genes were involved in negative regulation of growth and steroid metabolism (Figure 2E). Among the genes down‐regulated by lipophilic statins, there were several YAP‐regulated genes (ankyrin repeat domain 1 [ANKRD1], ETS homologous factor [EHF], marker of proliferation Ki‐67 [MKI67], WT1 interacting protein [WTIP], cysteine rich angiogenic inducer 61 [CYR61], and connective tissue growth factor [CTGF]) and fibrogenic genes (collagen type I alpha 2 chain [COL1A2] and collagen type XII alpha 1 chain [COL12A1]) (Figure 2D).
FIGURE 2.
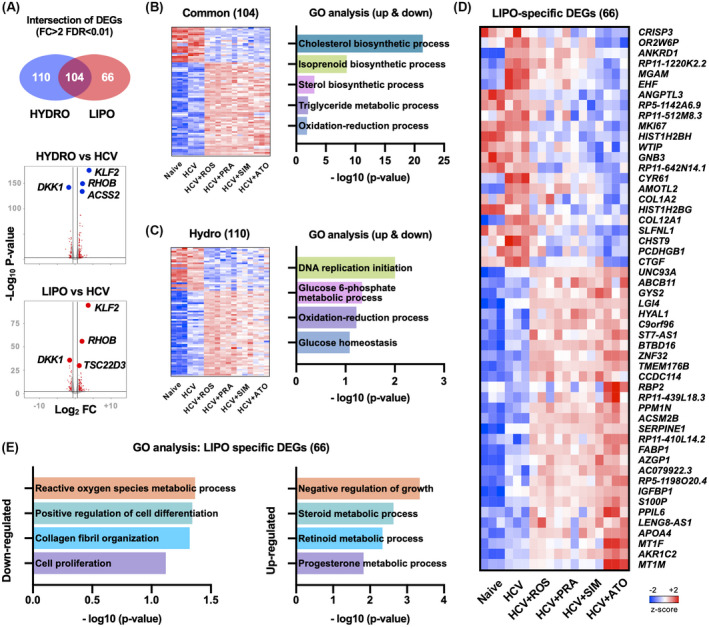
Differentially expressed genes (DEGs) modulated by hydrophilic and lipophilic statins. (A) Venn diagram and volcano plot of DEGs modulated by hydrophilic (HYDRO) and lipophilic (LIPO) statins. (B) Heatmap and gene ontology (GO) analysis of DEGs commonly modulated by both statins. (C) Heatmap and Gene Ontology (GO) analysis of hydrophilic statin‐specific DEGs. (D) Heatmap of lipophilic statin–specific DEGs. (E) GO analysis of lipophilic statin–specific DEGs. AGFG2, ArfGAP with FG repeats 2; AJUBA, ajuba LIM protein; ANKRD1, ankyrin repeat domain 1; ASAP1, ArfGAP with SH3 domain, ankyrin repeat and PH domain 1; BICC1, BicC family RNA binding protein 1; BIRC5, baculoviral IAP repeat containing 5; CDC20, cell division cycle 20; CDH1, cadherin 1; CDKN2C, cyclin dependent kinase inhibitor 2C; CENPF, centromere protein F; CNN3, calponin 3; CRIM1, cysteine rich transmembrane BMP regulator 1; DAAM1, dishevelled associated activator of morphogenesis 1; DAB2, DAB adaptor protein 2; DDAH1, dimethylarginine dimethylaminohydrolase 1; DLC1, DLC1 Rho GTPase activating protein; DUSP1, dual specificity phosphatase 1; DUSP12, dual specificity phosphatase 12; DUT, deoxyuridine triphosphatase; DYNLL1, dynein light chain LC8‐type 1; ECT2, epithelial cell transforming 2; EMP2, epithelial membrane protein 2; ETV5, ETS variant transcription factor 5; FGF2, fibroblast growth factor 2; FLNA, filamin A; FSCN1, fascin actin‐bundling protein 1; FSTL1, follistatin like 1; FZR1, fizzy and cell division cycle 20 related 1; GADD45B, growth arrest and DNA damage inducible beta; GAS6, growth arrest specific 6; GGH, gamma‐glutamyl hydrolase; GLI1, GLI family zinc finger 1; GLS, Glutaminase; GLS2, glutaminase 2; HEXB, hexosaminidase subunit beta; HMMR, hyaluronan mediated motility receptor; INHA, inhibin subunit alpha; ITGB5, integrin subunit beta 5; LATS2, large tumor suppressor kinase 2; MAPK13, mitogen‐activated protein kinase 13; MARCKS, myristoylated alanine rich protein kinase C substrate; MDFIC, MyoD family inhibitor domain containing; MST1, macrophage stimulating 1; MYC, MYC proto‐oncogene, bHLH transcription factor; NDRG1, N‐myc downstream regulated 1; NRP1, neuropilin 1; PCNA, proliferating cell nuclear antigen; PDLIM2, PDZ and LIM domain 2; PHGDH, phosphoglycerate dehydrogenase; PMP22, peripheral myelin protein 22; PTCH1, patched 1; PXMP2, peroxisomal membrane protein 2; SGK1, serum/glucocorticoid regulated kinase 1; SH2D4A, SH2 domain containing 4A; SHCBP1, SHC binding and spindle associated 1; SHH, sonic hedgehog signaling molecule; SLIT2, slit guidance ligand 2; SMO, smoothened, frizzled class receptor; SMOX, spermine oxidase; STK4, serine/threonine kinase 4; STMN1, stathmin 1; TAZ, tafazzin; TGFB2, transforming growth factor beta 2; TGM2, transglutaminase 2; THBS1, thrombospondin 1; TK1, thymidine kinase 1; TNS1, tensin 1; TOP2A, DNA topoisomerase II alpha; TSPAN3, tetraspanin 3; WWTR1, WW domain containing transcription regulator 1; YY1AP1, YY1 associated protein 1; ZYX, Zyxin.
Statins inhibit YAP activation through the mevalonate pathway
Statins, particularly atorvastatin, reduced YAP‐regulated gene expression that were up‐regulated by HCV infection (Figure 3A and Figures S1B,C and S2A,B). We evaluated the enrichment of the genes modulated by each statin among the set of YAP‐related genes up‐regulated by HCV infection. Both lipophilic and hydrophilic statins down‐regulated YAP‐regulated genes induced by HCV infection, although only atorvastatin did so in a statistically significant manner (Figure 3B). Statins have been known to decrease intracellular geranyl‐geranylpyrophosphate (GGPP), a product of the mevalonate pathway; GGPP deficiency in turn promotes YAP deactivation by increasing its phosphorylation[ 22 ] (Figure 3C). Atorvastatin increased S127 and S397 phosphorylation of YAP, which led to decreased nuclear translocation of YAP (Figure 3D,E) and suppressed the expression of the YAP target genes, CTGF and CYR61, in HCV‐infected Huh7.5.1 cells (Figure 2B). YAP inhibition was rescued by GGPP supplement, confirming that atorvastatin's inhibitory effect on YAP is dependent on the mevalonate pathway (Figure 3F).
FIGURE 3.
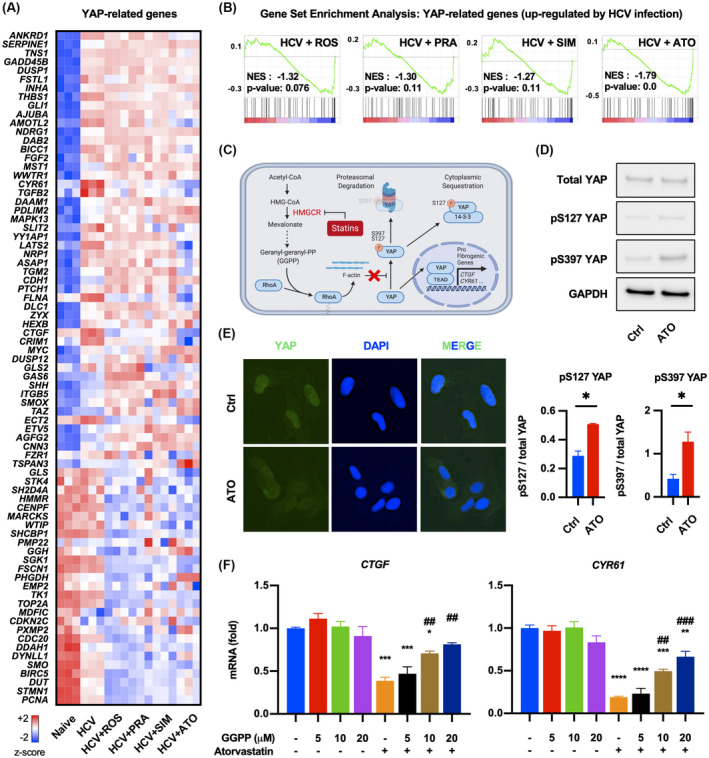
Statins inhibit YAP activation through mevalonate pathway. (A) Heatmap depicting expression of YAP‐related genes of each condition. (B) Gene set enrichment analysis of DEGs by each statin in YAP‐related genes up‐regulated by HCV infection. (C) Mechanism of YAP inhibition by statins through the mevalonate pathway. (D,E) HCV‐infected Huh7.5.1 cells were treated with 50 μM atorvastatin for 2 days and subjected to western blot and immunofluorescence (*p < 0.05 compared with control [Ctrl]). (F) HCV‐infected Huh7.5.1 cells were treated with 50 μM ATO for 2 days in the presence or absence of geranyl‐geranyl pyrophosphate (GGPP) (*p < 0.05, **p < 0.01, ***p < 0.001 compared with negative control [blue bar]; ##p < 0.01, ###p < 0.001 compared with only ATO‐treated condition [orange bar]). Data are presented as mean ± SEM of n = 3 independent experiments. AGFG2, ArfGAP with FG repeats 2; AJUBA, ajuba LIM protein; ANKRD1, ankyrin repeat domain 1; ASAP1, ArfGAP with SH3 domain, ankyrin repeat and PH domain 1; BICC1, BicC family RNA binding protein 1; BIRC5, baculoviral IAP repeat containing 5; CDC20, cell division cycle 20; CTGF, connective tissue growth factor; CDH1, cadherin 1; CDKN2C, cyclin dependent kinase inhibitor 2C; CENPF, centromere protein F; CNN3, calponin 3; CRIM1, cysteine rich transmembrane BMP regulator 1; DAAM1, dishevelled associated activator of morphogenesis 1; DAB2, DAB adaptor protein 2; DAPI, 4´,6‐diamidino‐2‐phenylindole; DDAH1, dimethylarginine dimethylaminohydrolase 1; DLC1, DLC1 Rho GTPase activating protein; DUSP1, dual specificity phosphatase 1; DUSP12, dual specificity phosphatase 12; DUT, deoxyuridine triphosphatase; DYNLL1, dynein light chain LC8‐type 1; ECT2, epithelial cell transforming 2; EMP2, epithelial membrane protein 2; ETV5, ETS variant transcription factor 5; FGF2, fibroblast growth factor 2; FLNA, filamin A; FSCN1, fascin actin‐bundling protein 1; FSTL1, follistatin like 1; FZR1, fizzy and cell division cycle 20 related 1; GADD45B, growth arrest and DNA damage inducible beta; GAPDH, glyceraldehyde 3‐phosphate dehydrogenase; GAS6, growth arrest specific 6; GGH, gamma‐glutamyl hydrolase; GLI1, GLI family zinc finger 1; GLS, Glutaminase; GLS2, glutaminase 2; HEXB, hexosaminidase subunit beta; HMG‐CoA, 3‐hydroxy‐3‐methylglutaryl coenzyme A; HMMR, hyaluronan mediated motility receptor; INHA, inhibin subunit alpha; ITGB5, integrin subunit beta 5; LATS2, large tumor suppressor kinase 2; MAPK13, mitogen‐activated protein kinase 13; MARCKS, myristoylated alanine rich protein kinase C substrate; MDFIC, MyoD family inhibitor domain containing; mRNA, messenger RNA; MST1, macrophage stimulating 1; MYC, MYC proto‐oncogene, bHLH transcription factor; NDRG1, N‐myc downstream regulated 1; NES, normalized enrichment score; NRP1, neuropilin 1; PCNA, proliferating cell nuclear antigen; PDLIM2, PDZ and LIM domain 2; PHGDH, phosphoglycerate dehydrogenase; PMP22, peripheral myelin protein 22; PTCH1, patched 1; PXMP2, peroxisomal membrane protein 2; SGK1, serum/glucocorticoid regulated kinase 1; SH2D4A, SH2 domain containing 4A; SHCBP1, SHC binding and spindle associated 1; SHH, sonic hedgehog signaling molecule; SLIT2, slit guidance ligand 2; SMO, smoothened, frizzled class receptor; SMOX, spermine oxidase; STK4, serine/threonine kinase 4; STMN1, stathmin 1; TAZ, tafazzin; TGFB2, transforming growth factor beta 2; TGM2, transglutaminase 2; THBS1, thrombospondin 1; TK1, thymidine kinase 1; TNS1, tensin 1; TOP2A, DNA topoisomerase II alpha; TSPAN3, tetraspanin 3; WWTR1, WW domain containing transcription regulator 1; YY1AP1, YY1 associated protein 1; ZYX, Zyxin.
Atorvastatin up‐regulates metallothioneins by increasing ROS production
To investigate the distinctive mechanism of atorvastatin in addition to YAP inhibition, we identified DEGs modulated by atorvastatin exclusively. Up‐regulated genes were involved in negative regulation of growth and oxidative stress response (Figure 4A), and metallothioneins (MT2A, MT1A, MT1L, MT1M, MT1F, MT1X, and MT1E) were significantly induced only by atorvastatin (Figure 4C and Figure S3). Atorvastatin increased ROS production and up‐regulated metallothioneins in HCV‐infected Huh7.5.1 cells, but the antioxidant N‐acetylcysteine reversed the induction of metallothioneins (Figure 5A,B).
FIGURE 4.
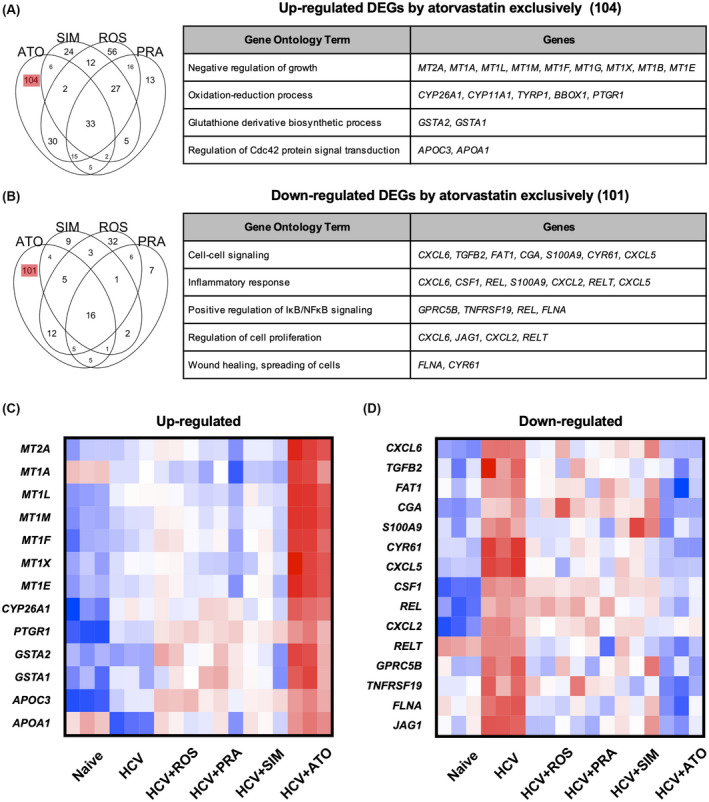
DEGs modulated by ATO (A,B) Venn diagram and GO terms of DEGs modulated by each statin (fold change > 2; FDR < 0.01). (C,D) Heatmap of up‐regulated and down‐regulated DEGs in (A) and (B). APOA1, apolipoprotein A1; APOC3, apolipoprotein C3; BBOX1, gamma‐butyrobetaine hydroxylase 1; CGA, glycoprotein hormones, alpha polypeptide; CSF1, colony stimulating factor 1; CXCL2, C‐X‐C motif chemokine ligand 2; CXCL5, C‐X‐C motif chemokine ligand 5; CXCL6, C‐X‐C motif chemokine ligand 6; CYP11A1, cytochrome P450 family 11 subfamily A member 1; CYP26A1, cytochrome P450 family 26 subfamily A member 1; FAT1, FAT atypical cadherin 1; GPRC5B, G protein‐coupled receptor class C group 5 member B; GSTA1, glutathione S‐transferase alpha 1; GSTA2, glutathione S‐transferase alpha 2; JAG1, jagged canonical Notch ligand 1; MT1A, metallothionein 1A; MT1B, metallothionein 1B; MT1E, metallothionein 1E; MT1G, metallothionein 1G; MT1L, metallothionein 1L; MT1X, metallothionein 1X; MT2A, metallothionein 2A; PTGR1, prostaglandin reductase 1; REL, REL proto‐oncogene, NF‐kB subunit; RELT, RELT TNF receptor; S100A9, S100 calcium binding protein A9; TGFB2, transforming growth factor beta 2; TNFRSF19, TNF receptor superfamily member 19; TYRP1, tyrosinase related protein 1.
FIGURE 5.
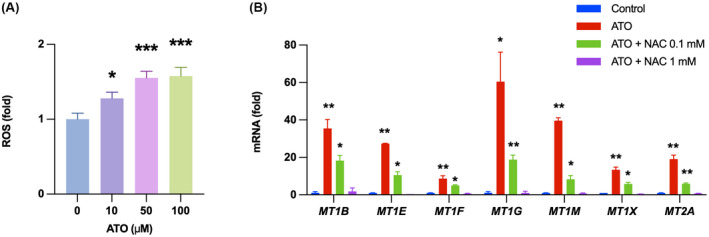
Atorvastatin up‐regulates metallothioneins by increasing ROS production. (A) HCV‐infected Huh7.5.1 cells were treated for 2 days and then subjected to ROS measurement. (B) HCV‐infected Huh7.5.1 cells were treated with 50 μM ATO for 2 days in the presence or absence of N‐acetylcysteine (NAC). mRNA levels of metallothioneins were analyzed by quantitative reverse‐transcription polymerase chain reaction (PCR) (*p < 0.05, **p < 0.01, ***p < 0.001 compared with control). Data are presented as mean ± SEM of n = 3 independent experiments.
Atorvastatin suppresses AKT phosphorylation in an RXR‐α dependent manner
Prominent among down‐regulated genes by atorvastatin were genes involved in cell proliferation and inflammation (Figure 4B,D ). To identify unique mechanisms of atorvastatin on cell proliferation and inflammation (chemokine [C‐X‐C motif] ligand 6 [CXCL6], transforming growth factor B2 [TGFB2], FAT atypical cadherin 1 [FAT1], glycoprotein hormones, alpha polypeptide [CGA], S100 calcium binding protein A9 [S100A9], CYR61, C‐X‐C motif chemokine ligand 5 [CXCL5], jagged canonical Notch ligand 1 [JAG1], C‐X‐C motif chemokine ligand 2 [CXCL2], RELT TNF receptor [RELT], filamin A [FLNA], colony stimulating factor 1 [CSF1], REL proto‐oncogene, NF‐kB subunit [REL], G protein‐coupled receptor class C group 5 member B [GPRC5B], and TNF receptor superfamily member 19 [TNFRSF19]), we searched targets of statins other than HMG‐CoA reductase. Among the known targets of atorvastatin, we focused on RXR‐α. Atorvastatin has been reported to stabilize truncated RXR‐α, which is the N‐terminally truncated form of RXR‐α promoting tumor growth by enhancing AKT activation.[ 23 , 24 ] Truncated RXR‐α is recognized as a target of cancer therapy, as truncated RXR‐α production is increased in various types of cancer cell lines and the liver tissues of patients with HCC.[ 25 ] Accordingly, we hypothesized that atorvastatin inhibits AKT activation by stabilizing truncated RXR‐α in HCV‐infected Huh7.5.1 cells. Statins, particularly atorvastatin, inhibited AKT phosphorylation, and mevalonate supplement rescued the inhibition of AKT phosphorylation by all statins tested (Figure 6). However, the reversal of AKT phosphorylation by mevalonate was not significant in cells treated with atorvastatin, suggesting that atorvastatin is blocking AKT phosphorylation through an independent mechanism. To confirm that atorvastatin inhibits AKT activation through an RXR‐α mediated mechanism, we knocked down RXR‐α in HCV‐infected Huh7.5.1 cells using siRNA and treated these cells with atorvastatin. When RXR‐α was knocked down, the inhibitory effect of atorvastatin on AKT phosphorylation was attenuated. In contrast, simvastatin and pravastatin still inhibited AKT phosphorylation when RXR‐α was knocked down, and the inhibition was reversed only by addition of mevalonate supplement (Figure 6).
FIGURE 6.
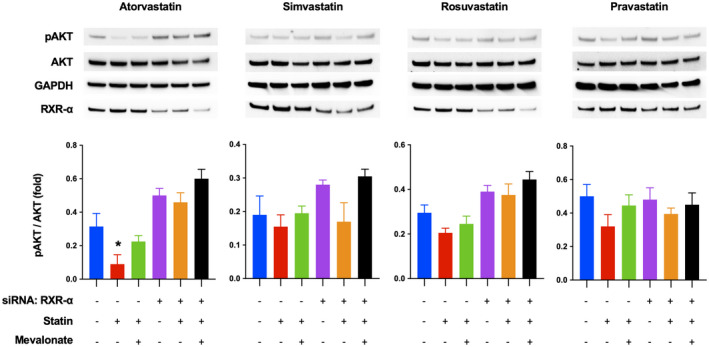
ATO suppresses AKT phosphorylation in retinoid X receptor alpha (RXR‐α)–dependent manner. HCV‐infected Huh7.5.1 cells were treated with RXR‐α small interfering RNA (siRNA) or control siRNA. After 30 h, the cells were treated with 50 μM ATO, 100 μM SIM, 50 μM ROS, and 500 μM PRA for 1 day in presence or absence of 100 μM mevalonate. The harvested cells were analyzed by western blot (*p < 0.05 compared with negative control [blue bar]). Data are presented as mean ± SEM of n = 3 independent experiments.
Atorvastatin reduces the PLS score in an in vitro model of NAFLD
The mechanism of atorvastatin inhibiting YAP and AKT activation is not restricted to HCV infection but also is implicated in the pathogenesis of NAFLD.[ 26 ] Thus, we evaluated whether atorvastatin reduces the PLS score and inhibits YAP and AKT pathway in the context of NAFLD. Statins, especially atorvastatin, reduced the PLS score in free fatty acid–treated spheroids consisting of Huh7 cells and human pHSCs (Figure 7A), an in vitro model of NAFLD validated for evaluating PLS, YAP, and AKT pathway by our group[ 15 , 27 ] (Figure 7B). AKT activation in this model is also plausible, as our previous study confirmed that free fatty acid up‐regulates expression of α‐smooth muscle actin and collagens in the spheroids attributable to HSC activation,[ 27 ] and it has been reported that extracellular matrix stiffness increases AKT activation in HSCs[ 28 , 29 ] and hepatocytes.[ 30 , 31 ]
FIGURE 7.
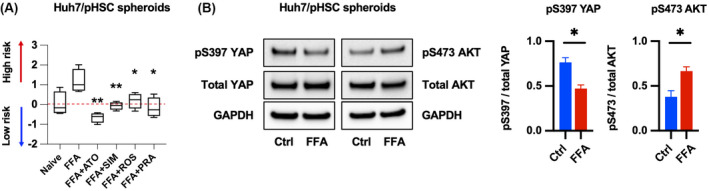
Atorvastatin reduces the PLS score in an in vitro model of NAFLD. (A) Spheroids consisting of Huh7 cells and human primary hepatic stellate cells (pHSCs) were treated with free fatty acids (FFAs) and statins for 2 days and analyzed by PLS score. Data are presented as box and whiskers plots of n = 3 independent experiments (*p < 0.05, **p < 0.01 compared with FFAs). (B) Huh7/pHSC spheroids were treated with FFAs for 2 days and subjected to western blot (*p < 0.05 compared with Ctrl). Data are presented as mean ± SEM of n = 3 independent experiments.
DISCUSSION
We found that atorvastatin significantly modulates a poor prognostic HCC risk signature compared with simvastatin, rosuvastatin, and pravastatin in an in vitro model of HCV infection and NAFLD. We adjusted the concentration of both lipophilic and hydrophilic statins to produce the same levels of intracellular LDL. This normalized the effect of solubility related to lipophilicity and hydrophilicity, and revealed for atorvastatin a unique additional pharmacological property. This distinctive effect of atorvastatin may be mediated by the mechanism that atorvastatin inhibits YAP and AKT activation, which are biologically implicated in hepatocarcinogenesis. We demonstrated in our cell system that atorvastatin not only inhibits HMG‐CoA reductase but also stabilizes truncated RXR‐α to inhibit YAP and AKT activation.
Our recent study demonstrated that cells from the human hepatoma‐derived cell line Huh7.5.1 acquire a hepatocyte‐like phenotype following 10 days of culture with dimethyl sulfoxide (DMSO). Persistent HCV infection in the DMSO‐differentiated Huh7.5.1 cells led to the induction of the high‐risk PLS, derived from clinical cirrhotic (non‐HCC) liver tissues. The cell culture system (cPLS system) enabled identification of several molecular‐targeted and generic agents (e.g., nizatidine) as candidate HCC chemoprevention therapies for further clinical testing, as shown in the published study.[ 15 ] Thus, the cPLS system used in this study is an appropriate system to test the chemopreventive effect of statins. Atorvastatin most significantly reduced the PLS score than the other three statins tested. This result is consistent with the recent meta‐analysis reporting that atorvastatin has the greatest magnitude of chemopreventive effect against HCC incidence among several lipophilic and hydrophilic statins.[ 8 ] Moreover, atorvastatin reduced the PLS score below that of uninfected Huh7.5.1 cells. Previous studies validated that PLS reflects HCC risk driving signaling pathways such as epidermal growth factor receptor and lysophosphatidic acid, which are critical upstream mediators of the YAP and AKT pathways.[ 32 , 33 ] Thus, the outstanding PLS score reduction by atorvastatin can be attributed to the distinctive actions of atorvastatin on both YAP and AKT pathway.
Statins, particularly atorvastatin, modulated the genes involved in the YAP signaling pathway. The YAP pathway has been recognized as a critical target to prevent HCC, as YAP is known to play key roles in fibrogenesis and carcinogenesis in the liver.[ 26 ] Several studies revealed that HCV infection induces YAP activation through Rho GTPase,[ 34 ] interferon regulatory factor 3,[ 35 ] and scribble‐mediated Hippo pathway.[ 36 ] We confirmed that atorvastatin inhibits Rho GTPase‐mediated YAP activation by reducing the mevalonate pathway product GGPP in HCV‐infected Huh7.5.1 cells, a common mechanism of statins. These findings prompted us to search for another mechanism to explain atorvastatin's distinctive effect beyond HMG‐CoA reductase inhibition, which are probably associated with YAP activation. To this end, we found that atorvastatin more significantly reduced AKT phosphorylation than the other three statins. It has been reported that statins inhibit AKT phosphorylation by depleting mevalonate pathway products.[ 37 ] Mevalonate supplementation reversed AKT inhibition by all statins tested but did not fully reverse AKT inhibition by atorvastatin. When RXR‐α was knocked down, the inhibitory effect of atorvastatin was attenuated, suggesting that atorvastatin inhibits AKT activation through modulating truncated RXR‐α and through inhibition of the mevalonate pathway. Moreover, atorvastatin exerted a chemopreventive effect that extended beyond HCV to NAFLD and it could very likely be effective against HBV‐induced HCC, in which YAP and AKT activation are also implicated.[ 38 , 39 , 40 , 41 ]
Additionally, we discovered that atorvastatin increases ROS production and consequently induces metallothioneins, which are cysteine‐rich proteins that play important roles in protection against oxidative stress.[ 42 ] ROS induction by statins has been recognized as a potential chemopreventive strategy,[ 43 ] and metallothionein induction has been proposed to be beneficial to prevent HCC development from various etiologies of liver disease[ 42 ] through inhibition of the Wnt/β‐catenin and the nuclear factor kappa B pathways.[ 44 , 45 ] Therefore, these overlooked properties of atorvastatin can be leveraged to prevent HCC of various etiology, not limited to HCV infection, and their effects may be monitored through the pan‐etiologic high‐risk PLS.
It should also be noted that statins did not affect HCV replication in our experiments. Statins have been shown to inhibit HCV replication through depletion of several proteins required for HCV replication involved in cholesterol synthesis.[ 46 , 47 ] However, clinical studies have not reproduced the inhibitory effect of statins on HCV replication.[ 48 , 49 ] Our results suggest that the chemopreventive effect of statins is not linked to the antiviral effect of statins on HCV.
Overall, our study provides critical insights into atorvastatin's unique pharmacological properties for the chemoprevention in HCC associated with HCV and NAFLD. These findings suggest that atorvastatin is possibly the most potent statin to reduce HCC risk in patients with chronic liver disease of any etiology. We have embarked on a clinical trial to confirm the PLS score–lowering effect of atorvastatin in patients with advanced liver disease of any etiology at high risk of HCC (NCT05028829). We expect that the clinical trial will prove the chemopreventive effect of atorvastatin for the patients with high risk of HCC and propose a strategy for HCC prevention.
Funding information
Supported by the National Institutes of Health (DK099558, CA233794, CA255621, AI136715), Cancer Prevention and Research Institute of Texas (RR180016), European Commission (ERC‐2014‐AdG‐671,231 HEPCIR), Fondation ARC (IHU201901299), LabEx HepSYS, and the Massachusetts General Hospital Research Scholars Program.
CONFLICT OF INTEREST
Nothing to report.
Supporting information
Figure S1. Titration of concentrartion of statins.
Figure S2. HCV infection induces YAP activation.
Figure S3. Simvastatin, rosuvastatin, and pravastatin didn’t up‐regulate metallothioneins.
Table S1. Primer sequence for qRT‐PCR.
Table S1a. Primer sequence for qRT‐PCR.
ACKNOWLEDGMENT
The authors thank the following investigators and institutes for supplying the materials listed here: Francis Chisari (Scripps Institute, La Jolla, CA) for Huh7.5.1 cell line; Charles M. Rice (Rockefeller University, New York, NY) for Jc1FLAG2 (p7‐nsGluc2A). They also thank Dr. Emilie Crouchet, Inserm U1110 (U Strasbourg) for the helpful discussions on the in vitro model.
Kim M‐H, Kim M‐Y, Salloum S, Qian T, Wong LP, Xu M, Atorvastatin favorably modulates a clinical hepatocellular carcinoma risk gene signature. Hepatol Commun. 2022;6:2581–2593. 10.1002/hep4.1991
Myung‐Ho Kim and Mi‐Young Kim contributed equally to this work.
Contributor Information
Yujin Hoshida, Email: yujin.hoshida@utsouthwestern.edu.
Raymond T. Chung, Email: chung.raymond@mgh.harvard.edu.
REFERENCES
- 1. de Martel C, Maucort‐Boulch D, Plummer M, Franceschi S. World‐wide relative contribution of hepatitis B and C viruses in hepatocellular carcinoma. Hepatology. 2015;62:1190–200. [DOI] [PMC free article] [PubMed] [Google Scholar]
- 2. El‐Serag HB. Epidemiology of viral hepatitis and hepatocellular carcinoma. Gastroenterology. 2012;142:1264–73.e1261. [DOI] [PMC free article] [PubMed] [Google Scholar]
- 3. Lingala S, Ghany MG. Natural history of hepatitis C. Gastroenterol Clin North Am. 2015;44:717–34. [DOI] [PMC free article] [PubMed] [Google Scholar]
- 4. Su F, Ioannou GN. Hepatocellular carcinoma risk after direct‐acting antiviral therapy. Clinical Liver Disease. 2019;13:6–12. [DOI] [PMC free article] [PubMed] [Google Scholar]
- 5. Sapena V, Enea M, Torres F, Celsa C, Rios J, Rizzo GEM, et al. Hepatocellular carcinoma recurrence after direct‐acting antiviral therapy: an individual patient data meta‐analysis. Gut. 2021;71:593–604. [DOI] [PubMed] [Google Scholar]
- 6. van der Meer AJ, Veldt BJ, Feld JJ, Wedemeyer H, Dufour JF, Lammert F, et al. Association between sustained virological response and all‐cause mortality among patients with chronic hepatitis C and advanced hepatic fibrosis. JAMA. 2012;308:2584–93. [DOI] [PubMed] [Google Scholar]
- 7. Schierwagen R, Uschner FE, Magdaleno F, Klein S, Trebicka J. Rationale for the use of statins in liver disease. Am J Physiol‐Gastrointest Liver Physiol. 2017;312:G407–12. [DOI] [PubMed] [Google Scholar]
- 8. Facciorusso A, Abd El Aziz MA, Singh S, Pusceddu S, Milione M, Giacomelli L, et al. Statin use decreases the incidence of hepatocellular carcinoma: an updated meta‐analysis. Cancers (Basel). 2020;12:874. [DOI] [PMC free article] [PubMed] [Google Scholar]
- 9. Simon TG, Bonilla H, Yan P, Chung RT, Butt AA. Atorvastatin and fluvastatin are associated with dose‐dependent reductions in cirrhosis and hepatocellular carcinoma, among patients with hepatitis C virus: results from ERCHIVES. Hepatology. 2016;64:47–57. [DOI] [PMC free article] [PubMed] [Google Scholar]
- 10. Simon TG, Duberg A‐S, Aleman S, Hagstrom H, Nguyen LH, Khalili H, et al. Lipophilic statins and risk for hepatocellular carcinoma and death in patients with chronic viral hepatitis: results from a nationwide Swedish population. Ann Intern Med. 2019;171:318–27. [DOI] [PMC free article] [PubMed] [Google Scholar]
- 11. Beckwitt CH, Shiraha K, Wells A. Lipophilic statins limit cancer cell growth and survival, via involvement of Akt signaling. PLoS One. 2018;13:e0197422. [DOI] [PMC free article] [PubMed] [Google Scholar]
- 12. Menter DG, Ramsauer VP, Harirforoosh S, Chakraborty K, Yang P, Hsi L, et al. Differential effects of pravastatin and simvastatin on the growth of tumor cells from different organ sites. PLoS One. 2011;6:e28813. [DOI] [PMC free article] [PubMed] [Google Scholar]
- 13. Hoshida Y, Villanueva A, Sangiovanni A, Sole M, Hur C, Andersson KL, et al. Prognostic gene expression signature for patients with hepatitis C‐related early‐stage cirrhosis. Gastroenterology. 2013;144:1024–30. [DOI] [PMC free article] [PubMed] [Google Scholar]
- 14. Hoshida Y, Villanueva A, Kobayashi M, Peix J, Chiang DY, Camargo A, et al. Gene expression in fixed tissues and outcome in hepatocellular carcinoma. N Engl J Med. 2008;359:1995–2004. [DOI] [PMC free article] [PubMed] [Google Scholar]
- 15. Crouchet E, Bandiera S, Fujiwara N, Li S, El Saghire H, Fernández‐Vaquero M, et al. A human liver cell‐based system modeling a clinical prognostic liver signature for therapeutic discovery. Nat Commun. 2021;12:5525. [DOI] [PMC free article] [PubMed] [Google Scholar]
- 16. Dobin A, Davis CA, Schlesinger F, Drenkow J, Zaleski C, Jha S, et al. STAR: ultrafast universal RNA‐seq aligner. Bioinformatics. 2013;29:15–21. [DOI] [PMC free article] [PubMed] [Google Scholar]
- 17. Anders S, Pyl PT, Huber W. HTSeq—a Python framework to work with high‐throughput sequencing data. Bioinformatics. 2015;31:166–9. [DOI] [PMC free article] [PubMed] [Google Scholar]
- 18. Anders S, McCarthy DJ, Chen Y, Okoniewski M, Smyth GK, Huber W, et al. Count‐based differential expression analysis of RNA sequencing data using R and Bioconductor. Nat Protoc. 2013;8:1765–86. [DOI] [PubMed] [Google Scholar]
- 19. Robinson MD, McCarthy DJ, Smyth GK. edgeR: a Bioconductor package for differential expression analysis of digital gene expression data. Bioinformatics. 2010;26:139–40. [DOI] [PMC free article] [PubMed] [Google Scholar]
- 20. Hoshida Y. Nearest template prediction: a single‐sample‐based flexible class prediction with confidence assessment. PLoS One. 2010;5:e15543. [DOI] [PMC free article] [PubMed] [Google Scholar]
- 21. King LY, Canasto‐Chibuque C, Johnson KB, Yip S, Chen X, Kojima K, et al. A genomic and clinical prognostic index for hepatitis C‐related early‐stage cirrhosis that predicts clinical deterioration. Gut. 2015;64:1296–302. [DOI] [PMC free article] [PubMed] [Google Scholar]
- 22. Sorrentino G, Ruggeri N, Specchia V, Cordenonsi M, Mano M, Dupont S, et al. Metabolic control of YAP and TAZ by the mevalonate pathway. Nat Cell Biol. 2014;16:357–66. [DOI] [PubMed] [Google Scholar]
- 23. Wang X, Chong S, Lin H, Yan Z, Huang F, Zeng Z, et al. Discovery of atorvastatin as a tetramer stabilizer of nuclear receptor RXRα through structure‐based virtual screening. Bioorg Chem. 2019;85:413–9. [DOI] [PMC free article] [PubMed] [Google Scholar]
- 24. Zhou H, Liu W, Su Y, Wei Z, Liu J, Kolluri SK, et al. NSAID sulindac and its analog bind RXRalpha and inhibit RXRalpha‐dependent AKT signaling. Cancer Cell. 2010;17:560–73. [DOI] [PMC free article] [PubMed] [Google Scholar]
- 25. Zhang X, Zhou H, Su Y. Targeting truncated RXRα for cancer therapy. Acta Biochim Biophys Sin (Shanghai). 2016;48:49–59. [DOI] [PMC free article] [PubMed] [Google Scholar]
- 26. Manmadhan S, Ehmer U. Hippo signaling in the liver—a long and ever‐expanding story. Front Cell Dev Biol. 2019;7:33. [DOI] [PMC free article] [PubMed] [Google Scholar]
- 27. Salloum S, Jeyarajan AJ, Kruger AJ, Holmes JA, Shao T, Sojoodi M, et al. Fatty acids activate the transcriptional coactivator YAP1 to promote liver fibrosis via p38 mitogen‐activated protein kinase. Cell Mol Gastroenterol Hepatol. 2021;12:1297–310. [DOI] [PMC free article] [PubMed] [Google Scholar]
- 28. Liu Z, Mo H, Liu R, Niu Y, Chen T, Xu Q, et al. Matrix stiffness modulates hepatic stellate cell activation into tumor‐promoting myofibroblasts via E2F3‐dependent signaling and regulates malignant progression. Cell Death Dis. 2021;12:1134. [DOI] [PMC free article] [PubMed] [Google Scholar]
- 29. Dou C, Liu Z, Tu K, Zhang H, Chen C, Yaqoob U, et al. P300 acetyltransferase mediates stiffness‐induced activation of hepatic stellate cells into tumor‐promoting myofibroblasts. Gastroenterology. 2018;154:2209–21.e2214. [DOI] [PMC free article] [PubMed] [Google Scholar]
- 30. Schrader J, Gordon‐Walker TT, Aucott RL, van Deemter M, Quaas A, Walsh S, et al. Matrix stiffness modulates proliferation, chemotherapeutic response, and dormancy in hepatocellular carcinoma cells. Hepatology. 2011;53:1192–205. [DOI] [PMC free article] [PubMed] [Google Scholar]
- 31. Gao X, Qiao X, Xing X, Huang J, Qian J, Wang Y, et al. Matrix stiffness‐upregulated microRNA‐17‐5p attenuates the intervention effects of metformin on HCC invasion and metastasis by targeting the PTEN/PI3K/Akt pathway. Front Oncol. 2020;10:1563. [DOI] [PMC free article] [PubMed] [Google Scholar]
- 32. Fuchs BC, Hoshida Y, Fujii T, Wei L, Yamada S, Lauwers GY, et al. Epidermal growth factor receptor inhibition attenuates liver fibrosis and development of hepatocellular carcinoma. Hepatology. 2014;59:1577–90. [DOI] [PMC free article] [PubMed] [Google Scholar]
- 33. Nakagawa S, Wei L, Song WM, Higashi T, Ghoshal S, Kim RS, et al. Molecular liver cancer prevention in cirrhosis by organ transcriptome analysis and lysophosphatidic acid pathway inhibition. Cancer Cell. 2016;30:879–90. [DOI] [PMC free article] [PubMed] [Google Scholar]
- 34. Brazzoli M, Bianchi A, Filippini S, Weiner A, Zhu Q, Pizza M, et al. CD81 is a central regulator of cellular events required for hepatitis C virus infection of human hepatocytes. J Virol. 2008;82:8316–29. [DOI] [PMC free article] [PubMed] [Google Scholar]
- 35. Jiao S, Guan J, Chen M, Wang W, Li C, Wang Y, et al. Targeting IRF3 as a YAP agonist therapy against gastric cancer. J Exp Med. 2018;215:699–718. [DOI] [PMC free article] [PubMed] [Google Scholar]
- 36. Hu B, Xie S, Hu Y, Chen W, Chen X, Zheng Y, et al. Hepatitis C virus NS4B protein induces epithelial‐mesenchymal transition by upregulation of snail. Virol J. 2017;14:83. [DOI] [PMC free article] [PubMed] [Google Scholar]
- 37. Iizuka‐Ohashi M, Watanabe M, Sukeno M, Morita M, Hoang NTH, Kuchimaru T, et al. Blockage of the mevalonate pathway overcomes the apoptotic resistance to MEK inhibitors with suppressing the activation of Akt in cancer cells. Oncotarget. 2018;9:19597–612. [DOI] [PMC free article] [PubMed] [Google Scholar]
- 38. Khattar E, Mukherji A, Kumar V. Akt augments the oncogenic potential of the HBx protein of hepatitis B virus by phosphorylation. FEBS J. 2012;279:1220–30. [DOI] [PubMed] [Google Scholar]
- 39. Ha HL, Yu DY. HBx‐induced reactive oxygen species activates hepatocellular carcinogenesis via dysregulation of PTEN/Akt pathway. World J Gastroenterol. 2010;16:4932–7. [DOI] [PMC free article] [PubMed] [Google Scholar]
- 40. Zhang T, Zhang J, You X, Liu Q, Du Y, Gao Y, et al. Hepatitis B virus X protein modulates oncogene yes‐associated protein by CREB to promote growth of hepatoma cells. Hepatology. 2012;56:2051–9. [DOI] [PubMed] [Google Scholar]
- 41. Wu Y, Zhang J, Zhang H, Zhai Y. Hepatitis B virus X protein mediates yes‐associated protein 1 upregulation in hepatocellular carcinoma. Oncol Lett. 2016;12:1971–4. [DOI] [PMC free article] [PubMed] [Google Scholar]
- 42. Nagamine T, Nakajima K. Significance of metallothionein expression in liver disease. Curr Pharm Biotechnol. 2013;14:420–6. [DOI] [PubMed] [Google Scholar]
- 43. Perillo B, Di Donato M, Pezone A, Di Zazzo E, Giovannelli P, Galasso G, et al. ROS in cancer therapy: the bright side of the moon. Exp Mol Med. 2020;52:192–203. [DOI] [PMC free article] [PubMed] [Google Scholar]
- 44. Zheng Y, Jiang L, Hu Y, Xiao C, Xu N, Zhou J, et al. Metallothionein 1H (MT1H) functions as a tumor suppressor in hepatocellular carcinoma through regulating Wnt/β‐catenin signaling pathway. BMC Cancer. 2017;17:161. [DOI] [PMC free article] [PubMed] [Google Scholar]
- 45. Mao J, Yu H, Wang C, Sun L, Jiang W, Zhang P, et al. Metallothionein MT1M is a tumor suppressor of human hepatocellular carcinomas. Carcinogenesis. 2012;33:2568–77. [DOI] [PubMed] [Google Scholar]
- 46. Kapadia SB, Chisari FV. Hepatitis C virus RNA replication is regulated by host geranylgeranylation and fatty acids. Proc Natl Acad Sci U S A. 2005;102:2561–6. [DOI] [PMC free article] [PubMed] [Google Scholar]
- 47. Kim SS, Peng LF, Lin W, Choe WH, Sakamoto N, Kato N, et al. A cell‐based, high‐throughput screen for small molecule regulators of hepatitis C virus replication. Gastroenterology. 2007;132:311–20. [DOI] [PubMed] [Google Scholar]
- 48. O'Leary JG, Chan JL, McMahon CM, Chung RT. Atorvastatin does not exhibit antiviral activity against HCV at conventional doses: a pilot clinical trial. Hepatology. 2007;45:895–8. [DOI] [PubMed] [Google Scholar]
- 49. Forde KA, Law C, O'Flynn R, Kaplan DE. Do statins reduce hepatitis C RNA titers during routine clinical use? World J Gastroenterol. 2009;15:5020–7. [DOI] [PMC free article] [PubMed] [Google Scholar]
Associated Data
This section collects any data citations, data availability statements, or supplementary materials included in this article.
Supplementary Materials
Figure S1. Titration of concentrartion of statins.
Figure S2. HCV infection induces YAP activation.
Figure S3. Simvastatin, rosuvastatin, and pravastatin didn’t up‐regulate metallothioneins.
Table S1. Primer sequence for qRT‐PCR.
Table S1a. Primer sequence for qRT‐PCR.