FIGURE 6.

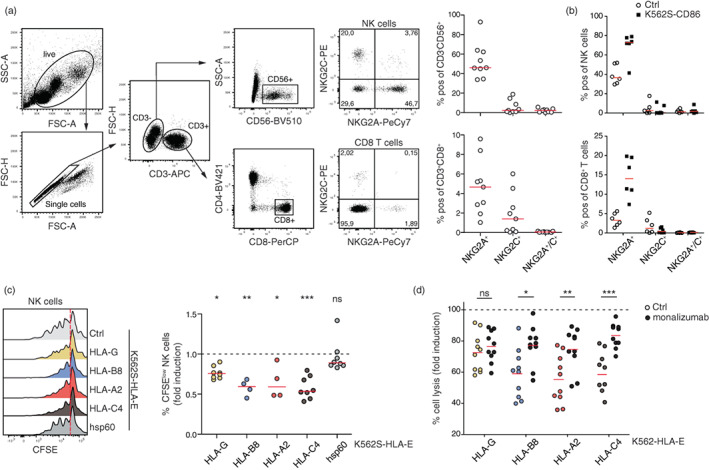
NKG2A expression on CD8+ T cells and natural killer (NK) cells. (a) Left panel; representative gating of NKG2A and NKG2C on NK cells and CD8+ T cells from freshly isolated PBMCs is shown. Right panel; expression of NKG2A and NKG2C on CD8+ T cells and NK cells; each dot represents one donor. Median is shown (n = 10). (b) Freshly isolated PBMCs were stimulated with K562S cells expressing CD86 for 5 days. NKG2A and NKG2C expression was assessed on NK and CD8+ T cells. Each dot represents one donor. Median is shown (n = 6). (c) PBMCs were co‐cultured for 5 days with the indicated K562S cell lines and proliferation (CSFElow) was analysed for NK cells. Left panel; one representative experiment is shown. Right panel; data from several donors are depicted (HLA‐G and HLA‐C4 [n = 8]; HLA‐B8 and HLA‐A2 [n = 4]). Each data point represents the mean of triplicates of one donor. NK cell proliferation induced upon stimulation with K562S expressing the indicated HLA‐E‐complexes is normalized to the NK cell proliferation induced by control K562S cells (% of CFSElow of K562S‐HLA‐Epeptide stimulated NK cells/% of CFSElow control K562S‐stimulated NK cells). For statistical evaluation, a one‐way ANOVA followed by Dunn's multiple comparison test was performed (***p ≤ 0.001; **p ≤ 0.01; *p ≤ 0.05; ns p > 0.05). (d) Lysis of the indicated target cells upon 4 h co‐culture with PBMCs pre‐stimulated for 7–10 days in the presence of IL‐2 and IL‐15 to induce NK cell expansion. Effector: target cell ratio was 10:1 and monalizumab was used at a final concentration of 5 μg/ml. Data were normalized to control K562 cells (control K562 = 100% cell lysis). Median is shown (n = 10). For statistical evaluation, a two‐way ANOVA followed by Bonferroni post hoc test was performed (***p ≤ 0.001; **p ≤ 0.01; *p ≤ 0.05; ns p > 0.05).
