. 2022 Jul 8;11:e76095. doi: 10.7554/eLife.76095

Figure 2. Mitochondrial fragmentation precedes the swift adaptation to paraquat (PQ).

(A) EM microscopy of cells before (panel 1) and after short-term stress (panel 2, red arrowheads mark representative mitochondria). Panel 3 shows the number of mitochondria per imaged cell (left) and the imaged cell area occupied by mitochondrial area (%) (right), used as proxy for mitochondrial volume. Error bars: S.E.M. (n=100 cells). p-values: Welch two-sided t-test. (B) Confocal microscopy of cells with a Cox4-GFP mitochondrial tag. Color: z-dimension (yellow = front, purple = back; 18 slices). Lower left diagram: Number of mitochondria per imaged cell. Lower right diagram: Mean sum of mitochondrial volume as a fraction of cell volume. Error bars: S.E.M. (n=473–910 cells). p-values: Welch two-sided t-test (C) Adaptation of atg32Δ and wild-type populations to paraquat. Shade: S.E.M. (n=16 populations, each measured at n=6). See also Figure 2—figure supplement 1.

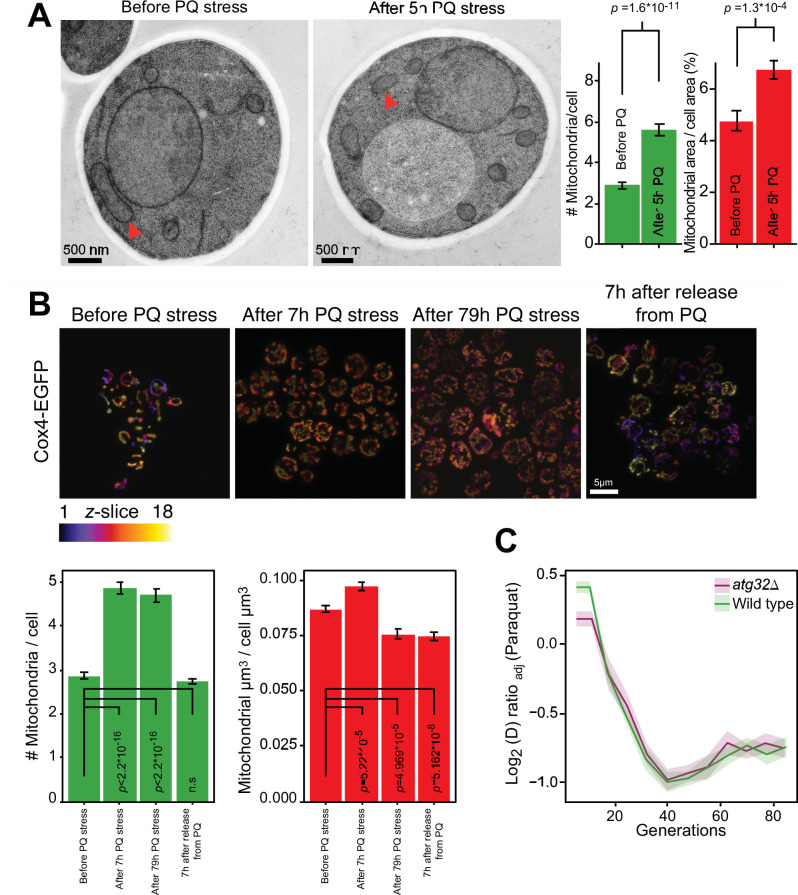
Figure 2—source data 1. Mitochondrial and cell area quantified, based on electron microscopy micrographs.
Data are shown in Figure 2A.
Figure 2—source data 2. Number of mitochondria quantified, based on electron microscopy micrographs.
Data are shown in Figure 2A.
Figure 2—source data 3. Number and volume of mitochondria of cells segmented from confocal microscopy micrographs of cells exposed to paraquat.
Data are shown in Figure 2B and in Figure 2—figure supplement 1.
elife-76095-fig2-data3.xlsx (137.9KB, xlsx)
Figure 2—source data 4. Doubling time data of wild type and populations adapting to paraquat over generations G; doubling times are in paraquat.
Data are shown in Figure 2C.

Figure 2.

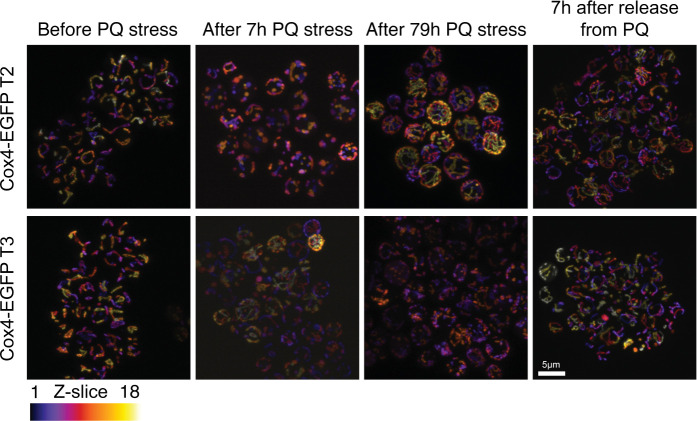
Figure 2—figure supplement 1. Paraquat (PQ) stress leads to rapid mitochondrial fragmentation.

Figure 2—figure supplement 1.

(A) Confocal microscopy of yeast cells with a Cox4-GFP inner mitochondrial membrane marker. Panels show cells before PQ exposure, after 7 hr of exposure, after exposure over one growth cycle (72 hr+7 hr), and 7 hr after release from two growth cycles under PQ stress. Color: z-dimension (yellow = front, black = back), samples were sliced in 18 slices with the first slice being closest to the camera. Two Cox4-EGFP transformants, isolated independently from the one in Figure 2B, are shown.