. 2022 Jul 8;11:e76095. doi: 10.7554/eLife.76095

Figure 4. The mtDNA editing critically involves Sod2.

(A) Doubling time (h) in wild type (400 µg/mL paraquat: green), sod2Δ (12.5 µg/mL paraquat: red; 50 µg/mL paraquat: yellow) and sod1Δ (12.5 µg/mL paraquat: blue) cell populations adapting to equivalent stress levels. (B) mtDNA change in sod2Δ cell populations 2E, 4E, 9C, and 3C adapting to 50 µg/mL paraquat. Circle: mtDNA (77 kb) before exposure to paraquat. Genes, origins of replication and nucleotide positions (kb) are indicated. Colored fields: mtDNA deletions with concerted copy number change. Diagrams: mtDNA copy number change left y-axis, purple line, (n=2) of individual mtDNA genes during the adaptation (right y-axis, green line). Shade: S.E.M. (C) Mean growth of wild type (n=480; green), mip1Δ (n=288; red), sod2Δ (n=96; purple), and sod2Δmip1Δ (n=384; blue) cell populations in the presence of 400 µg/mL (left) and 50 µg/mL (right) paraquat. See also Figure 4—figure supplement 1.

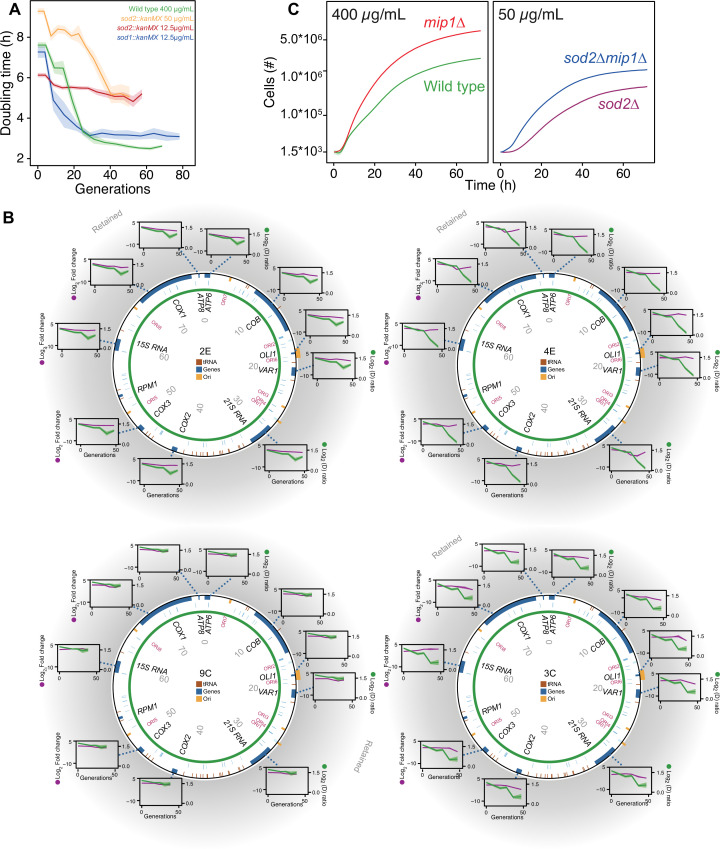
Figure 4—source data 1. Doubling time data of wild type, sod2∆, and sod1∆ populations adapting to paraquat; doubling times are in paraquat.
Figure 4—source data 2. Growth curves of populations of mip1∆sod2∆, mip1∆, sod2∆, and wild type exposed to paraquat.
Data are shown in Figure 4C.
elife-76095-fig4-data2.xlsx (115.5KB, xlsx)
Figure 4—source data 3. qPCR data for mitochondrial DNA genes and nuclear DNA controls in sod2Δ populations over generations of paraquat adaptation.
Data are shown in Figure 4B and in Figure 4—figure supplement 1B.

Figure 4.

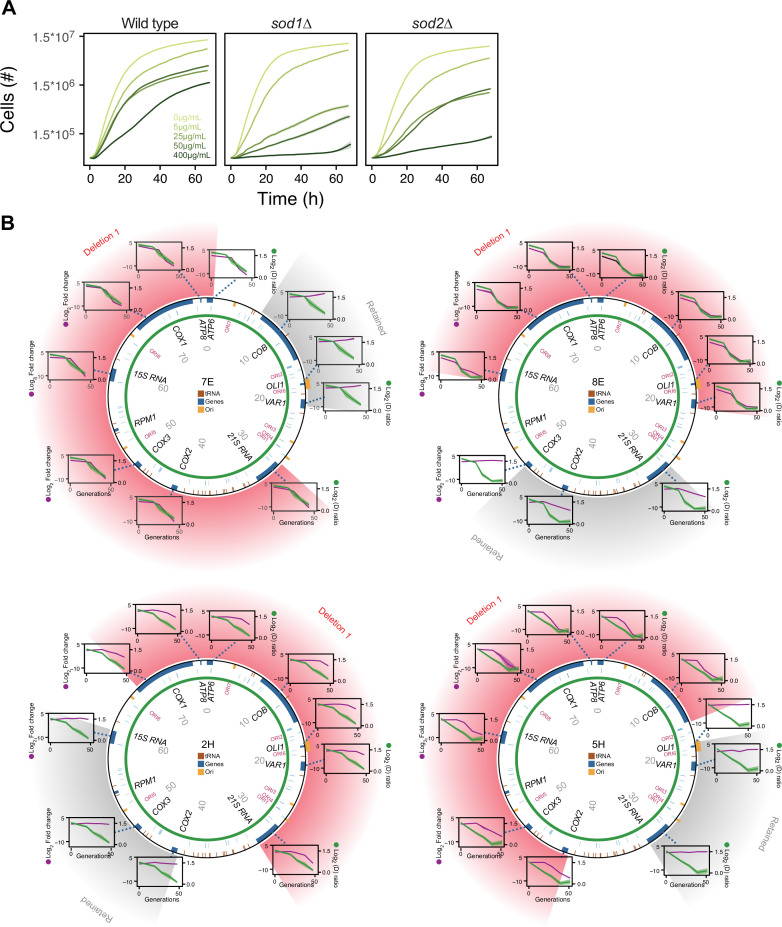
Figure 4—figure supplement 1. The mtDNA deletion process critically involves Sod2, but not Sod1.

Figure 4—figure supplement 1.

(A) Comparison of the growth of wild type (left), sod1Δ (center), and sod2Δ (right) cell populations in increasing (color intensity) doses of paraquat. Shade: S.E.M. (n=96). (B) mtDNA deletions in four sod2Δ cell populations adapting to 12.5 μg/mL of paraquat. Circle: mtDNA (77 kb) before paraquat exposure. Genes, origins of replication and nucleotide positions (kb) are indicated. Colored fields describe mtDNA deletions with concomitant copy number change. Diagrams: mtDNA copy number change left y-axis, purple line, (n=2) of individual mtDNA genes during adaptation to paraquat (right y-axis, green line) in sod2Δ cell populations 7E, 8E, 2H, and 5H. Shade: S.E.M.
Figure 4—figure supplement 1—source data 1. Mean growth curves of wild type, sod1Δ, and sod2Δ and wild type exposed to different concentrations of paraquat.