

Abstract
Introduction
Clinical, laboratory and imaging findings in patients with multidrug resistant-tuberculosis (MDR-TB) and non-tuberculosis mycobacterium (NTM) are similar, and the majority of these patients present with positive smear for Acid Fast Bacilli (ADB) and no response to first line anti-TB treatment, so sputum culture and PCR are necessary, especially in NTM.
Objective
In this study we evaluate more details of imaging findings to help earlier diagnosis of pathogens.
Materials and methods
66 patients with positive smear for AFB and no response to first line anti-TB drugs were divided into two groups by PCR and culture: MDR-TB (43 patients) and NTM (23 patients). Age, sex, history of anti-TB treatment, smoking and CT-scan findings (parenchymal, pleural and mediastinal variables) by details and lobar distribution were analyzed.
Results
Mean age of NTM patients was slightly higher (52 versus 45) and there is no significant difference in sex and smoking. In MDR-TB group, history of anti-TB treatment and evidence of chronic pulmonary disease such as calcified and fibrodestructed parenchyma, volume loss and pleural thickening were higher significantly. Cavities in MDR-TB were thick-wall in the background of consolidation, while NTM cavities were more thin-walled with adjacent satellite nodules in same segment or lobe. Prevalence of bronchiectasis was similar in both groups, while bronchiectasis in MDR-TB group was in fibrobronchiectatic background in upper lobes, and in NTM group the distribution was more uniform with slightly middle lobes predominance. Prevalence and distribution of nodular infiltrations were similar more in Tree in Buds and scattered pattern. Calcified or non-calcified lymph nodes and also pleural changes were more frequent in MDR-TB but prevalence of lymphadenopathy was mildly higher in NTM.
Conclusion
A check-list with multiple variables is helpful for differentiation between the two groups.
Keywords: MDR-TB, NTM, Tuberculosis
Introduction
Tuberculosis (TB) is rated as second cause of death among infectious disease following AIDS.1 In 2009 about 1.7 million people died from tuberculosis and multidrug resistant-TB (MDR-TB) itself was responsible for 150,000 deaths in 2008.2 95% of pulmonary mycobacterial infections are caused by mycobacterium tuberculosis (MTB) and 5% by non-tuberculous mycobacteria (NTM).3
As a consequence of the increasing AIDS incidence, prevalence of MDR-TB and also non-tuberculous mycobacterial infection are rising. On the other hand incomplete treatment of TB makes drug resistance more likely by spot mutation in mycobacterium genome. Also, immunosuppressed patients like who are recipient of solid organ or myelolymphoproliferative cells transplant and patients with lymphoma or leukemia and those under corticosteroid treatment are more susceptible to NTM. However NTM can be pathogenic in normal hosts or in those with pulmonary disease.1 According to the definition released by WHO, MDR-TB is referred to infections caused by mycobacterium resistant to isoniazid and rifampin.2
NTM is an environmental organism that lives in soil and water and its infection has different clinical manifestations in patients. However, the lung seems to be the most common site of involvement, same as MTB.4 Since pathologic findings of NTM and MTB regarding granulomatous inflammation and even cavity are very similar, it is difficult to distinguish them from pulmonary TB. Also, findings in chest radiography and CT-scan are similar.5 Diagnosis of NTM and MTB begins with isolating acid fast bacilli (AFB) from sputum but to confirm diagnosis and recognize species sputum culture is required which often takes at least 2–3 weeks, especially in the case of NTM.6, 7 Similar laboratory, radiological and clinical findings in MTB and NTM, and also failure to first line anti-TB treatment in MDR-TB and NTM lead to misdiagnosis and delayed treatment with increased chance of pathogen spread.5, 8 The focus of this study is to provide more details of radiological CT-scan findings in these two groups of mycobacterial infection to reach earlier diagnosis of species.
Materials and methods
This retrospective study evaluates suspected patients of MDR-TB referred to Masih Daneshvari hospital admitted between 2006 and 2010. First sputum samples were positive for AFB and after failure to first line anti-TB treatment, patients were referred to the hospital as suspicious of MDR-TB. 66 patients were enrolled in the study, all anti-HIV negative. After performing PCR, MDR-TB was confirmed in 43, and NTM in 23 cases. Spiral CT-scan without contrast was performed in all patients during hospital admission and 35 imaging factors were compared between the two groups, reported as seen or not seen in each CT-scan. Initially both groups were assessed in terms of age, gender, history of smoking and anti-TB treatment. Chest CT-scans were observed by two radiologists, experts in chest radiography, unaware of the mycobacterium species, and results were reported by consensus. Table 1, Table 2 demonstrate variables and results. Additionally, five variables including bronchiectasia, peribronchial wall thickening, single cavity, multiple cavity, and consolidation were evaluated in terms of lobar distribution (in six lobes) (Table 3).
Table 1.
Comparing variables.
| Variable | NTM | MDR-TB | p-value |
|---|---|---|---|
| Sex | 34.8 male 65.2 female |
58 male 42 female |
0.07 |
| Age (mean age) | 51.57 | 44.86 | – |
| History of smoking | 26.1 | 20.9 | 0.6 |
| Previous treatment | 56.5 | 83.7 | 0.01* |
NTM, non-tuberculous mycobacteria; MDR-TB, multidrug-resistant TB. All numbers show percentage within each group (MDR & NTM groups).
MDR-TB > NTM.
Table 2.
Chest CT scan findings.
| CT findings | NTM | MDR-TB | p-value |
|---|---|---|---|
| Parenchyma | |||
| Fibrodestruction | 17.4 | 65.1 | 0.001* |
| Calcified parenchyma | 8.7 | 39.5 | 0.008* |
| Volume loss | 17.4 | 53.5 | 0.004* |
| Cavitary lesion | 69.6 | 76.7 | 0.5 |
| Multiple cavities | 56.5 | 60.5 | 0.7 |
| Single cavity | 13 | 14 | 0.9 |
| Thin wall cavity | 65.2 | 46.5 | 0.1 |
| Thick wall cavity | 26.1 | 58.1 | 0.01* |
| Cavitary consolidation | 0 | 44.2 | 0.001* |
| Cavity + satellite nodules | 39.1 | 9.3 | 0.004* |
| Nodular infiltration | 69.6 | 76.7 | 0.5 |
| Tree-in-bud | 47.8 | 46.5 | 0.9 |
| Scattered | 47.8 | 60.54 | 0.3 |
| Labor | 13 | 9.3 | 0.6 |
| Cavitary nodules | 21.7 | 27.9 | 0.6 |
| Macro nodules | 43.5 | 25.6 | 0.1 |
| Miliary pattern | 0 | 0 | – |
| Bronchiectasis | 87 | 79 | 0.4 |
| PBWT | 43.5 | 58.1 | 0.2 |
| Consolidation | 34.8 | 37.2 | 0.8 |
| Emphysema | 4.3 | 7 | 0.6 |
| Mediastinum | |||
| Calcified lymph node | 52.8 | 88.4 | 0.001* |
| Non calcified lymph node | 0 | 14 | 0.06 |
| LAP (hilar & mediastinal) | 26 | 11.6 | 0.2 |
| Pericardium pleura | |||
| Pleural effusion | 4.3 | 20.9 | 0.07 |
| Loculated pleural effusion | 4.3 | 11.6 | 0.3 |
| Pleural thickening | 21.7 | 58.1 | 0.005* |
| Pleural calcification | 0 | 2.3 | 0.4 |
| Pericardial effusion & thickening | 4.3 | 4.7 | 0.9 |
NTM, non-tuberculous mycobacteria; MDR-TB, multidrug-resistant TB; PBWT, peribronchial wall thickening; LAP, lymphadenopathy. All numbers show percentage within each group (MDR & NTM groups).
MDR-TB > NTM.
Table 3.
Lobar distribution of parenchymal lesions.
| MDR (n = 43), NTM (n = 23) | RUL | RML | LUL | Lin | LLL | RUL |
|---|---|---|---|---|---|---|
| Bronchiectasis | ||||||
| MDR | 68 | 26 | 21 | 42 | 30 | 28 |
| NTM | 31 | 57 | 44 | 22 | 39 | 39 |
| p-value | 0.004* | 0.01** | 0.05** | 0.1 | 0.4 | 0.3 |
| Peribronchial thickening | ||||||
| MDR | 42 | 19 | 16 | 26 | 19 | 21 |
| NTM | 13 | 35 | 18 | 4 | 13 | 18 |
| p-value | 0.01* | 0.1 | 0.9 | 0.03* | 0.5 | 0.7 |
| Single cavity | ||||||
| MDR | 5 | 0 | 0 | 5 | 0 | 5 |
| NTM | 9 | 0 | 0 | 4 | 0 | 0 |
| p-value | 0.5 | – | – | 0.9 | – | – |
| Multiple cavities | ||||||
| MDR | 51 | 9 | 23 | 44 | 19 | 16 |
| NTM | 26 | 22 | 26 | 48 | 26 | 31 |
| p-value | 0.05* | 0.1 | 0.7 | 0.7 | 0.4 | 0.1 |
| Consolidation | ||||||
| MDR | 30 | 14 | 23 | 16 | 12 | 14 |
| NTM | 13 | 26 | 9 | 4 | 9 | 18 |
| p-value | 0.1 | 0.2 | 0.1 | 0.1 | 0.7 | 0.7 |
NTM, non-tuberculous mycobacteria; MDR-TB, multidrug-resistant TB; RUL, right upper lobe; RML, right middle lobe; RLL, right lower lobe; LUL, left upper lobe; lin, lingular segment; LLL, left lower lobe. All numbers show percentage within each group (MDR & NTM groups).
MDR-TB > NTM.
NTM > MDR-TB.
Descriptive statistical analysis was conducted for all variables. Variables were compared by the chi-square test and p-value less than 0.05 was considered statistically significant. Data analysis was carried out using SPSS version 17.
This study was approved by the ethic committee of Masih Daneshvari Hospital.
Results
After performing PCR and culture for 66 patients suspected of MDR-TB, 43 cases proved to be MDR-TB and 23 cases NTM. Demographic characteristics and CT-scan changes are presented in Table 1, Table 2. Mean age of NTM was shortly higher than MDR-TB (52 versus 45 years). There were no significant differences in terms of gender and smoking history; however, history of previous anti-TB treatment was significantly more common in the MDR group.
Most common CT-scan findings in MDR patients in order of prevalence were: hilar or mediastinal calcified lymph node, bronchiectasis, nodular infiltration and cavity, and fibrodestructive changes. In the NTM group the findings were bronchiectasis, nodular infiltration and cavity, and hilar or mediastinal calcified lymph node.
Chronic changes like fibrodestruction, calcified parenchyma, volume loss, and pleural thickening were significantly more common in MDR-TB group (Fig. 1).
Fig. 1.
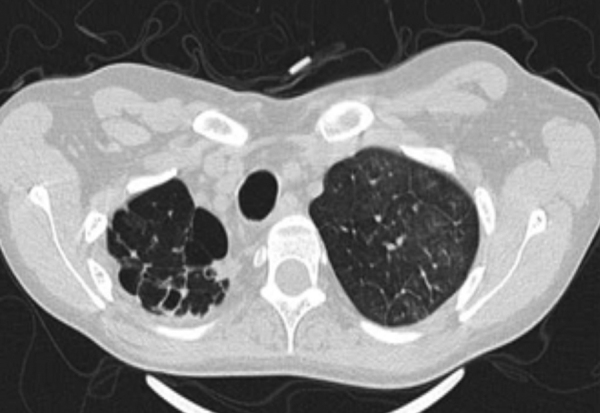
Fibrocavitary changes and volume loss of right lung apex.
Cavities were more prevalent in MDR-TB and they appeared mostly in multiple patterns in both groups.
Thick wall cavities were significantly more common in the MDR group, whereas thin wall cavities slightly more common in the NTM group (Fig. 2). From another point of view, cavities of the MDR group mostly appear as cavitary consolidation while in the NTM group as cavities with satellite nodules, with significant difference between these two groups (Fig. 3). Multiple cavities in the NTM group have more homogenous lobar distribution whereas in the MDR group cavities were significantly more common in the right upper lobe (RUL) than in the middle and inferior lobes. Also multiple cavities in RUL were notably more frequent in MDR group than NTM group.
Fig. 2.
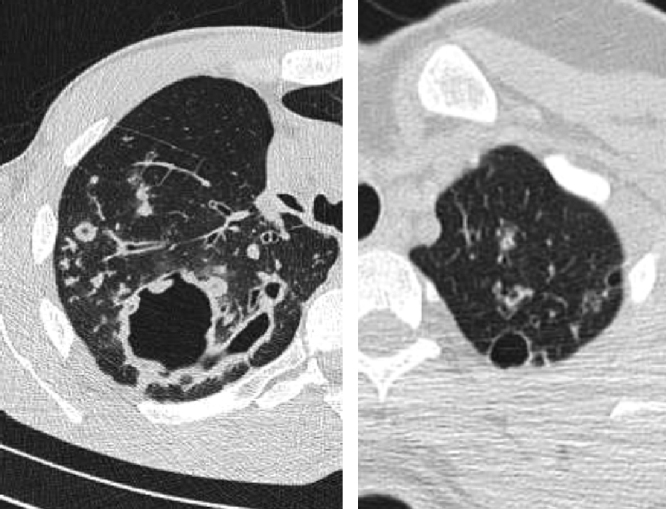
Thick wall cavity (left) and thin wall cavity (right); note nodular infiltration adjacent to cavities.
Fig. 3.
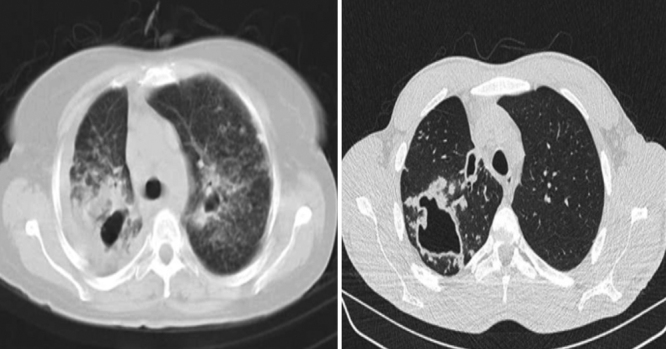
Cavitary consolidation (left) and cavity with satellite nodules (right).
No considerable difference in shape and prevalence of nodular infiltration were detected between these groups; however, nodules often presented in the form of Tree in Buds (TIB) and scattered pattern (Fig. 4).
Fig. 4.
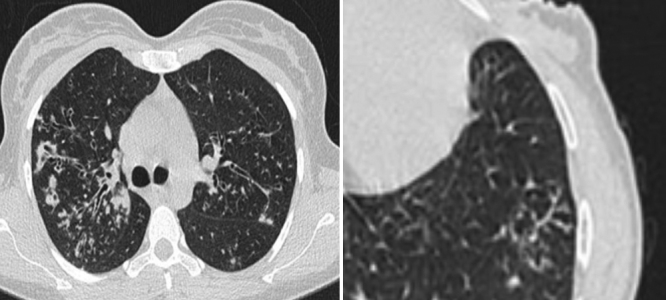
Nodular infiltration and bronchiectasis in NTM (left) and Tree in Buds (right).
There was no significant difference associated to bronchiectasis and PWBT prevalence between these groups. However, in the MDR group bronchiectasis and PWBT were more common in superior lobes, and RUL involvement was significantly different from middle and inferior lobes. In NTM group middle and inferior lobes were more affected by bronchiectasis and PWBT, but not significantly (Fig. 5). In terms of lobar involvement, bronchiectasis in right middle lobe (RML) and right lower lobe (RLL) strongly suggests NTM, and bronchiectasis in RUL and PBWT in superior lobes strongly supports diagnosis of MDR-TB.
Fig. 5.

Middle and lower lobes bronchiectasis.
Prevalence and distribution pattern of consolidation between the two groups were not notably different.
All changes related to pleura were more frequent in MDR-TB, but only higher prevalence of pleural thickening in MDR-TB showed significant difference. 4.3% of NTM patients had pleural effusion, all loculated, while pleural effusion occurred in 21% of MDR-TB cases, with almost 12% being loculated (Fig. 6). Hilar and mediastinal lymph node involvement, calcified or non-calcified were more common in MDR-TB but LAP (lymph node with short axis > 10 mm) were more prevalent in NTM cases than MDR-TB cases.
Fig. 6.
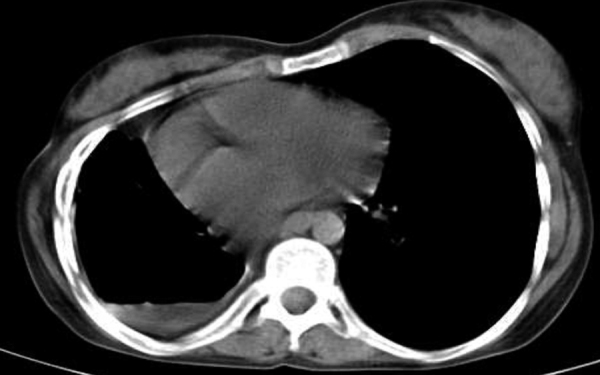
Loculated hydropneumothorax.
Discussion
Comparison of chest imaging between the groups of MDR-TB and NTM in early stages of diagnosis can differentiate these two groups. Unfortunately, there are not enough studies comparing imaging findings of NTM and MTB, especially MDR-TB, so we hope this study to contribute to the field. As in similar studies, mean age of patients with NTM was higher.7, 9 Among patients with AFB-positive sputum age can be a predictive factor for NTM disease.9 There was no significant difference in terms of gender, but history of anti-TB treatment in MDR-TB patients was more common compared with NTM patients and these results, associated with gender and history of anti-TB treatment, are reported in another study comparing NTM and drug-sensitive TB.9
In this study there were no significant differences between bronchiectasis and PWBT incidence between these two groups; however, middle lobes (RML and lingula) in NTM group and superior lobes, specially RUL, in MDR-TB cases were more affected. It seems that bronchiectasis in the MDR-TB group often happens in the presence of fibro bronchiectatic and fibrodestructive changes which clarifies why superior lobes are more affected.
In 1999 Park and his colleagues showed that peribronchial wall thickening in right and left superior lobes was seen more often in MDR-TB. Proximal airways wall thickening in TB patients is very prominent10 and is seen as decreased lumen width with irregular bronchial wall thickening which can lead to bronchiectasis particularly in superior lobes.11 We had a similar finding in this study as well. Nonetheless, it is still an issue of controversy if bronchiectasis is a predisposing factor for NTM or a consequence of that. Meanwhile some findings show that bronchiectasis progresses with increasing speed in patients with NTM pulmonary infection. In several studies bronchiectatic lesions and multiple pulmonary nodules specially in RML and lingula proved to be an important characteristic of NTM, and it is estimated to be present in over 50% or even two third of NTM patients.4, 7, 9
According to Chung et al. in 2006, bronchiectasis is widely reported in NTM and multiple cavities are more reported in MDR-TB.7 Furthermore, in a study in Iran in 2003 by Zahirifard et al., multiple cavities turned out as important characteristic of MDR-TB since TB bacilli can settle there rising the risk of MDR-TB.12
It is told that multiple cavities are even more common in MDR-TB than in drug-sensitive TB: 40% in MDR-TB versus 11% in drug-sensitive TB according to a study.13 In this study multiple cavities were more common in MDR-TB, but neither statistically significant nor differentiating. This different result is probably caused by long delay of NTM species diagnosis and can manifest that multiple cavities can also be produced by NTM in case of chronic illness without any appropriate treatment. Anyway, it seems that shape and distribution of cavities are more differentiating and reliable factor because NTM causes thin wall cavities mostly with satellite nodules in the related segment, but MDR-TB cavities are mostly lying within pulmonary consolidation with thick walls.
Martinez et al. believe that due to slower progression of disease, cavities seen in NTM are smaller and have thinner wall in comparison with post-primary TB.14 Likewise similar study by Burrill et al. demonstrated that cavities found in post-primary TB usually happen in case of pulmonary consolidation and have irregular thick walls.11
This study also suggests similar conclusion about MDR-TB patients since most of enrolled patients as MDR-TB had history of treatment or previous TB. There was not any cavitary consolidation in our NTM group while almost half of MDR-TB cases had it. Another study demonstrated that the appearance of cavitary consolidation in MDR-TB patients who were for at least one month on anti-TB treatment strongly suggests reactivation of TB.15 In both groups multiple cavities were more common than single, but with more homogenous lobar distribution in NTM patients versus superior lobes involvement specially RUL in MDR-TB due to the pathogenicity of mycobacterium tuberculosis in superior lobes and segments. We found consolidation in all lobes in both groups, but no priority in terms of morbidity rate. Likewise, no significant difference in this aspect was obtained in a study comparing imaging findings between NTM and drug-sensitive TB.9 This comparison can also be generalized to MDR-TB since consolidation is seen in both MDR-TB and drug-sensitive TB with no significant difference.12, 16
There was not any significant difference regarding pleural effusion despite being more common in MDR-TB. Other studies mentioned that pleural effusion does not commonly occur in NTM9 and even TB should be considered immediately after finding pleural effusion in imaging17 particularly because it is one of the most common manifestations in MDR-TB too.12
In our study pleural thickening was seen much more common in MDR-TB cases than NTMs. In general the pleura thickens gradually in post-primary TB and it can even lead to tuberculosis empyema and bronchopleural fistula.11 If pleural thickening occurs in NTM, it is mostly seen in the apices and also in presence of cavitation.18 Remission of tuberculosis lesions leaves fibrotic scars and calcification and, ultimately pulmonary volume loss.19 In pulmonary TB, lymph node calcification following infection and inflammation mostly occurs in thoracic and abdominal lymph nodes and to some extent it is a common finding which can be single or multiple, semi lateral or bilateral.20 Unfortunately, few studies are conducted comparing fibrotic changes and calcification in these two diseases. We found in this study that lymph nodes and parenchymal tissue calcification, fibrodestruction and subsequent pulmonary volume loss is more common in MDR-TB and lesser fibrotic changes were seen in NTM.
Conclusion
In spite of lots of imaging similarity between two groups of MDR-TB and NTM, some radiologic findings in AFB-positive patients with failure to respond to first line anti-TB treatment can help in earlier differentiation between these two groups. Multiple thick wall cavities dominant in superior lobes, especially if occurring within parenchymal consolidation with simultaneous chronic changes like fibrodestruction and volume loss and calcified parenchyma and pleural thickening strongly suggest MDR-TB while bronchiectasis in middle lobes specially RML and also in RLL and coexistence of multiple thin wall cavities uniformly scattered in the lungs with satellite nodules strongly suggest NTM infection, particularly when there is not any evidence of chronicity in parenchyma and pleura and mediastinum.
Conflict of interest
All authors declare to have no conflict of interest.
References
- 1.Ellis S.M. The spectrum of tuberculosis and non-tuberculous mycobacterial infection. Eur Radiol. 2004;14:34–42. doi: 10.1007/s00330-003-2042-1. [DOI] [PubMed] [Google Scholar]
- 2.WHO Tuberculosis fact sheet. Tuberculosis global facts. Available from: http://www.who.int/tb/publications/2010/factsheet_tb_2010.pdf.
- 3.Madkour M.M. Springer-Verlag; Berlin, Heidelberg: 2004. Tuberculosis. p. 360. [Google Scholar]
- 4.Agrawal A. Imaging in nontuberculous mycobacterial lung infections. Medscape; 2003. Available from: http://emedicine.medscape.com/article/358828-overview.
- 5.Gentry ChA, Pharm D. Atypical mycobacteria. Pharmacotherapy Self-Assessment Program. 5th ed. p. 99. Available from: http://www.accp.com/docs/bookstore/psap/p5b6sample02.pdf.
- 6.Eisenhuber E., Mostbeck G., Bankier A., Stadler A., Rumetshofer R. Radiologic diagnosis of lung tuberculosis. Radiologe. 2007;47:393–400. doi: 10.1007/s00117-006-1458-4. [DOI] [PubMed] [Google Scholar]
- 7.Chung M.J., Lee K.S., Koh W.J., et al. Drug-sensitive tuberculosis, multidrug-resistant tuberculosis, and nontuberculous mycobacterial pulmonary disease in nonAIDS adults: comparisons of thin-section CT findings. Eur Radiol. 2006;16:1934–1941. doi: 10.1007/s00330-006-0174-9. [DOI] [PubMed] [Google Scholar]
- 8.Kendall B.A., Varley C.D., Choi D., et al. Distinguishing tuberculosis from nontuberculous mycobacteria lung disease, Oregon, USA. Emerg Infect Dis. 2011;17:506–509. doi: 10.3201/eid1703.101164. [DOI] [PMC free article] [PubMed] [Google Scholar]
- 9.Koh W.J., Yu C.M., Suh G.Y., et al. Pulmonary TB and NTM lung disease: comparison of characteristics in patients with AFB smear-positive sputum. Int J Tuberc Lung Dis. 2006;10:1001–1007. [PubMed] [Google Scholar]
- 10.Park S., Hong Y.K., Joo S.H., Choe K.O., Cho S.H. CT findings of pulmonary tuberculosis presenting as segmental consolidation. J Comput Assist Tomogr. 1999;23:736–742. doi: 10.1097/00004728-199909000-00019. [DOI] [PubMed] [Google Scholar]
- 11.Burrill J., Williams C.J., Bain G., Conder G., Hine A.L., Misra R.R. Tuberculosis: a radiologic review. Radiographics. 2007;27:1255–1273. doi: 10.1148/rg.275065176. [DOI] [PubMed] [Google Scholar]
- 12.Zahirifard S., Amiri M.V., Bakhshayesh Karam M., Mirsaeidi S.M., Ehsanpour A., Masjedi M.R. The radiological spectrum of pulmonary multidrug-resistant tuberculosis in HIV-negative patients. Iran J Radiol. 2003;1:161–166. [Google Scholar]
- 13.Scott M. Radiographic patterns in multidrug-resistant and extensively drug resistant tuberculosis in HIV-positive patients in South Africa. Available from: http://www.biomath.info/Protocols/Duke/docs/ScottMichelle.pdf.
- 14.Martinez S., McAdams H.P., Batchu C.S. The many faces of pulmonary nontuberculous mycobacterial infection. AJR Am J Roentgenol. 2007;189:177–186. doi: 10.2214/AJR.07.2074. [DOI] [PubMed] [Google Scholar]
- 15.Jeong Y.J., Lee K.S. Pulmonary tuberculosis: up-to-date imaging and management. AJR Am J Roentgenol. 2008;191:834–844. doi: 10.2214/AJR.07.3896. [DOI] [PubMed] [Google Scholar]
- 16.Cha J., Lee H.Y., Lee K.S., et al. Radiological findings of extensively drug-resistant pulmonary tuberculosis in non-AIDS adults: comparisons with findings of multidrug-resistant and drug-sensitive tuberculosis. Korean J Radiol. 2009;10:207–216. doi: 10.3348/kjr.2009.10.3.207. [DOI] [PMC free article] [PubMed] [Google Scholar]
- 17.Palomino JC, Leão SC, Ritacco V. Tuberculosis 2007: from basic science to patient care. 1st ed. Available from: www.TuberculosisTextbook.com.
- 18.Müller N.L., Franquet T., Lee K.S., Silva C.I.S. 1st ed. Lippincott Williams & Wilkins; Philadelphia: 2006. Imaging of pulmonary infections. [Google Scholar]
- 19.Hatipoğlu O.N., Osma E., Manisali M., et al. High resolution computed tomographic findings in pulmonary tuberculosis. Thorax. 1996;51:397–402. doi: 10.1136/thx.51.4.397. [DOI] [PMC free article] [PubMed] [Google Scholar]
- 20.Kara I., Yeler D., Yeler H., Ay S. Panoramic radiographic appearance of massive calcification of tuberculous lymph nodes. J Contemp Dent Pract. 2008;1(9):108–114. [PubMed] [Google Scholar]