Abstract
Breast cancer (BC) is considered the second commonest human carcinoma and the most incident and mortal in the female population. Despite promising treatments for breast cancer, mortality rates of metastatic disease remain high. Gasdermin C (GSDMC) is an affiliate of the gasdermin (GSDM) family, which is involved in the process of pyroptosis. Pyroptosis is implicated in tumorigenesis, but the role of GSDMC in cancer cells is yet to be fully elucidated. In this study, we investigated the role and mechanism of GSDMC in breast cancer. We conducted a pan-cancer analysis of the expression and prognosis of GSDMC utilizing multidimensional data from The Cancer Genome Atlas (TCGA). We investigated GSDMC expression levels in 15 BC tissues and matched adjacent normal tissues by immunohistochemistry (IHC). Further verification was performed in the Gene Expression Omnibus (GEO) database. We discovered that elevated GSDMC expression was considerably linked to a worse prognosis in breast invasive carcinoma (BRCA). Next, we identified noncoding RNAs (ncRNAs) which contributing to higher expression of GSDMC by a series of expression, survival, and correlation analysis. We finally identified LINC00511/hsa-miR-573 axis to be the most promising ncRNA-associated pathways that account for GSDMC in BRCA. Furthermore, we demonstrated the significant correlations between GSDMC expression and immune infiltrates, immune checkpoints, and immune markers in BRCA. This study illustrated that ncRNAs-mediated upregulation of GSDMC linked to dismal prognosis and also exhibited a correlation with tumor immune cell infiltration in BRCA. It is anticipated to offer novel ideas for the link between pyroptosis and tumor immunotherapy.
Subject terms: Cancer, Computational biology and bioinformatics, Immunology
Introduction
Breast cancer is considered the commonest type of neoplasia in women worldwide and the second most incident and mortal in the human population1–3. Surgery, radiation therapy, chemotherapeutics, and endocrine therapy are traditional treatments for BC4–7. In recent years, molecular phenotyping, genotyping alters the landscape of BC treatment. The treatment of BC is entering a new era of targeted therapy and immunotherapy8–10.
Cell death is an extremely complicated and essential self-destruction biological process that performs the function of maintaining homeostatic balance11,12. In vivo, cell death includes apoptosis, pyroptosis, oncosis, and autophagy13,14. Pyroptosis, a form of programmed necrotic cell death, is essential for enhancing the defense of the host against danger signals and infections12,15. Nevertheless, extreme pyroptosis could also contribute to immunological diseases and septic shock11,16. Pyroptosis is a current research hotspot that involves various diseases and conditions, such as chronic inflammation, cardiovascular diseases, bacterial infections, neurodegenerative diseases, autoimmune diseases, and tumors12,15,17.
The Gasdermin family of proteins are the most important regulators of pyroptosis18–20. 6 members make up the GSDM family in humans and include: GSDMA, GSDMB, GSDMC, GSDMC, GSDME (DFNA5), and GSDMF (DFNB59)19,21. The expression of GSDM family members are highly cell type and tissue-specific, so they have differentiation-status specific roles21,22. GSDM family are a class of pore-forming proteins23. Previous studies have shown that GSDMA, GSDMB, GSDMD, GSDME, and GSDMF perform a crucial function in cell death, inflammation, and autoimmunity19,24. But the biological function of GSDMC has not been identified25.
GSDMC is also known as leucine zipper-containing extranuclear factor26,27. Several investigations show that ultraviolet (UV) radiation increased the expression of GSDMC, and GSDMC may have an instrumental function in the triggering of ERK and JNK pathways which result in UV-induced MMP-1 expression28,29. Some scholars suggest the expression levels of GSDMC may be associated with the development of lumbar spinal stenosis. Past research reports have indicated that GSDMC could have an important function during tumorigenesis including cell proliferation in colorectal cancer as well as enhanced metastatic prospects in melanoma cells28,30. Recent studies demonstrate that the transcription of GSDMC is enhanced by PD-L1 interacts with p-Stat3 as well as its nuclear translocation under hypoxia12. The metabolite α-KG induces death receptor 6-activated caspase-8 which activates the GSDMC-dependent pyroptosis pathway in cancer cells, causing tumor necrosis15. Nevertheless, the exact functions of GSDMC are still inadequately investigated and need to be further elucidated.
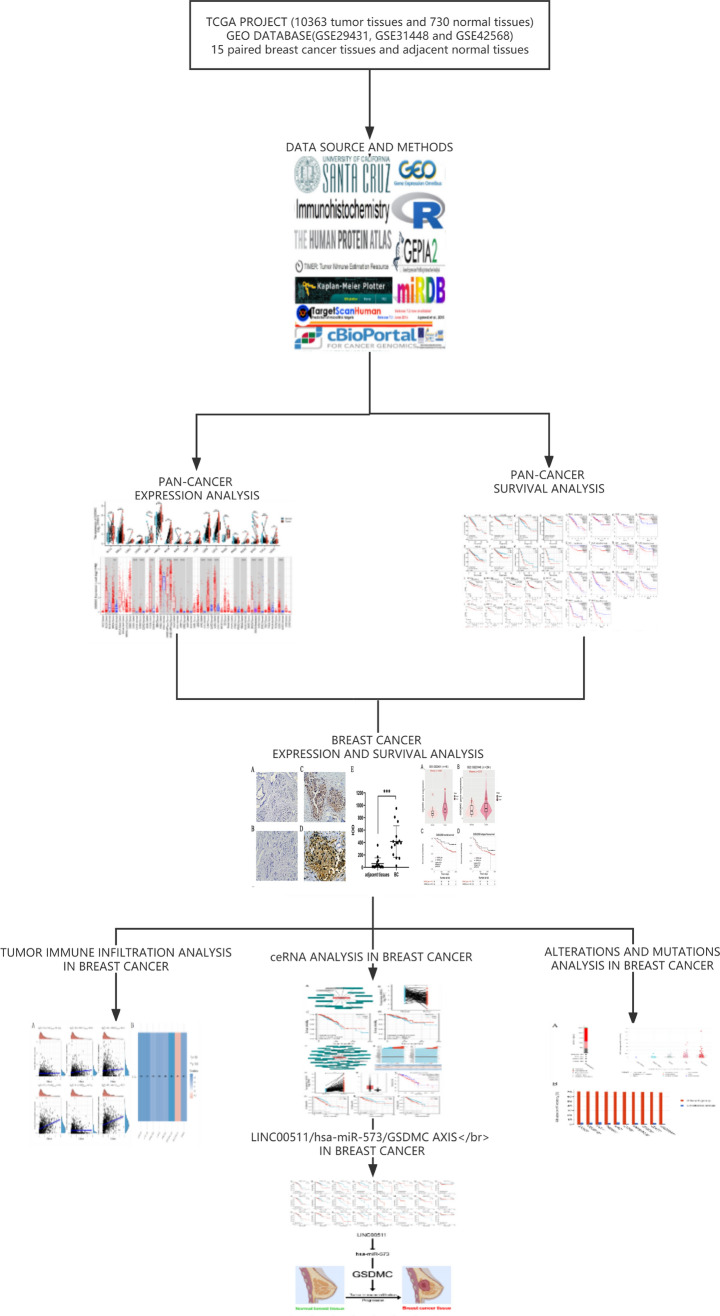
In this research, we systematically examined the GSDMC expression and its link to the prognosis of pan-tumors utilizing multidimensional data from the TCGA and GEO databases. Validation immunohistochemical experiments were performed. Next, we identified microRNAs (miRNAs) and long noncoding RNAs (lncRNAs) that accounts for GSDMC in BRCA. Furthermore, we demonstrated the associations between GSDMC expression and immune infiltrates, immune checkpoints, and immune markers in BRCA. Finally, we employed the cBioPortal online tool to evaluate modifications, mutations, and pathways of GSDMC in BRCA. This research illustrated that ncRNAs-mediated upregulation of GSDMC was linked to dismal prognosis and also exhibited a correlation with tumor immune cell infiltration in BRCA. Figure 1 exhibited the overall design, workflow and results of this study.
Figure 1.
Analysis workflow and results of this research.
Results
Evaluation of GSDMC expression in different cancers and non-cancer normal tissues
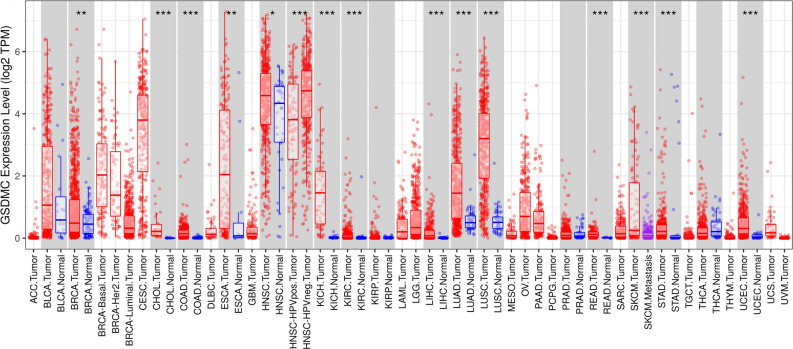
First, via the TCGA dataset, we examined the levels of mRNA expression of GSDMC in 10,363 tumor tissues and 730 adjoining tissues from 18 kinds of cancer. The outcomes illustrated that the levels of GSDMC expression were higher than normal tissues control in BRCA, Cholangio carcinoma (CHOL), colon adenocarcinoma (COAD), Lung squamous cell carcinoma (LUSC), Kidney Chromophobe (KICH), Uterine Corpus Endometrial Carcinoma (UCEC), Rectum adenocarcinoma (READ), Kidney renal clear cell carcinoma (KIRC), Lung squamous cell carcinoma (LUSC), Liver hepatocellular carcinoma (LIHC), and Lung adenocarcinoma (LUAD) (Fig. 2), however, no significant difference of GSDMC in Bladder Cancer (BLCA), stomach adenocarcinoma (STAD), kidney renal papillary cell carcinoma (KIRP), Esophageal carcinoma (ESCA), Pancreatic adenocarcinoma (PAAD), Head and Neck squamous cell carcinoma (HNSC), and thyroid Cancer (THCA) were observed (Fig. 2). In order to validate these, we further assessed how GSDMC expression differs in pan tumor types in TCGA databases via Tumor Immune Estimation Resource (TIMER). In TIMER databases, we found that GSDMC expression was significantly higher in UCEC, BRCA, STAD, CHOL, READ, COAD, ESCA, LUSC, HNSC, LUAD, KICH, LIHC, and KIRC as opposed to adjoining non-cancer normal tissues (Fig. 3). However, GSDMC expression was no significant difference in BLCA, KIRP, prostate adenocarcinoma (PRAD), and THCA as opposed to adjoining non-cancer normal tissues (Fig. 3). Taken together, the upregulation of GSDMC was found in UCEC, BRCA, READ, CHOL, LUSC, COAD, LUAD, KICH, LIHC, and KIRC. These data exhibited differential expressions of GSDMC in these types of cancer.
Figure 2.
The transcription levels of GSDMC in different cancers from TGGA database. *P < 0.05, **P < 0.01, ***P < 0.001.
Figure 3.
GSDMC expression levels in different tumor types from TCGA database were determined by TIMER. *P < 0.05, **P < 0.01, ***P < 0.001.
The correlation between GSDMC expression and cancer patient prognosis
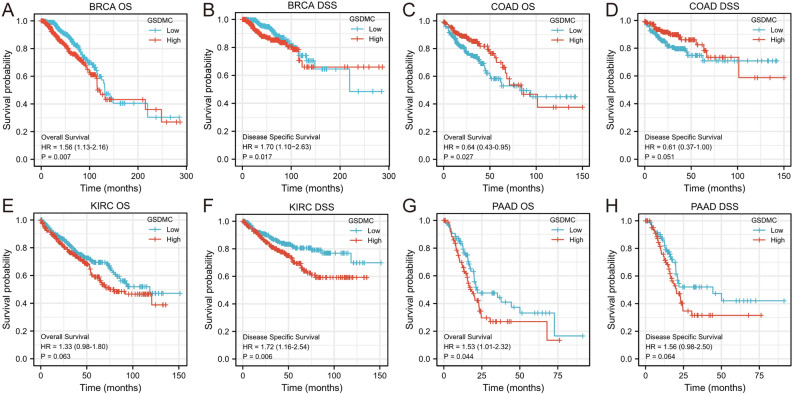
We utilized the KM survival analysis with the log-rank test to assess the correlation between the levels of GSDMC expression and the survival (overall survival (OS) and disease-specific survival (DSS)) of patients in pan-tumors and normal tissue types in the TGGA database (Fig. S1). We found that BRCA, COAD, and PAAD exhibited a considerable relationship between the levels of GSDMC expression and patients' OS, and the levels of GSDMC expression were linked to patients' DSS in BRCA and KIRC (Fig. 4). Higher GSDMC expression levels have significance relationship with poorer prognosis in BRCA (OS, HR 1.56 (1.13–2.16), P = 0.007; DDS, HR 1.70 (1.10–2.63), P = 0.017) (Fig. 4A,B). Elevated levels of mRNA expression in GSDMC were linked to poorer prognosis PAAD (OS, HR 1.53 (1.01–2.32), P = 0.044), but showed no significant correlations with DSS in PAAD (DSS, HR 1.56 (0.98–2.50), P = 0.064) (Fig. 4C,D). In KIRC, high GSDMC expressions were associated with poorer DSS (DSS, HR 1.72 (1.16–2.54), P = 0.006), but no significant associations with OS (OS, HR 1.33 (0.98–1.80), P = 0.063) (Fig. 4E,F). On the contrary, we discovered that elevated expression levels of GSDMC were linked to improved OS in COAD (OS, HR 0.64 (0.43–0.95), P = 0.027), but showed no significant relationships with DSS in COAD (DSS, HR 0.61 (0.37–1.00), P = 0.007) (Fig. 4G,H). No substantial correlations were observed between GSDMC expression levels and patient prognosis in other types of cancers (Fig. S1).
Figure 4.
Prognostic analysis of GSDMC mRNA expression levels in different tumor types in the TCGA database (A–H). *P < 0.05, **P < 0.01, ***P < 0.001. OS overall survival, DSS disease-specific survival.
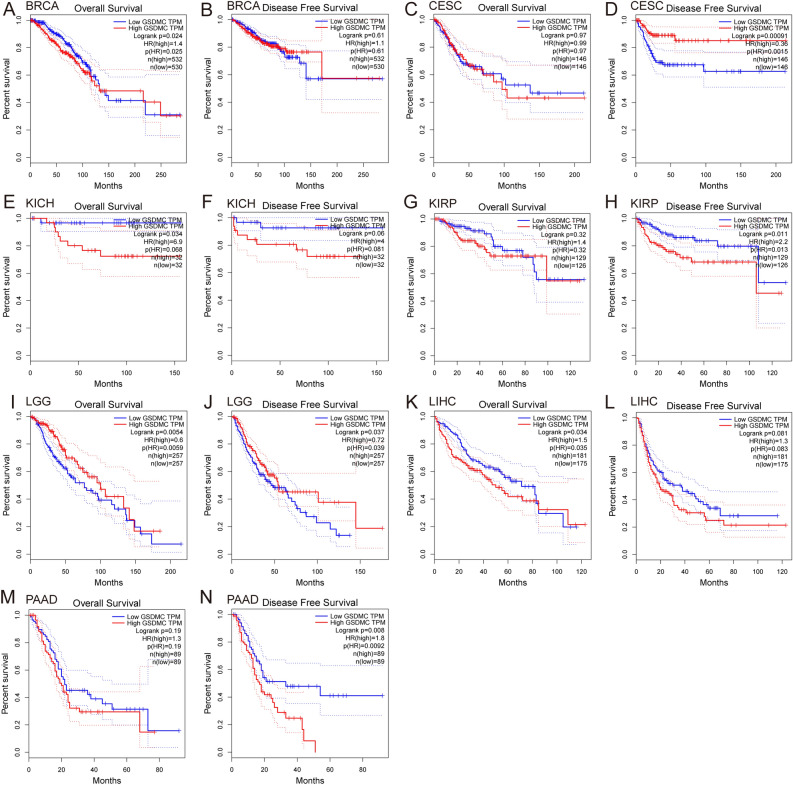
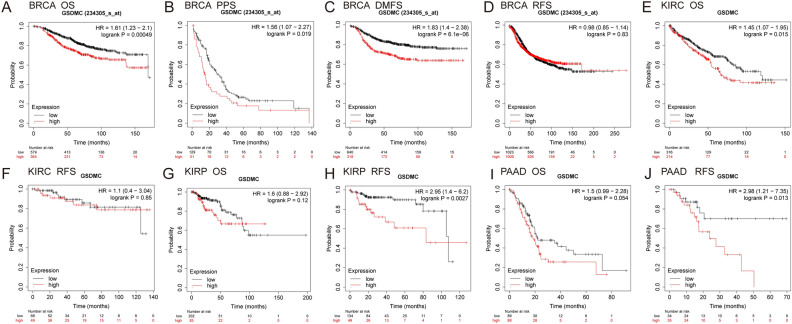
Next, we validated the link between the levels of GSDMC expression and patient prognosis in multiple cancer kinds via the GEPIA database and KM plotter database (Figs. 5, 6, Figs. S2, S3). In GEPIA, we discovered that elevated mRNA expression levels of GSDMC were linked to worse OS in BRCA (OS, HR = 1.4, P = 0.024), KICH (OS, HR 6.9, P = 0.034), LIHC (OS, HR 1.5, P = 0.034) and with poorer DFS in KIRP (DFS, HR 2.2, P = 0.011), and PAAD (DFS, HR 1.8, P = 0.008) (Fig. 5A,E,H,K,N). On the contrary, elevated mRNA expression levels of GSDMC were linked to improved prognosis in LGG (OS HR 0.6, P = 0.0054; DFS, HR = 0.72, P = 0.037) and better DFS (DFS HR 0.36, P = 0.00091) in CESC (Fig. 5D,I,J), but showed no significant correlation in other tumors (Fig. 5B,C,F,G,L,M, Fig. S2). Then we utilized the KM plotter to explore the link between the levels of GSDMC expression and patient prognosis in various pan-cancer types. As depicted in Fig. 6, consistency with the results of above, higher GSDMC expression levels had substantial link to worse prognosis in BRCA (OS, HR 1.61 (1.23–2.1), P = 0.00049; distant metastasis-free survival (DMFS), HR 1.83 (1.4–2.38), P = 0.000061; post-progression survival (PPS), HR 1.56 (1.07–2.27), P = 0.019) (Fig. 6A–C). In PAAD and KIRP, high GSDMC expressions were associated with poorer relapse-free survival (RFS) (PAAD, HR = 2.98 (1.21–7.35), P = 0.013; KIRP, HR 2.95 (1.4–6.2), P = 0.0027), but no significant associations with OS (PAAD, HR 1.5 (0.99–2.28), P = 0.054; KIRP, HR 1.6 (0.88–2.92), P = 0.12) (Fig. 6G–J). Meanwhile, elevated levels of GSDMC expression were linked to improved OS in KIRC (OS, HR 1.45 (1.07–1.95), P = 0.015) (Fig. 6E), but showed no significant relationships with RFS in COAD (RFS, HR 1.1 (0.4–3.04), P = 0.85) (Fig. S3).
Figure 5.
Prognostic analysis of GSDMC mRNA expression levels in various human cancers determined by GEPIA database (A–N). OS overall survival, DFS disease-free survival.
Figure 6.
Kaplan–Meier survival curves comparing the high and low expression of GSDMC in different types of cancers in the Kaplan–Meier plotter databases (A–J). OS overall survival, DFS disease-free survival, RFS relapse-free survival, PPS post-progression survival, DMFS distant metastasis-free survival.
Taken together, the combination of OS, RFS, DSS, DMFS, and PPS and concern of bias, our findings illustrated the expression levels and prognostic value of GSDMC in several kinds of cancers, GSDMC might perform as a negative prognostic biomarker in BRCA patients. However, much further research is needed to investigate the link between the expression of GSDMC and cancer patient prognosis in other kinds of cancers, including PAAD, COAD, KICH, etc.
Protein expression analysis and prognosis analysis of GSDMC in BC
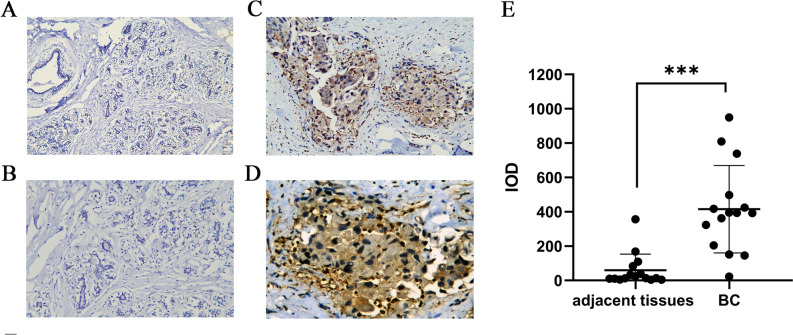
Subsequently, IHC was performed to validate the expression of GSDMC in 15 pairs of BC tumor tissues and corresponding adjacent normal tissues. IHC staining analysis exhibited that GSDMC was mainly localized in the cytoplasm of cancer cells, and brown staining indicated positive staining (Fig. 7C,D). Weak to no expression of GSDMC were observed in the normal tissues (Fig. 7A,B). Statistical analysis revealed that GSDMC was also expressed significantly highly in BC tissues than in the adjacent non-tumor tissues (P < 0.001) (Fig. 7E). Survival analysis showed that high protein expression of GSDMC had worse PFS in BC, however, there was no statistically significant (P > 0.05) (Fig. S4A).
Figure 7.
GSDMC protein expression analysis. (A) GSDMC protein expression in normal breast tissue (× 200 magnification); (B) GSDMC protein expression in normal breast tissue (× 400 magnification); (C) GSDMC protein expression in BC tumor tissue (× 200 magnification); (D) GSDMC protein expression in BC tumor tissue (× 400 magnification); (E) quantification of immunostains for GSDMC by IOD analysis. ***P < 0.001. BC breast cancer.
GSDMC expression and prognosis analysis of BC in GEO database
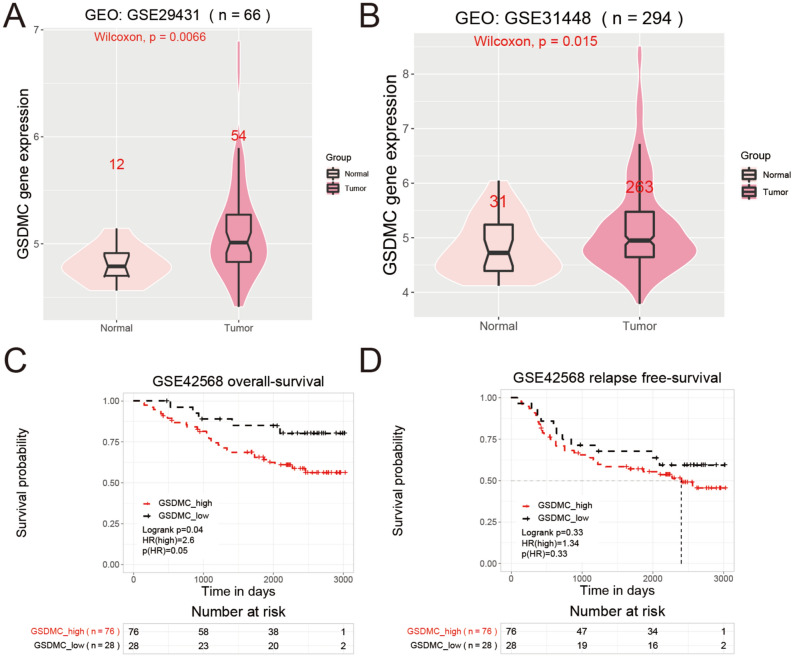
Then, we utilized GEO database to perform expression and survival analyses of GSDMC in BC. Expression analysis indicated that mRNA expression levels of GSDMC were significantly higher in BC tissues than in normal control tissues in GSE29431 and GSE31448 (P < 0.05) (Fig. 8A,B). Survival analysis of GSE42568 exhibited significant relationships between high expressions of GSDMC and worse OS in BC patients (P < 0.05) (Fig. 8C). Whereas high mRNA expressions of GSDMC showed no significant relationships with RFS in BC (P > 0.05) (Fig. 8D). Thus, further experimental validation is needed.
Figure 8.
(A,B) Relative mRNA expression of GSDMC in BC and paired normal tissues from GEO database. ((A) in GSE31192; (B) in GSE42568). (C,D) Kaplan–Meier survival curves comparing the high and low expression of GSDMC in BC from GEO database (in GSE31192).
Prediction and analysis of potential miRNA candidates of GSDMC
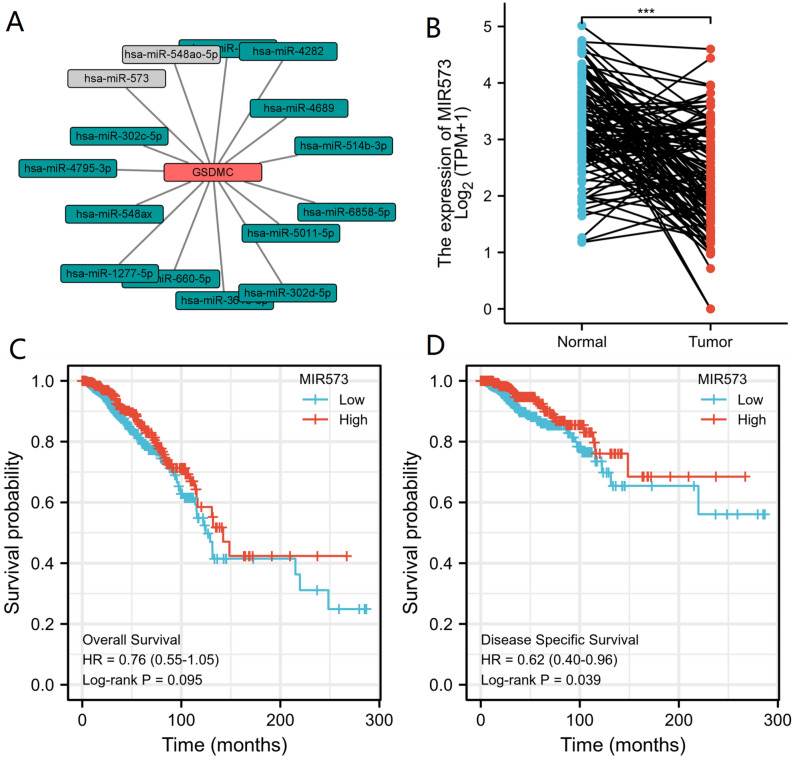
ncRNAs are well-recognized for regulating gene expression at almost every step31–33. In order to determine whether GSDMC was regulated by various ncRNAs in BRCA, we forecasted potential candidate miRNAs that might bind to GSDMC and ultimately identified 15 miRNAs. We used various target gene forecasting website, comprising of miRDB, miRmap, TargetScan, miRcode, miRWalk and DIANA-microT to establish a miRNA-GSDMC regulatory network (Fig. 9A). Because the action mechanism of miRNAs negatively modulates the GSDMC expression at the post-transcriptional level, there should be a negative relationship between GSDMC and miRNA in BRCA. So, we investigated the relationship between GSDMC and 15 miRNAs in BRCA via the TCGA database. As a result, we found that GSDMC was significantly negatively associated with hsa-miR-573 (MIR573) and positively linked to hsa-miR-548ao-5p (MIR548AO) in BRCA (P < 0.001, Fig. 9A, Table 1). Meanwhile, no statistical expression relations were observed between GSDMC and other miRNAs (Fig. 9A, Table 1). Then we explored the miRNA expression levels of hsa-miR-573 in 1109 tumor tissues and 113 adjoining tissues from BRCA in the TGGA dataset. The outcomes indicated that the levels of hsa-miR-573 expression were lower than normal tissue control in BRCA (Fig. 9B). Subsequently, we ascertained the link between hsa-miR-573 expression levels and BRCA patient prognosis in the TCGA database. We discovered that elevated miRNA expression level of hsa-miR-573 was considerably linked to improved DSS in BRCA (DSS, HR 0.62 (0.40–0.92), P = 0.039) (Fig. 9D). Meanwhile, the hsa-miR-573 expression level was linked to improved OS in BRCA, but it was not statistically significant (OS, HR 0.76 (0.55–1.05), P = 0.095) (Fig. 9C). Taking together survival analysis, expression analysis, and correlation analysis, we suggested that hsa-miR-573 might serve as potential regulating miRNA for GSDMC in BRCA.
Figure 9.
(A) miRNA-GSDMC regulatory network; (B) hsa-miR-573 differentially expression levels in normal breast tissues and breast cancer tissues in TCGA database; (C) the overall survival (OS) analysis for hsa-miR-573 in BRCA in TCGA database; (D) the disease-specific survival (DSS) analysis for hsa-miR-573 in BRCA in TCGA database. *P < 0.05, **P < 0.01, ***P < 0.001. OS overall survival, DSS disease-specific survival.
Table 1.
The relationship between of GSDMC expression and potential candidate miRNAs expression in BRCA.
| GENE | miRNA | R-value (Pearson) | P-value (Pearson) | P.adjust | R-value (Spearman) | P-value (Spearman) | P.adjust |
|---|---|---|---|---|---|---|---|
| GSDMC | hsa-miR-4795-3p | − 0.050 | 0.096 | 0.416 | − 0.070 | 0.020* | 0.26 |
| GSDMC | hsa-miR-548ax | 0.026 | 0.394 | 0.7046 | 0.022 | 0.461 | 0.72655 |
| GSDMC | hsa-miR-548ao-5p | 0.214 | < 0.001*** | < 0.001*** | 0.208 | < 0.001*** | < 0.001*** |
| GSDMC | hsa-miR-4689 | 0.010 | 0.744 | 0.806 | 0.021 | 0.475 | 0.7265 |
| GSDMC | hsa-miR-6858-5p | 0.019 | 0.525 | 0.7046 | 0.016 | 0.606 | 0.7457 |
| GSDMC | hsa-miR-302d-5p | − 0.013 | 0.661 | 0.7811 | − 0.034 | 0.260 | 0.7265 |
| GSDMC | hsa-miR-4282 | 0.022 | 0.467 | 0.7046 | − 0.023 | 0.440 | 0.7265 |
| GSDMC | hsa-miR-5011-5p | 0.066 | 0.027 | 0.351 | 0.029 | 0.343 | 0.7265 |
| GSDMC | hsa-miR-302c-5p | − 0.020 | 0.508 | 0.7046 | − 0.029 | 0.330 | 0.7265 |
| GSDMC | hsa-miR-5702 | 0.004 | 0.886 | 0.886 | 0.003 | 0.911 | 0.911 |
| GSDMC | hsa-miR-1277-5p | 0.034 | 0.261 | 0.689 | 0.020 | 0.503 | 0.7265 |
| GSDMC | hsa-miR-660-5p | − 0.033 | 0.265 | 0.689 | − 0.014 | 0.631 | 0.7457 |
| GSDMC | hsa-miR-573 | − 0.209 | < 0.001*** | < 0.001*** | − 0.203 | < 0.001*** | < 0.001*** |
| GSDMC | hsa-miR-3616-5p | 0.018 | 0.542 | 0.7046 | 0.042 | 0.167 | 0.7265 |
| GSDMC | hsa-miR-514b-3p | 0.051 | 0.090 | 0.416 | 0.011 | 0.705 | 0.7637 |
*P < 0.05 (5e-02); **P < 0.01 (1e−02); ***P < 0.001 (1e−03).
Evaluation of potential candidate lncRNAs of hsa-miR-573
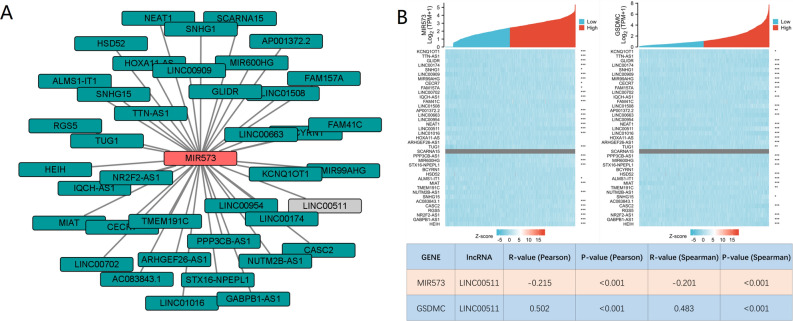
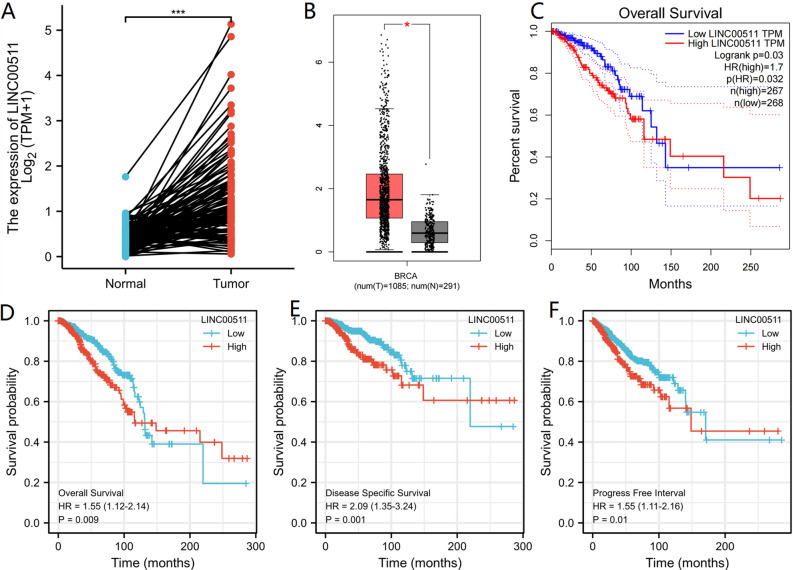
Then we forecasted upstream potential lncRNAs that interact with hsa-miR-573 by using DIANA-LncBase v.2. A total of 39 possible lncRNAs were selected as candidate lncRNAs in breast tissues and mammary gland tissues (Threshold > 7). A lncRNA-hsa-miR-573 regulatory network was visualized using Cystoscope software (Fig. 10A). The competitive endogenous RNA (ceRNA) hypothesis suggests that lncRNA reduces the suppressive miRNA-effect on target-mRNAs. Therefore, in the ceRNA network, lncRNA should be positively correlated with target mRNA while lncRNA should be negatively correlated with target miRNA. Correlation analysis of hsa-miR-573 expression and 39 lncRNAs was done in the TGGA breast cancer database. The results highlighted that only LINC00511 was negatively associated with hsa-miR-573, and positively associated with GSDMC (Fig. 10B). Then we took expression analysis in the TCGA set. As a result, we discovered that the levels of LINC00511 expression were considerably upregulated in BRCA as opposed to normal controls (Fig. 11A). We used the GEPIA database to validate, GEPIA results were consistent with the aforementioned results (Fig. 11B). Subsequently, we assessed the prognostic values of LINC00511 in BRCA. We observed that elevated mRNA expression levels of hsa-miR-573 were considerably linked to poorer OS (HR 1.55 (1.12–2.14), P = 0.009), DSS (HR 2.09 (1.35–3.24), P = 0.001) and (Progress free interval) PFI (HR 1.55 (1.11–2.16), P = 0.01) in BRCA (Fig. 11D–F). In GEPIA database, elevated LINC00511 expression was also substantially linked to worse OS (HR 1.7, P = 0.03) in BRCA (Fig. 11C). External validation was carried out using two GEO databases (GSE29431, GSE42568). In GSE29431, the levels of LINC00511 expression were considerably upregulated in BC as opposed to normal controls (P = 0.00076) (Fig. S4B). The survival analysis showed high expression of LINC00511 might increase the risk of death for BC; however, this was not statistically significant (P = 0.064) (Fig. S4C). Taking into account survival analysis, expression analysis, as well as correlation analysis, LINC00511 might be the key potential upstream lncRNA of the GSDMC/hsa-miR-573 axis in BRCA.
Figure 10.
(A) lncRNA-hsa-miR-573 regulatory network; (B) correlation analysis of hsa-miR-573 expression and 39 lncRNAs in BRCA in TCGA database. *P < 0.05, **P < 0.01, ***P < 0.001.
Figure 11.
(A) LINC00511 differentially expression levels in normal breast tissues and breast cancer tissues in TCGA database; (B) LINC00511 differentially expression levels in normal breast tissues and breast cancer tissues determined by GEPIA database; (C) the overall survival (OS) analysis for hsa-miR-573 in BRCA determined by GEPIA database in TCGA database; (D–F) overall survival (OS), disease-specific survival (DSS) and progress free interval (PFI) analysis for LINC00511 in BRCA in TCGA database. *P < 0.05, **P < 0.01, ***P < 0.001.
Association of GSDMC, hsa-miR-573 and LINC00511 expression levels and prognosis in patients with molecular subtyping of BRCA
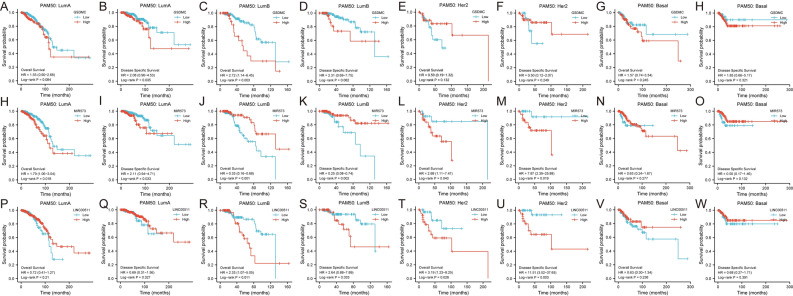
Molecular subtyping provides precision treatment guidance in BRCA. Thus, we utilized KM plotter to assess the association between expression levels of GSDMC, hsa-miR-573, LINC00511 and prognosis in patients with differently molecular subtyping of BRCA (Fig. 12). Interestingly, results showed that only in luminal B BRCA, high mRNA expression levels of GSDMC and LINC00511 were significantly associated with dismal prognosis (P < 0.05), as well as high mRNA expression levels of hsa-miR-573 were significantly correlated with good prognosis (P < 0.05) (Fig. 12C,J,K,R,S). In addition, high expression of GSDMC in luminal A BRCA exhibited a significant correlation with worse DSS rates, and elevated expression of LINC00511 exhibited a significant relationship with higher OS and DSS rate in HER2 enriched BRCA (P < 0.05) (Fig. 12B,T,U). Notably, high mRNA expression levels of hsa-miR-573 exhibited significant correlation with increased OS and DSS rates in luminal A and HER2 enriched BRCA patients (P < 0.05) (Fig. 12H,I,L,M). This intriguing phenomenon requires additional experimental confirmation. No substantial correlations were observed in other types (Fig. 12A,E–H,N,O–Q,V,W).
Figure 12.
Association of GSDMC, hsa-miR-573 and LINC00511 expression levels and prognosis in patients with molecular subtyping of BRCA (A–W). LumA luminal A, LumB luminal B, N normal-like, Her2 Her-2 enrichment, Basal basal-like breast cancer.
The expression of GSDMC associated with immune cell infiltration in BRCA
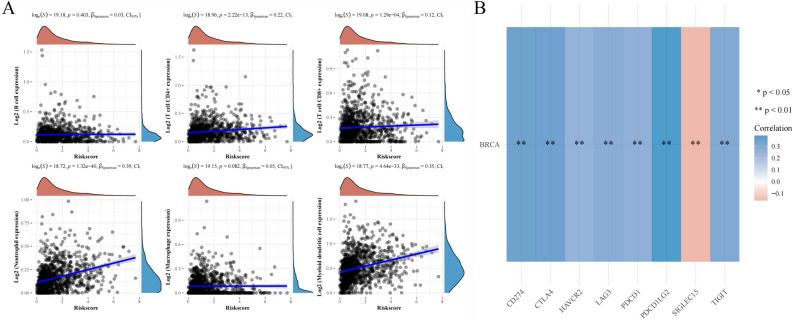
GSDMC, which belongs to the Gasdermin superfamily, is believed to participate in the modulation of epithelial cell immune-related functions30. Therefore, we examined the link between the levels of GSDMC expression and immune cell infiltration in BRCA. The observed finding suggested that GSDMC expression were considerably correlated with the level of CD4+ T cells (R = 0.22, P = 2.22e−13), CD8 + T cells level (R = 0.12, P = 1.29e−04), level of neutrophils (R = 0.39, P = 1.32e−40), level of myeloid dendritic cells (R = 0.35, P = 4.64e−33), whereas no association was observed with the levels of B cells and macrophages in BRCA (Fig. 13A). These results illustrated that GSDMC performed a vital function in the regulation of immune cell infiltration in BRCA. In BRCA, GSDMC had a specifically solid function in tumor purity and the infiltration of myeloid dendritic cells, neutrophils. CD4+ T cells, and CD8+ T cells.
Figure 13.
(A) The relationship between GSDMC expression levels and immune cell infiltration in BRCA via TCGA database; (B) the relationship between GSDMC expression levels and immune checkpoints in BRCA via TCGA database. *P < 0.05, **P < 0.01, ***P < 0.001.
The link between GSDMC and immune markers expression in BRCA
Considering that GSDMC performs a crucial function in the modulation of immune cell infiltration in BRCA, we explored the link between the expression of GSDMC and various immunological markers subsets such as M1 and M2 macrophages, exhausted T cells, total B cells, T cells, TAMs, monocytes, CD8+ T cells, natural killer cells (NK cells), neutrophils, myeloid dendritic cells (MDCs), tfh cells, Tregs, Th17 cells Th1 cells, and Th2 cells by the TIMER databases, Tumor purity were adjusted. Our finding showed significant positive correlations between GSDMC expression and B cells (CD19, CD79A), T cells (CD2, CD3D, CD3E), CD8+ T cell (CD8A, CD8B), Treg markers (CCR8, FOXP3), monocyte markers (CD86, CD115), Th17 markers (IL17A, STAT3), TAM markers (IL10, CD68, CCL2), Th2 markers (IL13, STAT5A) M1 macrophage markers (COX2, IRF5), M2 macrophage markers (MS4A4A, VSIG4, CD163), NK cell markers (KIR2DL1, KIR2DL3, KIR2DL4, KIR3DL1, KIR3DL2, KIR3DL3, KIR2DL4), neutrophils markers (CCR7, CD11b), DC markers (CD11C, HLA-DQB1, HLA-DRA, HLA-DPA1, BDCA-4, HLA-DPB1), Th1 markers (TNF-α, STAT1, IFN-γ, STAT4, T-bet), Tfh markers (IL21), T cell exhaustion markers (GZMB, TIM-3, LAG3, CTLA4, PD-1) in BRCA (P < 0.01, Table 2). Remarkably, in BRCA, the levels of GSDMC expression were considerably negatively linked to Th2 markers (GATA3, STAT6) (P < 0.01, Table 2). These findings supported that GSDMC was considerably related to immune infiltrating cells as well as the immune microenvironment in BRCA.
Table 2.
Correlation analysis between GSDMC and relate genes and markers of immune cells in TIMER.
| Description | Gene markers | BRCA | |||||
|---|---|---|---|---|---|---|---|
| None | P | P.adjust | Purity | P | P.adjust | ||
| Cor | Cor | ||||||
| CD8 + T cell | CD8A | 0.168 | 2.05e−08*** | 2.73E−08 | 0.098 | 2.06e−03* | 0.002507826 |
| CD8B | 0.218 | 2.81e−13 | 7.15E−13 | 0.157 | 6.55e−07*** | 1.53E−06 | |
| T cell (general) | CD3D | 0.225 | 4.60e−14*** | 1.29E−13 | 0.15 | 2.05e−06*** | 3.59E−06 |
| CD3E | 0.213 | 9.85e−13*** | 2.12E−12 | 0.136 | 1.73e−05*** | 2.85E−05 | |
| CD2 | 0.24 | 7.77e−16*** | 3.11E−15 | 0.171 | 5.58e−08*** | 1.56E−07 | |
| B cell | CD19 | 0.2 | 2.24e−11*** | 3.69E−11 | 0.118 | 1.85e−04** | 0.000259 |
| CD79A | 0.194 | 8.35e−11*** | 1.30E−10 | 0.116 | 2.49e−04** | 0.000332 | |
| Monocyte | CD86 | 0.29 | 9.83e−23*** | 9.17E−22 | 0.247 | 2.48e−15*** | 2.31E−14 |
| CD115 (CSF1R) | 0.154 | 2.68e−07*** | 3.13E−07 | 0.085 | 7.38e−03* | 0.007653333 | |
| TAM | CCL2 | 0.347 | 1.92e−32*** | 5.38E−31 | 0.229 | 5.30e−22*** | 1.48E−20 |
| CD68 | 0.256 | 6.32e−18*** | 2.95E−17 | 0.216 | 6.15e−12*** | 2.87E−11 | |
| IL10 | 0.265 | 3.91e−19*** | 2.74E−18 | 0.221 | 1.69e−12*** | 9.46E−12 | |
| M1 Macrophage | INOS (NOS2) | 0.071 | 1.83e−02 | 0.0183 | 0.065 | 4.06e−02 | 0.0406 |
| IRF5 | 0.145 | 1.33e−06*** | 1.49E−06 | 0.109 | 5.76e−04** | 0.000733091 | |
| COX2 (PTGS2) | 0.238 | 1.27e−15*** | 4.45E−15 | 0.182 | 7.92e−09*** | 3.17E−08 | |
| M2 Macrophage | CD163 | 0.263 | 6.83e−19*** | 3.82E−18 | 0.224 | 8.70e−13*** | 6.09E−12 |
| VSIG4 | 0.168 | 2.15e−08*** | 2.74E−08 | 0.121 | 1.23e−04** | 0.000181263 | |
| MS4A4A | 0.205 | 6.16e−12*** | 1.08E−11 | 0.155 | 9.27e−07*** | 1.83E−06 | |
| Neutrophils | CD66b (CEACAM8) | 0.078 | 9.91e−03* | 0.0102 | 0.087 | 6.10e−03* | 0.006569231 |
| CD11b (ITGAM) | 0.21 | 2.03e−12*** | 3.79E−12 | 0.156 | 7.43e−07*** | 1.60E−06 | |
| CCR7 | 0.178 | 2.50e−09*** | 3.50E−09 | 0.095 | 2.80e−03* | 0.003266667 | |
| Naturalkiller cell | KIR2DL1 | 0.18 | 1.84e−09*** | 2.71E−09 | 0.155 | 9.81e−07*** | 1.83E−06 |
| KIR2DL3 | 0.217 | 3.34e−13*** | 7.79E−13 | 0.177 | 1.98e−08*** | 6.16E−08 | |
| KIR2DL4 | 0.321 | 1.06e−27*** | 1.48E−26 | 0.279 | 3.39e−19*** | 4.75E−18 | |
| KIR3DL1 | 0.212 | 1.12e−12*** | 2.24E−12 | 0.163 | 2.38e−07*** | 6.06E−07 | |
| KIR3DL2 | 0.232 | 6.20e−15*** | 1.93E−14 | 0.177 | 1.87e−08*** | 6.16E−08 | |
| KIR3DL3 | 0.109 | 2.96e−04** | 0.0003 | 0.09 | 4.74e−03* | 0.0053088 | |
| KIR2DS4 | 0.167 | 2.58e−08*** | 3.14E−08 | 0.133 | 2.69e−05*** | 4.18E−05 | |
| Dendritic cell | HLA-DPB1 | 0.141 | 2.83e−06*** | 3.73E−06 | 0.047 | 1.37e−01 | 0.137 |
| HLA-DQB1 | 0.185 | 6.81e−10*** | 1.04E−09 | 0.121 | 1.27e−04** | 0.000167409 | |
| HLA-DRA | 0.24 | 7.54e−16*** | 1.68E−15 | 0.17 | 7.09e−08*** | 1.37E−07 | |
| HLA-DPA1 | 0.157 | 1.68e−07*** | 2.44E−07 | 0.075 | 1.75e−02 | 0.019519231 | |
| BCDA-1 (CD1C) | 0.042 | 1.63e−01 | 0.163 | − 0.084 | 8.02e−03* | 0.0093032 | |
| BDCA-4 (NRP1) | 0.126 | 2.87e−05*** | 3.40E−05 | 0.086 | 6.65e−03* | 0.008035417 | |
| CD11c (ITGAX) | 0.247 | 8.33e−17*** | 2.20E−16 | 0.19 | 1.59e−09*** | 3.84E−09 | |
| Th1 | T-bet (TBX21) | 0.232 | 7.09e−15*** | 1.47E−14 | 0.163 | 2.24e−07*** | 3.82E−07 |
| STAT4 | 0.227 | 2.37e−14*** | 4.58E−14 | 0.17 | 7.58e−08*** | 1.37E−07 | |
| STAT1 | 0.248 | 7.94e−17*** | 2.20E−16 | 0.225 | 6.55e−13*** | 1.90E−12 | |
| IFN-γ (IFNG) | 0.292 | 4.57e−23*** | 1.89E−22 | 0.245 | 4.22e−15*** | 1.68E−14 | |
| TNF-α (TNF) | 0.281 | 2.10e−21*** | 7.61E−21 | 0.245 | 4.64e−15*** | 1.68E−14 | |
| Th2 | GATA3 | 0.498 | 4.89e−70*** | 1.42E−68 | − 0.472 | 2.37e−56*** | 6.87E−55 |
| STAT6 | 0.201 | 1.54e−11*** | 2.63E−11 | − 0.237 | 4.13e−14*** | 1.33E−13 | |
| STAT5A | 0.126 | 2.93e−05*** | 3.40E−05 | 0.068 | 3.17e−02 | 0.034048148 | |
| IL13 | 0.191 | 1.61e−10*** | 2.59E−10 | 0.157 | 6.78e−07*** | 1.09E−06 | |
| Tfh | BCL6 | 0.081 | 7.06e−03* | 0.007582963 | 0.054 | 9.08e−02 | 0.094042857 |
| IL21 | 0.213 | 1.02e−12*** | 1.85E−12 | 0.179 | 1.34e−08*** | 2.78E−08 | |
| Th17 | STAT3 | 0.127 | 2.24e−05*** | 2.82E−05 | 0.112 | 3.95e−04** | 0.000498043 |
| IL17A | 0.15 | 5.54e−07*** | 7.65E−07 | 0.129 | 4.46e−05*** | 6.81E−05 | |
| Treg | FOXP3 | 0.311 | 4.90e−26*** | 3.55E−25 | 0.254 | 4.14e−16*** | 2.00E−15 |
| CCR8 | 0.299 | 3.56e−24*** | 2.06E−23 | 0.263 | 3.71e−17*** | 2.69E−16 | |
| STAT5B | 0.095 | 1.55e−03* | 0.001728846 | − 0.123 | 1.07e−04** | 0.000147762 | |
| TGFβ (TGFB1) | 0.046 | 1.30e−01 | 0.134642857 | − 0.128 | 5.25e−05*** | 7.61E−05 | |
| T cell exhaustion | PD-1 (PDCD1) | 0.245 | 1.56e−16*** | 3.77E−16 | 0.182 | 7.80e−09*** | 1.74E−08 |
| CTLA4 | 0.344 | 5.46e−32*** | 5.28E−31 | 0.299 | 6.23e−22*** | 6.02E−21 | |
| LAG3 | 0.297 | 7.47e−24*** | 3.61E−23 | 0.26 | 8.25e−17 | 4.79E−16 | |
| TIM-3 (HAVCR2) | 0.248 | 8.13e−17*** | 2.20E−16 | 0.212 | 1.43e−11*** | 3.77E−11 | |
| GZMB | 0.361 | 3.63e−35*** | 5.26E−34 | 0.311 | 1.00e−23*** | 1.45E−22 | |
BRCA breast invasive carcinoma, TAM tumor-correlated macrophage, Tfh follicular helper T cell, Th T helper cell, Treg regulatory T cell.
Cor, R value of Spearman’s correlation; None, correlation without adjustment. Purity, correlation adjusted by purity. *P < 0.01 (1e−02); **P < 0.001 (1e−03); ***P < 0.0001 (1e−04).
The relationship between GSDMC and immune checkpoints in BRCA
SIGLEC15, PDCD1LG2 (PD-L2), TIGIT, PDCD1 (PD-1), CD274 (PD-L1), CTLA4, LAG3, and HAVCR2 (TIM3) are transcripts related to immunological checkpoints that perform a vital function in tumor immune evasion. Taking into account that GSDMC might be the potential oncogene in BRCA, the relationship of GSDMC with PDCD1LG2, SIGLEC15, LAG3, TIGIT, CTLA4, CD274, PDCD1, and HAVCR2 were assessed. As a result, we found that the expression levels of GSDMC were a significant positive correlation with PDCD1LG2, TIGIT, LAG3, CD274, CTLA4, HAVCR2, and PDCD1 in BRCA (Fig. 13B). On the contrary, GSDMC expression was a significant positive correlation with SIGLEC15 in BRCA (Fig. 13B). These findings indicated that tumor immune evasion and antitumor immunity might be implicated in GSDMC facilitated carcinogenic processes of BRCA.
Alterations and mutations in GSDMC and its frequently altered neighbor genes in BRCA
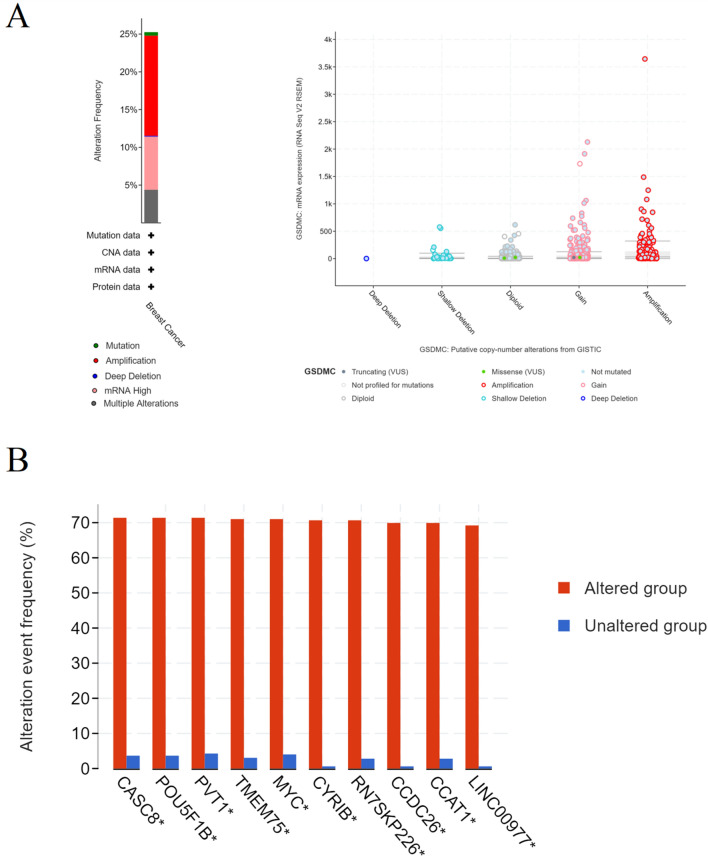
We utilized the cBioPortal online tool to assess GSDMC alterations in the BRCA dataset (TCGA, Firehose Legacy). GSDMC altered in 25% of 1108 patients with BRCA (Fig. 14A). We also calculated putative copy-number alterations (CNA) and mutations from GISTIC of GSDMC in BRCA (Fig. 14A). Next, we constructed the 10 most commonly modified neighbor genes for GSDMC in BRCA (Fig. 14B). The findings illustrated that GSDMC alterations were considerably correlated with the cancer-related genes in BRCA, including CASC8, POU5F1B, PVT1, TMEM75, MYC, CYRIB, RN7SKP226, CCDC26, CCAT1, and LINC00977 (Fig. 14B).
Figure 14.
(A) GSDMC alterations in BRCA; (B) the 10 most frequently altered neighbor genes for GSDMC in BRCA (cBioPortal). *P < 0.05, **P < 0.01, ***P < 0.001.
Discussion
Breast cancer is the considered highest incident cancer type and the first contributor to cancer-associated fatality in women worldwide10,34. Based on molecular phenotyping and genotyping, targeted therapies and immunotherapy of BC have rapidly evolved in recent years1,5,9. However, mortality rates of BRCA remain high and treatments are limited2,35.
Early studies have demonstrated that pyroptosis is correlated to tumors14,36. Pyroptosis can enhance antitumor immunity for its immunogenic nature37. Recently research demonstrates pyroptosis of tumor cells may overcome tumor cells’ apoptosis resistance and promotes antitumor immunity38,39. However, the specific mechanism of tumors pyroptosis remains poorly understood.
GSDMC, as an affiliate of the GSDM family, is mainly expressed in the skin, spleen, trachea, intestines, bladder, and gastrointestinal26,28,40. Some studies suggest that GSDMC expression level is correlated with some tumors, such as lung adenocarcinoma, metastatic melanoma, esophageal cancer, and gastric cancer29,40–42. The latest study indicates that GSDMC and PD-L1 can lead to necrosis of breast cancer tissue by switching apoptosis to pyroptosis in the hypoxic area12. But the molecular mechanism of GSDMC in tumors is poorly understood.
In this research, we assessed the mRNA expression levels of GSDMC in pan-tumors and matching non-cancer normal tissues utilizing TGGA and TIMER databases. Taken together, upregulation of GSDMC was found in UCEC, BRCA, READ, CHOL, LUSC, COAD, LUAD, KICH, LIHC, and KIRC. These data together with some studies mentioned above suggested that GSDMC might serve as the pivotal player in the carcinogenesis of these kinds of cancer27,28,40. Next, we carried out a pan-cancer survival analysis of the expression of GSDMC utilizing the TCGA database, after which the GEPIA database and KM plotter were employed for validation. Finally, a combination of the expression and prognostic significance of GSDMC in several kinds of cancers, we found that elevated expression of GSDMC might play as an unfavorable prognostic biomarker in BRCA patients. IHC analysis of 15 pairs of BC tumor tissues and corresponding adjacent normal tissues also revealed significantly higher expression of GSDMC in BC tissues than normal tissues. Furthermore, GSDMC expression and prognosis analysis of BC in GEO database showed the same results. Thus, further experimental validation is needed to investigate the link between the expression of GSDMC and the prognosis of cancer patients in BC and other kinds of cancers, including PAAD, COAD, KICH, etc.
It has been well documented that ceRNA theory explains interactions among mRNA and ncRNAs (miRNAs, lncRNAs, and circular RNAs (circRNAs))32,43. LncRNAs affects the miRNA affinity of target mRNA by attaching to similar miRNA response elements, thereby regulating gene expression at the transcriptional level31,33. We predicted potential miRNA candidates of GSDMC via several target gene prediction websites, consisting of miRDB, miRmap, TargetScan, miRcode, miRWalk, and DIANA-microT, and finally found 15 miRNAs. We found that GSDMC was only significantly negatively associated with hsa-miR-573 (MIR573) and positively linked to hsa-miR-548ao-5p (MIR548AO) in BRCA (P < 0.001). Meanwhile, no statistical expression link was observed between GSDMC and other miRNAs. The observed findings also illustrated that the levels of hsa-miR-573 expression were lower than normal tissue control in BRCA. Next, our survival analysis showed that hsa-miR-573 acting as tumor-suppressive miRNAs in BRCA. Taking together correlation analysis, expression analysis, and survival analysis, we suggested that hsa-miR-573 might serve as the most potential regulatory miRNA of GSDMC in BRCA. Early research also showed that hsa-miR-573 was a negative regulator of cell proliferation, migration, and invasion of pancreatic cancer44,45.
Then we selected 39 potential candidate lncRNAs that interacted with hsa-miR-573 by using DIANA-LncBase v.2. Based on ceRNA hypothesis proposes, there ought to be a positive relationship between potential lncRNA and GSDMC and negative relationship between potential lncRNA and hsa-miR-573, and it should be oncogenic lncRNAs in BRCA. By correlation analysis, survival analysis, and expression analysis, LINC00511 was chosen as the key potential upstream lncRNA of GSDMC/hsa-miR-573 axis in BRCA. In early studies, LINC00511 was determined as oncogenic lncRNAs in several tumors, including gastric cancer, lung squamous cell carcinoma, cervical cancer, bladder carcinoma, glioma, and breast cancer46–50. Taken together, LINC00511/hsa-miR-573/GSDMC axis was well identified as potential regulatory pathways in BRCA (Fig. 15).
Figure 15.
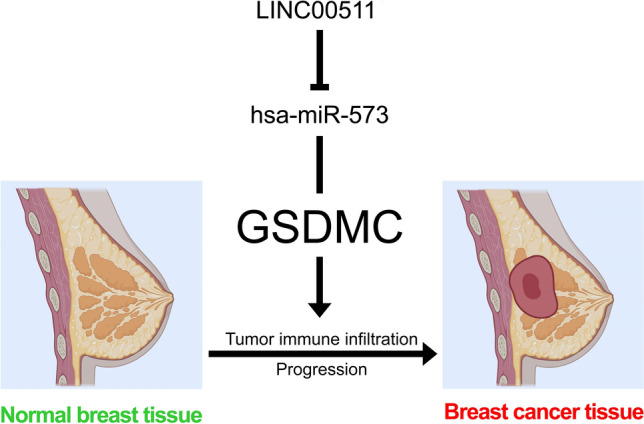
The model of LINC00511/GSDMC/hsa-miR-573 axis in carcinogenesis of BRCA.
It is well known that breast cancer is a highly clinical and molecular heterogeneous disease. For this reason, we performed prognostic analysis of GSDMC, hsa-miR-573 and LINC00511 in patients with differently molecular subtyping of BRCA. The results indicated that LINC00511/hsa-miR-573/GSDMC axis might act in luminal B BRCA. Additional research would be necessary.
As an affiliate of the Gasdermin superfamily, GSDMC participated in the modulation of epithelial cell immune-related activities. Therefore, for another crucial facet of this study, we explored the link between GSDMC and tumor immune infiltration in BRCA. The tumor immune cell infiltration is an indispensable component of the tumor immune microenvironment which is closely associated with tumor progression, clinical outcomes as well as immunotherapy responses51,52. Our research showed a considerable correlation between levels of GSDMC expression and immune cell infiltration of myeloid dendritic cells, CD4+ T cells, CD8+ T cells, and neutrophils in BRCA. Moreover, we discovered considerable positive associations between GSDMC expression and several immunological biomarkers of these infiltrated immune cells. Some reports also found that GSDMC performed an instrumental function in adaptive immune responses30. These results indicated that GSDMC assumed a vital function in modulating immune cell infiltration in BRCA, with specifically powerful influence on CD4+ T cells, CD8+ T cells, myeloid dendritic cells, and neutrophils.
Immunological and T-cell-infiltrated tumors respond favorably to inhibition of immunological checkpoints, and anti-tumor immune response may be amplified through blocking of immune checkpoints53,54. SIGLEC15, PDCD1LG2 (PD-L2), TIGIT, PDCD1 (PD-1), HAVCR2 (TIM3), CTLA4, LAG3, and CD274 (PD-L1) are transcripts related to immunological checkpoints that have a function in tumor immune evasion. As a result, we found that, besides SIGLEC15, the levels of GSDMC expression were considerably positively associated with the 5 immune checkpoints in BRCA. Hou et al. identified a non-immunological checkpoint role of PD-L1 and found GSDMC/caspase-8 cause tumour necrosis via mediate a non-canonical pyroptosis pathway in cancer cells. Our research could provide more clues for GSDMC/PD-L1 therapeutic strategies. All these outcomes illustrated that tumor immune evasion and antitumor immunity might be implicated in GSDMC mediated carcinogenic processes of BRCA.
Besides, we explored alterations and mutations in GSDMC and its frequently altered neighbor genes in BRCA, then found that GSDMC alterations were considerably correlated with the cancer-associated genes in BRCA, including CASC8, POU5F1B, PVT1, TMEM75, MYC, CYRIB, RN7SKP226, CCDC26, CCAT1 and LINC00977.
In summary, we discovered that elevated GSDMC expression was considerably linked to a worse prognosis in BRCA. Next, we identified a LINC00511/hsa-miR-573/GSDMC axis as potential regulatory pathways in BRCA. For another important aspect of this research, our research demonstrated that GSDMC was a pivotal player in BC carcinogenesis via elevating tumor immune cell infiltration and the expression of immunological checkpoints. It is expected to provide new ideas for the link between pyroptosis and tumor immunotherapy. Nonetheless, this process requires much more fundamental research and extensive clinical trials.
Materials and methods
Data processing and differential expression analysis, survival analysis and correlation analysis
The UCSC Xena dataset was used to acquire TCGA and GTEx expression and clinical information (https://toil-xena-hub.s3.us-east-1.amazonaws.com/download/TcgaTargetGtex_rsem_gene_tpm.gz; Full metadata)55. Dataset ID: TcgaTargetGtex_rsem_gene_tpm. Raw counts of RNA-sequencing data (level 3) and matching clinical data contains 10,363 tumor tissues and 730 adjacent tissues from 18 types of cancer. In BRCA, we obtained 1109 breast cancer tissues and 113 adjoining tissues. Three independent BRCA gene expression profiles (GSE29431, GSE31448 and GSE42568) were downloaded from the Gene Expression Omnibus (GEO) database (https://www.ncbi.nlm.nih.gov/geo/) and processed for analysis56. Detailed information of datasets was listed in Table S1. All analytical methods were carried out utilizing the R software version v4.0.3. Expression analysis and Survival curves were drawn using the R packages “ggplot2”, “survival”, and “survminer”. The Log-rank tests as well as the univariate Cox proportional hazards regression generated hazard ratio (HR) and P-values with a confidence interval (CI) of 95% in KM curves. The R package “ggstatsplot” was used to analyze two-gene correlations. To examine the link between quantitative variables, Spearman’s correlation or Pearson correlation analysis was utilized.
Tissue samples
15 paired breast cancer tissues and adjacent normal tissues were collected from Liuzhou People’s Hospital. A total of 15 patients had undergone surgery, and received chemoradiotherapy or induction chemotherapy. Relevant clinical data was shown in Table S2. This study was approved by the Ethics Committee of Liuzhou People’s Hospital (Reference No. KY2021-021-01), and was performed according to the Declaration of Helsinki. All tissues were pathologically examined.
Immunohistochemistry (IHC) analysis
Formalin fixed paraffin-embedded tissues (4 µm thick) were analyzed by IHC with GSDMC antibody (1:50; Affinity, China) and horseradish peroxidase conjugated secondary antibodies (Maxim, China). For IHC quantification, the sections were analyzed using DM2000 LED microscope (Leica, Germany) and three randomly selected areas were photographed. The diagnoses were confirmed by three pathology specialists. The integral optical density (IOD) was determined by the Image-Pro Plus 6.0 software (Media Cybernetics, USA).
TIMER database analysis
TIMER (https://cistrome.shinyapps.io/timer/) dataset comprise six tumor-infiltrating immune subsets57. The levels of six subsets are precalculated for 10,897 tumors in 32 kinds of cancer from the TCGA. The database analyzed gene expression and tumor immune infiltration (Dendritic cells, Macrophages, Neutrophils, B cells, CD4+ T cells, and CD8+ T cells) in a variety of cancers. We examined the mRNA expression of GSDMC in pan-cancer patients utilizing the TIMER dataset. Subsequently, we investigated the expression association between GSDMC and specific immune infiltrating cell subsets markers.
GEPIA2 database analysis
Gene Expression Profiling Interactive Analysis (GEPIA) contains the RNA sequence expression information of 9736 tumors and 8587 non-tumor normal specimens from the TCGA and GTEx projects, which is used to analyze its standard processing pipelines58. GEPIA2 (http://gepia2.cancer-pku.cn/) is an updated version of GEPIA. We used GEPIA2 to determine the connection between the mRNA expression of GSDMC and patient prognosis in pan-cancers. We also examined the expression of LINC00511 and hsa-miR-573 in BRCA and adjoining tissues and the link between the levels of mRNA expression of hsa-miR-573 and LINC00511 and BRCA patient prognosis.
Kaplan–Meier plotter analysis
Kaplan–Meier plotter (KM plotter; http://kmplot.com/analysis/) is a commonly used online repository that explores the influence of multiple genes on the prognosis of 21 distinct kinds of cancers in a huge sample size. KM plotter contains survival data and microarray gene expression information derived from the TCGA, Gene Expression Omnibus (GEO), and European Genome-Phenome Archive59. We investigated the predictive values of GSDMC in pan-cancers utilizing KM plotter. We also analyze the prognostic values of hsa-miR-573 and LINC00511 in BRCA patients.
Candidate miRNA prediction
We predicted potential miRNA candidates of GSDMC via various target gene forecasting website, comprising of miRDB (http://mirdb.org/)60, miRmap (https://mirmap.ezlab.org/app/)61, TargetScan (http://www.targetscan.org/vert_71/)62, miRcode (http://www.mircode.org/index.php?gene=gsdmc&mirfam=&class=&cons=&trregion=), miRWalk (http://zmf.umm.uni-heidelberg.de/apps/zmf/mirwalk2/generetsys-self.html)63 and DIANA-microT (http://diana.imis.athena-innovation.gr/DianaTools/index.php?r=microT_CDS/results&keywords=ENSG00000147697&genes=ENSG00000147697%20&mirnas=&descr=&threshold=0.7)64. For subsequent analyses, we chose miRNAs candidates which, as indicated above, were often found in over three systems. These projected miRNAs were therefore chosen as GSDMC miRNAs candidates.
DIANA-LncBase v2 database analysis
DIANA-LncBase v2 database (http://carolina.imis.athena-innovation.gr/diana_tools/web/index.php?r=lncbasev2%2Findex-predicted) is a database for assessing the link between lncRNAs and miRNAs65. LncBase Predicted v.2 was introduced to predicted potential candidate lncRNAs that interact with hsa-miR-573 in breast tissues and mammary gland tissues (Threshold > 7).
Immune cell infiltration and immune checkpoints analysis
The TCGA database was utilized to retrieve raw counts of RNA-sequencing data (level 3) in which contains 1109 BC tissues and 113 adjoining tissues. We investigated immune cell infiltration and immunological checkpoints of GSDMC in BRCA utilizing R packages “immunedeconv”, “ggplot2”, “pheatmap”, and “ggstatsplot” to produce accurate immune infiltration estimates. R foundation for statistical computation (2020) version 4.0.3 was utilized to implement all of the aforementioned analytic techniques.
TCGA data and cBioPortal analysis
The cBioPortal for Cancer Genomics supports analysis, visualization, as well as downloading of cancer genomics datasets (http://www.cbioportal.org/)66. The BRCA dataset (TCGA, Firehose Legacy) which contains data of 1108 BRCA patients, was selected for GSDMC analysis via cBioPortal database. The genomic signatures comprised of mutations, putative copy-number alterations (CNA), mRNA expression z-scores (RNA Seq V2 RSEM), and protein expression Z-scores (RPPA) from GISTIC. The computation of co-expression was carried out as per the online instructions of cBioPortal.
Statistical analysis
We analyzed data by a log-rank test, such as fold-change, Hazard ratio (HR), and P-values. We measured the extent of correlation between particular variables via Spearman’s correlation analysis or Pearson correlation analysis, with the r values to measures the relationship strength. P-Value or Log-rank P-value of < 0.05 was judged as having statistical significance.
Ethics approval and consent to participate
This study was approved by the Ethics Committee of Liuzhou People’s Hospital (Reference No. KY2021-021-01), and was performed according to the Declaration of Helsinki. Written informed consent forms were obtained from all subjects.
Supplementary Information
Abbreviations
- BC
Breast cancer
- GSDMC
Gasdermin C
- TCGA
The Cancer Genome Atlas
- ncRNAs
Noncoding RNAs
- IHC
Immunohistochemistry
- GSDM
Gasdermin
- UV
Ultraviolet
- miRNAs
MicroRNAs
- lncRNAs
Long noncoding RNAs
- CI
Confidence interval
- TIMER
Tumor Immune Estimation Resource
- GEPIA
Gene Expression Profiling Interactive Analysis
- KM plotter
Kaplan–Meier plotter
- HNSC
Head and neck squamous cell carcinoma
- KIRC
Kidney renal clear cell carcinoma
- BC
Breast cancer
- RNA Seq V2 RSEM
MRNA expression z-scores
- RPPA
Protein expression Z-scores
- CNA
Copy-number alterations
- ECL
Extracellular loop
- EDG
Endothelial differentiation gene
- GEO
Gene Expression Omnibus
- GEPIA
Gene Expression Profiling Interactive Analysis
- GPCRs
G-protein coupled receptors
- HR
Hazard ratio
- BLCA
Bladder urothelial carcinoma
- BRCA
Breast invasive carcinoma
- KICH
Kidney chromophobe
- KIRP
Kidney renal papillary cell carcinoma
- LIHC
Liver hepatocellular carcinoma
- ESCA
Esophageal carcinoma
- LUAD
Lung adenocarcinoma
- LUSC
Lung squamous cell carcinoma
- PRAD
Prostate adenocarcinoma
- READ
Rectum adenocarcinoma
- UCEC
Uterine corpus endometrial carcinoma
- CHOL
Cholangial carcinoma
- COAD
Colon adenocarcinoma
- CECS
Cervical squamous cell carcinoma and endocervical adenocarcinoma
- STAD
Stomach adenocarcinoma
- DLBC
Lymphoid Neoplasm Diffuse Large B-cell Lymphoma
- THCA
Thyroid carcinoma
- GBM
Glioblastoma multiforme
- PAAD
Pancreatic adenocarcinoma
- THYM
Thymoma
- ACC
Adrenocortical carcinoma
- BLCA
Bladder urothelial carcinoma
- PCPG
Pheochromocytoma and Paraganglioma
- UCEC
Uterine corpus endometrial carcinoma
- UCS
Uterine Carcinosarcoma
- OS
Overall survival
- DFS
Disease-free survival
- RFS
Relapse-free survival
- PPS
Post-progression survival
- DSS
Disease-specific survival
- DMFS
Distant metastasis-free survival
- PFI
Progress free interval
- FP
First progression
- TAM
Tumor-associated macrophages
- NK cells
Natural killer cells
- MDCs
Myeloid dendritic cells
- Tfh
Follicular helper T cell
- Th
T helper cell
- CircRNAs
Circular RNAs
Author contributions
K.S. and Z.L. performed the analysis of the data. K.S., J.L. and R.C. wrote the manuscript. K.S. designed the study. All authors read and approved the manuscript. All authors are consent for the publication of this work.
Funding
This work was supported by grants from Science and Technology Program of Liuzhou (2021CBB0104), the Science and Technology Base and Talent Project of Guangxi (2021AC19414), the Research Fund of Liuzhou People’s Hospital (lry202108), the Talent Introduction Scientific Research Projects Funded Start-Up Funds of Liuzhou People’s Hospital (LRYGCC202114) and Health and Family Planning Commission Foundation of Guangxi (Z2017664).
Data availability
The UCSC Xena dataset was used to acquire TCGA and GTEx expression and clinical information (https://toil-xena-hub.s3.us-east-1.amazonaws.com/download/TcgaTargetGtex_rsem_gene_tpm.gz; Full metadata). Dataset ID: TcgaTargetGtex_rsem_gene_tpm. Raw counts of RNA-sequencing data (level 3) and matching clinical data contains 10,363 tumor tissues and 730 adjacent tissues from 18 types of cancer. All the datasets were retrieved from the publishing literature, so it was confirmed that all written informed consent was obtained.
Competing interests
The authors declare no competing interests.
Footnotes
Publisher's note
Springer Nature remains neutral with regard to jurisdictional claims in published maps and institutional affiliations.
These authors contributed equally: Kai Sun, Jing-zhang Li and Zhan-xiong Luo.
Contributor Information
Kai Sun, Email: sunkai0927@foxmail.com.
Jing-zhang Li, Email: 429299173@qq.com.
Zhan-xiong Luo, Email: luozhanxionglz@yeah.net.
Supplementary Information
The online version contains supplementary material available at 10.1038/s41598-022-19247-9.
References
- 1.Brandão M, Caparica R, Eiger D, de Azambuja E. Biomarkers of response and resistance to PI3K inhibitors in estrogen receptor-positive breast cancer patients and combination therapies involving PI3K inhibitors. Ann. Oncol. 2019;30(Suppl 10):27–42. doi: 10.1093/annonc/mdz280. [DOI] [PMC free article] [PubMed] [Google Scholar]
- 2.Goutsouliak K, Veeraraghavan J, Sethunath V, De Angelis C, Osborne CK, Rimawi MF, et al. Towards personalized treatment for early stage HER2-positive breast cancer. Nat. Rev. Clin. Oncol. 2020;17(4):233–250. doi: 10.1038/s41571-019-0299-9. [DOI] [PMC free article] [PubMed] [Google Scholar]
- 3.Kumar M, Salem K, Tevaarwerk AJ, Strigel RM, Fowler AM. Recent advances in imaging steroid hormone receptors in breast cancer. J. Nucl. Med. 2020;61(2):172–176. doi: 10.2967/jnumed.119.228858. [DOI] [PMC free article] [PubMed] [Google Scholar]
- 4.da Silva JL, Cardoso Nunes NC, Izetti P, de Mesquita GG, de Melo AC. Triple negative breast cancer: A thorough review of biomarkers. Crit. Rev. Oncol. Hematol. 2020;145:102855. doi: 10.1016/j.critrevonc.2019.102855. [DOI] [PubMed] [Google Scholar]
- 5.de Bessa Garcia SA, Araújo M, Pereira T, Mouta J, Freitas R. HOX genes function in breast cancer development. Biochim. Biophys. Acta Rev. Cancer. 2020;1873(2):188358. doi: 10.1016/j.bbcan.2020.188358. [DOI] [PubMed] [Google Scholar]
- 6.Sun K, Cai H, Duan X, Yang Y, Li M, Qu J, et al. Aberrant expression and potential therapeutic target of lysophosphatidic acid receptor 3 in triple-negative breast cancers. Clin. Exp. Med. 2015;15(3):371–380. doi: 10.1007/s10238-014-0306-5. [DOI] [PMC free article] [PubMed] [Google Scholar]
- 7.Sun K, Duan X, Cai H, Liu X, Yang Y, Li M, et al. Curcumin inhibits LPA-induced invasion by attenuating RhoA/ROCK/MMPs pathway in MCF7 breast cancer cells. Clin. Exp. Med. 2016;16(1):37–47. doi: 10.1007/s10238-015-0336-7. [DOI] [PubMed] [Google Scholar]
- 8.Ozawa P, Jucoski TS, Vieira E, Carvalho TM, Malheiros D, Ribeiro E. Liquid biopsy for breast cancer using extracellular vesicles and cell-free microRNAs as biomarkers. Transl. Res. 2020;223:40–60. doi: 10.1016/j.trsl.2020.04.002. [DOI] [PubMed] [Google Scholar]
- 9.Trapani D, Rajasekar A, Mathew A. More options for adjuvant treatment of HER2-positive breast cancer: How to choose wisely. Int. J. Cancer. 2019;145(11):2901–2906. doi: 10.1002/ijc.32418. [DOI] [PubMed] [Google Scholar]
- 10.Zhang X, Su L, Sun K. Expression status and prognostic value of the perilipin family of genes in breast cancer. Am. J. Transl. Res. 2021;13(5):4450–4463. [PMC free article] [PubMed] [Google Scholar]
- 11.Derangère V, Chevriaux A, Courtaut F, Bruchard M, Berger H, Chalmin F, et al. Liver X receptor β activation induces pyroptosis of human and murine colon cancer cells. Cell Death Differ. 2014;21(12):1914–1924. doi: 10.1038/cdd.2014.117. [DOI] [PMC free article] [PubMed] [Google Scholar]
- 12.Hou J, Zhao R, Xia W, Chang CW, You Y, Hsu JM, et al. PD-L1-mediated gasdermin C expression switches apoptosis to pyroptosis in cancer cells and facilitates tumour necrosis. Nat. Cell Biol. 2020;22(10):1264–1275. doi: 10.1038/s41556-020-0575-z. [DOI] [PMC free article] [PubMed] [Google Scholar]
- 13.Teng JF, Mei QB, Zhou XG, Tang Y, Xiong R, Qiu WQ, et al. Polyphyllin VI induces caspase-1-mediated pyroptosis via the induction of ROS/NF-κB/NLRP3/GSDMD signal axis in non-small cell lung cancer. Cancers (Basel) 2020;12(1):193. doi: 10.3390/cancers12010193. [DOI] [PMC free article] [PubMed] [Google Scholar]
- 14.Zhou CB, Fang JY. The role of pyroptosis in gastrointestinal cancer and immune responses to intestinal microbial infection. Biochim. Biophys. Acta Rev. Cancer. 2019;1872(1):1–10. doi: 10.1016/j.bbcan.2019.05.001. [DOI] [PubMed] [Google Scholar]
- 15.Zhang JY, Zhou B, Sun RY, Ai YL, Cheng K, Li FN, et al. The metabolite α-KG induces GSDMC-dependent pyroptosis through death receptor 6-activated caspase-8. Cell Res. 2021;31:980. doi: 10.1038/s41422-021-00506-9. [DOI] [PMC free article] [PubMed] [Google Scholar]
- 16.Tan Y, Sun R, Liu L, Yang D, Xiang Q, Li L, et al. Tumor suppressor DRD2 facilitates M1 macrophages and restricts NF-κB signaling to trigger pyroptosis in breast cancer. Theranostics. 2021;11(11):5214–5231. doi: 10.7150/thno.58322. [DOI] [PMC free article] [PubMed] [Google Scholar]
- 17.Berkel C, Cacan E. Differential expression and copy number variation of gasdermin (GSDM) family members, pore-forming proteins in pyroptosis, in normal and malignant serous ovarian tissue. Inflammation. 2021;44:2203. doi: 10.1007/s10753-021-01493-0. [DOI] [PubMed] [Google Scholar]
- 18.Miao N, Yin F, Xie H, Wang Y, Xu Y, Shen Y, et al. The cleavage of gasdermin D by caspase-11 promotes tubular epithelial cell pyroptosis and urinary IL-18 excretion in acute kidney injury. Kidney Int. 2019;96(5):1105–1120. doi: 10.1016/j.kint.2019.04.035. [DOI] [PubMed] [Google Scholar]
- 19.Tamura M, Shiroishi T. GSDM family genes meet autophagy. Biochem J. 2015;469(2):e5–e7. doi: 10.1042/BJ20150558. [DOI] [PubMed] [Google Scholar]
- 20.Tonnus W, Linkermann A. Gasdermin D and pyroptosis in acute kidney injury. Kidney Int. 2019;96(5):1061–1063. doi: 10.1016/j.kint.2019.07.002. [DOI] [PubMed] [Google Scholar]
- 21.Saeki N, Kuwahara Y, Sasaki H, Satoh H, Shiroishi T. Gasdermin (Gsdm) localizing to mouse Chromosome 11 is predominantly expressed in upper gastrointestinal tract but significantly suppressed in human gastric cancer cells. Mamm. Genome. 2000;11(9):718–724. doi: 10.1007/s003350010138. [DOI] [PubMed] [Google Scholar]
- 22.Katoh M, Katoh M. Evolutionary recombination hotspot around GSDML-GSDM locus is closely linked to the oncogenomic recombination hotspot around the PPP1R1B-ERBB2-GRB7 amplicon. Int. J. Oncol. 2004;24(4):757–763. [PubMed] [Google Scholar]
- 23.Cuevas S, Pelegrín P. Pyroptosis and redox balance in kidney diseases. Antioxid. Redox Signal. 2021;35(1):40–60. doi: 10.1089/ars.2020.8243. [DOI] [PubMed] [Google Scholar]
- 24.Tamura M, Tanaka S, Fujii T, Aoki A, Komiyama H, Ezawa K, et al. Members of a novel gene family, Gsdm, are expressed exclusively in the epithelium of the skin and gastrointestinal tract in a highly tissue-specific manner. Genomics. 2007;89(5):618–629. doi: 10.1016/j.ygeno.2007.01.003. [DOI] [PubMed] [Google Scholar]
- 25.Kovacs SB, Miao EA. Gasdermins: Effectors of pyroptosis. Trends Cell Biol. 2017;27(9):673–684. doi: 10.1016/j.tcb.2017.05.005. [DOI] [PMC free article] [PubMed] [Google Scholar]
- 26.Miguchi M, Hinoi T, Shimomura M, Adachi T, Saito Y, Niitsu H, et al. Gasdermin C is upregulated by inactivation of transforming growth factor β receptor type II in the presence of mutated apc, promoting colorectal cancer proliferation. PLoS ONE. 2016;11(11):e0166422. doi: 10.1371/journal.pone.0166422. [DOI] [PMC free article] [PubMed] [Google Scholar]
- 27.Saeki N, Usui T, Aoyagi K, Kim DH, Sato M, Mabuchi T, et al. Distinctive expression and function of four GSDM family genes (GSDMA-D) in normal and malignant upper gastrointestinal epithelium. Genes Chromosomes Cancer. 2009;48(3):261–271. doi: 10.1002/gcc.20636. [DOI] [PubMed] [Google Scholar]
- 28.Kusumaningrum N, Lee DH, Yoon HS, Kim YK, Park CH, Chung JH. Gasdermin C is induced by ultraviolet light and contributes to MMP-1 expression via activation of ERK and JNK pathways. J. Dermatol. Sci. 2018;90(2):180–189. doi: 10.1016/j.jdermsci.2018.01.015. [DOI] [PubMed] [Google Scholar]
- 29.Kusumaningrum N, Lee DH, Yoon HS, Park CH, Chung JH. Ultraviolet light-induced gasdermin C expression is mediated via TRPV1/calcium/calcineurin/NFATc1 signaling. Int. J. Mol. Med. 2018;42(5):2859–2866. doi: 10.3892/ijmm.2018.3839. [DOI] [PubMed] [Google Scholar]
- 30.Bjornsdottir G, Benonisdottir S, Sveinbjornsson G, Styrkarsdottir U, Thorleifsson G, Walters GB, et al. Sequence variant at 8q24.21 associates with sciatica caused by lumbar disc herniation. Nat. Commun. 2017;8:14265. doi: 10.1038/ncomms14265. [DOI] [PMC free article] [PubMed] [Google Scholar]
- 31.Ahn JW, Park Y, Kang SJ, Hwang SJ, Cho KG, Lim J, et al. CeRNA network analysis representing characteristics of different tumor environments based on 1p/19q codeletion in oligodendrogliomas. Cancers (Basel) 2020;12(9):2543. doi: 10.3390/cancers12092543. [DOI] [PMC free article] [PubMed] [Google Scholar]
- 32.Park HJ, Ji P, Kim S, Xia Z, Rodriguez B, Li L, et al. 3' UTR shortening represses tumor-suppressor genes in trans by disrupting ceRNA crosstalk. Nat. Genet. 2018;50(6):783–789. doi: 10.1038/s41588-018-0118-8. [DOI] [PMC free article] [PubMed] [Google Scholar]
- 33.Zhang L, Zhang K, Liu S, Zhang R, Yang Y, Wang Q, et al. Identification of a ceRNA network in lung adenocarcinoma based on integration analysis of tumor-associated macrophage signature genes. Front. Cell Dev. Biol. 2021;9:629941. doi: 10.3389/fcell.2021.629941. [DOI] [PMC free article] [PubMed] [Google Scholar]
- 34.Marshall JC, Collins JW, Nakayama J, Horak CE, Liewehr DJ, Steinberg SM, et al. Effect of inhibition of the lysophosphatidic acid receptor 1 on metastasis and metastatic dormancy in breast cancer. J. Natl. Cancer Inst. 2012;104(17):1306–1319. doi: 10.1093/jnci/djs319. [DOI] [PMC free article] [PubMed] [Google Scholar]
- 35.Network CGA. Comprehensive molecular portraits of human breast tumours. Nature. 2012;490(7418):61–70. doi: 10.1038/nature11412. [DOI] [PMC free article] [PubMed] [Google Scholar]
- 36.Li L, Jiang M, Qi L, Wu Y, Song D, Gan J, et al. Pyroptosis, a new bridge to tumor immunity. Cancer Sci. 2021;112:3979. doi: 10.1111/cas.15059. [DOI] [PMC free article] [PubMed] [Google Scholar]
- 37.Pezuk JA. Pyroptosis in combinatorial treatment to improve cancer patients' outcome, is that what we want. EBioMedicine. 2019;41:17–18. doi: 10.1016/j.ebiom.2019.03.007. [DOI] [PMC free article] [PubMed] [Google Scholar]
- 38.Blasco MT, Gomis RR. PD-L1 controls cancer pyroptosis. Nat. Cell Biol. 2020;22(10):1157–1159. doi: 10.1038/s41556-020-00582-w. [DOI] [PubMed] [Google Scholar]
- 39.Faria SS, Costantini S, de Lima V, de Andrade VP, Rialland M, Cedric R, et al. NLRP3 inflammasome-mediated cytokine production and pyroptosis cell death in breast cancer. J. Biomed. Sci. 2021;28(1):26. doi: 10.1186/s12929-021-00724-8. [DOI] [PMC free article] [PubMed] [Google Scholar]
- 40.Wei J, Xu Z, Chen X, Wang X, Zeng S, Qian L, et al. Overexpression of GSDMC is a prognostic factor for predicting a poor outcome in lung adenocarcinoma. Mol. Med. Rep. 2020;21(1):360–370. doi: 10.3892/mmr.2019.10837. [DOI] [PMC free article] [PubMed] [Google Scholar]
- 41.Jiang H, Moro A, Liu Y, Wang J, Meng D, Zhan X, et al. Two GWAS-identified variants are associated with lumbar spinal stenosis and Gasdermin-C expression in Chinese population. Sci. Rep. 2020;10(1):21069. doi: 10.1038/s41598-020-78249-7. [DOI] [PMC free article] [PubMed] [Google Scholar]
- 42.Wu J, Sun Y, Xiong Z, Liu J, Li H, Liu Y, et al. Association of GSDMC polymorphisms with lumbar disc herniation among Chinese Han population. Int. J. Immunogenet. 2020;47(6):546–553. doi: 10.1111/iji.12488. [DOI] [PubMed] [Google Scholar]
- 43.Li Z, Jiang P, Li J, Peng M, Zhao X, Zhang X, et al. Tumor-derived exosomal lnc-Sox2ot promotes EMT and stemness by acting as a ceRNA in pancreatic ductal adenocarcinoma. Oncogene. 2018;37(28):3822–3838. doi: 10.1038/s41388-018-0237-9. [DOI] [PubMed] [Google Scholar]
- 44.Pengcheng Z, Peng G, Haowen F, Xida L, Yuhua L, Yao W, et al. MiR-573 suppresses cell proliferation, migration and invasion via regulation of E2F3 in pancreatic cancer. J. Cancer. 2021;12(10):3033–3044. doi: 10.7150/jca.51147. [DOI] [PMC free article] [PubMed] [Google Scholar]
- 45.Wang L, Gao P, Yuan P, Zhou P, Fan H, Lin X, et al. miR-573 suppresses pancreatic cancer cell proliferation, migration, and invasion through targeting TSPAN1. Strahlenther Onkol. 2021;197(5):438–448. doi: 10.1007/s00066-020-01728-3. [DOI] [PubMed] [Google Scholar]
- 46.Chen Z, Wu H, Zhang Z, Li G, Liu B. LINC00511 accelerated the process of gastric cancer by targeting miR-625-5p/NFIX axis. Cancer Cell Int. 2019;19:351. doi: 10.1186/s12935-019-1070-0. [DOI] [PMC free article] [PubMed] [Google Scholar]
- 47.Dong LM, Zhang XL, Mao MH, Li YP, Zhang XY, Xue DW, et al. LINC00511/miRNA-143-3p modulates apoptosis and malignant phenotype of bladder carcinoma cells via PCMT1. Front. Cell Dev. Biol. 2021;9:650999. doi: 10.3389/fcell.2021.650999. [DOI] [PMC free article] [PubMed] [Google Scholar]
- 48.Shi Y, Liu M, Huang Y, Zhang J, Yin L. Promotion of cell autophagy and apoptosis in cervical cancer by inhibition of long noncoding RNA LINC00511 via transcription factor RXRA-regulated PLD1. J. Cell Physiol. 2020;235(10):6592–6604. doi: 10.1002/jcp.29529. [DOI] [PubMed] [Google Scholar]
- 49.Wu B, Yuan Y, Han X, Wang Q, Shang H, Liang X, et al. Structure of LINC00511-siRNA-conjugated nanobubbles and improvement of cisplatin sensitivity on triple negative breast cancer. FASEB J. 2020;34(7):9713–9726. doi: 10.1096/fj.202000481R. [DOI] [PubMed] [Google Scholar]
- 50.Wu Y, Li L, Wang Q, Zhang L, He C, Wang X, et al. LINC00511 promotes lung squamous cell carcinoma proliferation and migration via inhibiting miR-150-5p and activating TADA1. Transl. Lung Cancer Res. 2020;9(4):1138–1148. doi: 10.21037/tlcr-19-701. [DOI] [PMC free article] [PubMed] [Google Scholar]
- 51.Seton-Rogers S. A multiplexed view of immune infiltration. Nat. Rev. Cancer. 2018;18(11):666–667. doi: 10.1038/s41568-018-0063-y. [DOI] [PubMed] [Google Scholar]
- 52.Shen H, Sun T, Hoang HH, Burchfield JS, Hamilton GF, Mittendorf EA, et al. Enhancing cancer immunotherapy through nanotechnology-mediated tumor infiltration and activation of immune cells. Semin. Immunol. 2017;34:114–122. doi: 10.1016/j.smim.2017.09.002. [DOI] [PMC free article] [PubMed] [Google Scholar]
- 53.Karn T, Denkert C, Weber KE, Holtrich U, Hanusch C, Sinn BV, et al. Tumor mutational burden and immune infiltration as independent predictors of response to neoadjuvant immune checkpoint inhibition in early TNBC in GeparNuevo. Ann. Oncol. 2020;31(9):1216–1222. doi: 10.1016/j.annonc.2020.05.015. [DOI] [PubMed] [Google Scholar]
- 54.Turan T, Kongpachith S, Halliwill K, Roelands J, Hendricks W, Marincola FM, et al. A balance score between immune stimulatory and suppressive microenvironments identifies mediators of tumour immunity and predicts pan-cancer survival. Br. J. Cancer. 2020;124:760. doi: 10.1038/s41416-020-01145-4. [DOI] [PMC free article] [PubMed] [Google Scholar]
- 55.Goldman MJ, Craft B, Hastie M, Repečka K, McDade F, Kamath A, et al. Visualizing and interpreting cancer genomics data via the Xena platform. Nat. Biotechnol. 2020;38(6):675–678. doi: 10.1038/s41587-020-0546-8. [DOI] [PMC free article] [PubMed] [Google Scholar]
- 56.Barrett T, Wilhite SE, Ledoux P, et al. NCBI GEO: Archive for functional genomics data sets—Update. Nucleic Acids Res. 2013;41:D991–D995. doi: 10.1093/nar/gks1193. [DOI] [PMC free article] [PubMed] [Google Scholar]
- 57.Li T, Fan J, Wang B, Traugh N, Chen Q, Liu JS, et al. TIMER: A web server for comprehensive analysis of tumor-infiltrating immune cells. Cancer Res. 2017;77(21):e108–e110. doi: 10.1158/0008-5472.CAN-17-0307. [DOI] [PMC free article] [PubMed] [Google Scholar]
- 58.Tang Z, Kang B, Li C, Chen T, Zhang Z. GEPIA2: An enhanced web server for large-scale expression profiling and interactive analysis. Nucleic Acids Res. 2019;47(W1):W556–W560. doi: 10.1093/nar/gkz430. [DOI] [PMC free article] [PubMed] [Google Scholar]
- 59.Nagy Á, Munkácsy G, Győrffy B. Pancancer survival analysis of cancer hallmark genes. Sci. Rep. 2021;11(1):6047. doi: 10.1038/s41598-021-84787-5. [DOI] [PMC free article] [PubMed] [Google Scholar]
- 60.Chen Y, Wang X. miRDB: An online database for prediction of functional microRNA targets. Nucleic Acids Res. 2020;48(D1):D127–D131. doi: 10.1093/nar/gkz757. [DOI] [PMC free article] [PubMed] [Google Scholar]
- 61.Vejnar CE, Zdobnov EM. MiRmap: Comprehensive prediction of microRNA target repression strength. Nucleic Acids Res. 2012;40(22):11673–11683. doi: 10.1093/nar/gks901. [DOI] [PMC free article] [PubMed] [Google Scholar]
- 62.Agarwal V, Bell GW, Nam JW, Bartel DP. Predicting effective microRNA target sites in mammalian mRNAs. Elife. 2015;4:e05005. doi: 10.7554/eLife.05005. [DOI] [PMC free article] [PubMed] [Google Scholar]
- 63.Sticht C, De La Torre C, Parveen A, Gretz N. miRWalk: An online resource for prediction of microRNA binding sites. PLoS ONE. 2018;13(10):e0206239. doi: 10.1371/journal.pone.0206239. [DOI] [PMC free article] [PubMed] [Google Scholar]
- 64.Paraskevopoulou MD, Georgakilas G, Kostoulas N, Vlachos IS, Vergoulis T, Reczko M, et al. DIANA-microT web server v5.0: Service integration into miRNA functional analysis workflows. Nucleic Acids Res. 2013;41:W169–W173. doi: 10.1093/nar/gkt393. [DOI] [PMC free article] [PubMed] [Google Scholar]
- 65.Paraskevopoulou MD, Vlachos IS, Karagkouni D, Georgakilas G, Kanellos I, Vergoulis T, et al. DIANA-LncBase v2: Indexing microRNA targets on non-coding transcripts. Nucleic Acids Res. 2016;44(D1):D231–D238. doi: 10.1093/nar/gkv1270. [DOI] [PMC free article] [PubMed] [Google Scholar]
- 66.Gao J, Aksoy BA, Dogrusoz U, Dresdner G, Gross B, Sumer SO, et al. Integrative analysis of complex cancer genomics and clinical profiles using the cBioPortal. Sci. Signal. 2013;6(269):1. doi: 10.1126/scisignal.2004088. [DOI] [PMC free article] [PubMed] [Google Scholar]
Associated Data
This section collects any data citations, data availability statements, or supplementary materials included in this article.
Supplementary Materials
Data Availability Statement
The UCSC Xena dataset was used to acquire TCGA and GTEx expression and clinical information (https://toil-xena-hub.s3.us-east-1.amazonaws.com/download/TcgaTargetGtex_rsem_gene_tpm.gz; Full metadata). Dataset ID: TcgaTargetGtex_rsem_gene_tpm. Raw counts of RNA-sequencing data (level 3) and matching clinical data contains 10,363 tumor tissues and 730 adjacent tissues from 18 types of cancer. All the datasets were retrieved from the publishing literature, so it was confirmed that all written informed consent was obtained.


