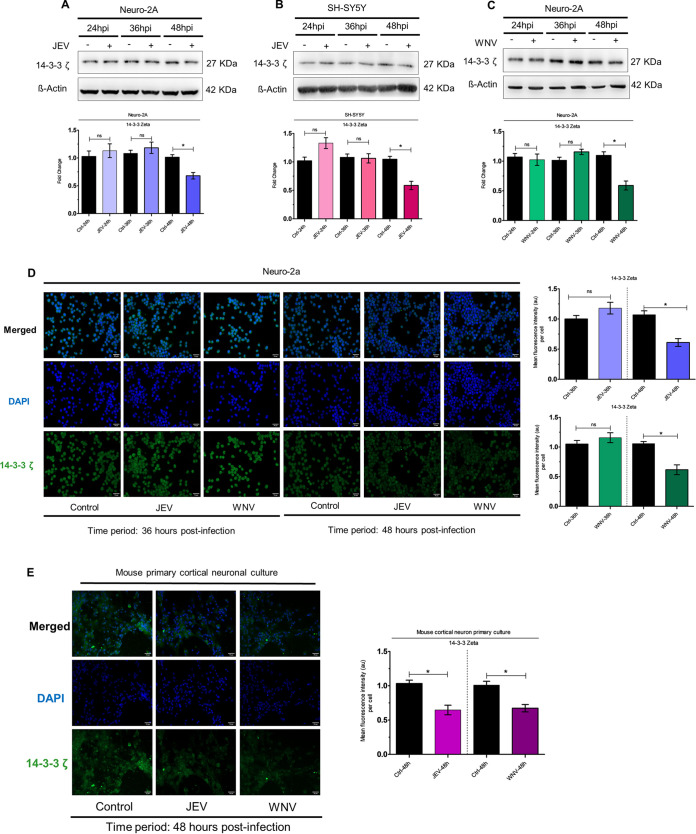
FIG 6.
JEV/WNV infection of neuronal cells reduce 14-3-3ζ protein abundance. Time-dependent expression analysis of 14-3-3ζ protein was performed using protein isolated from JEV-infected (MOI 3) Neuro-2A cells (A) or SH-SY5Y cells (B) and WNV-infected (MOI 3) Neuro-2A cells (C) for indicated time periods. ß-actin was used as a loading-control. Densitometric analysis of immunoblots demonstrating time-dependent kinetics of 14-3-3ζ (normalized to ß-actin) in JEV-infected Neuro-2A (A, bottom: ratio of 14-3-3ζ to ß-actin), JEV-infected SH-SY5Y (B, bottom: ratio of 14-3-3ζ to ß-actin) and WNV-infected Neuro-2A (C, bottom: ratio of 14-3-3ζ to ß-actin). Molecular weight in kDa of analyzed molecules has been presented beside the respective immunoblots. (D) Immunocytochemical study using Neuro-2A-cells infected with JEV/WNV (MOI 3) for 36 and 48 h demonstrates 14-3-3ζ abundance. Scale bar shown in micrographs measures 50 μm (×20 magnification). Mouse primary cortical neuronal cells were subjected to immunofluorescence microscopy in an effort to evaluate 14-3-3ζ expression level upon infection by JEV/WNV (MOI 3) for 48 h. Scale bar indicated in micrographs measures 50 μm (×20 magnification). Quantitative analysis of micrographs demonstrating effect of Neuro-2A infection by JEV (D, right top: blue bar), WNV (D, right bottom: green bar) and mouse cortical neuron primary culture infection by JEV/WNV (E, right) for respective time points as denoted in the figure on 14-3-3ζ expression. Bar graphs denote data in the form of mean ± SD collected from three independent experiments with similar results.*, P < 0.05, ns=non-significant, by two-tailed Student's t test.

