

SUMMARY
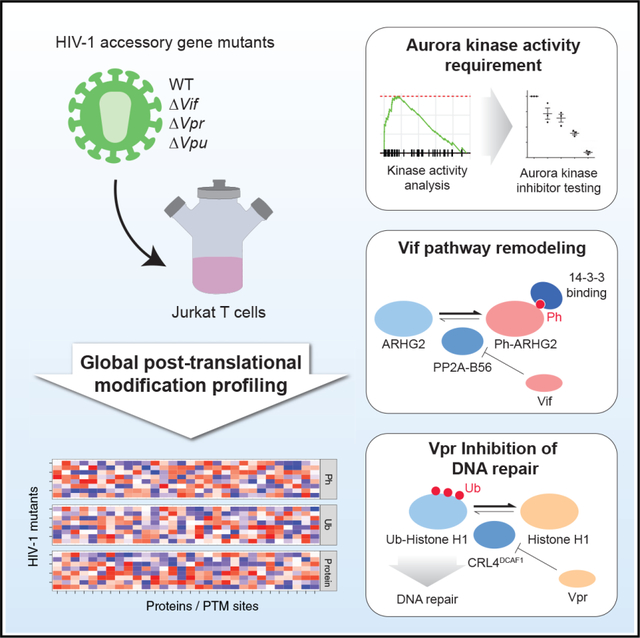
Viruses must effectively remodel host cellular pathways to replicate and evade immune defenses, and they must do so with limited genomic coding capacity. Targeting post-translational modification (PTM) pathways provides a mechanism by which viruses can broadly and rapidly transform a hostile host environment into a hospitable one. We use mass spectrometry-based proteomics to quantify changes in protein abundance and two PTM types—phosphorylation and ubiquitination—in response to HIV-1 infection with viruses harboring targeted deletions of a subset of HIV-1 genes. PTM analysis reveals a requirement for Aurora kinase activity in HIV-1 infection and identified putative substrates of a phosphatase that is degraded during infection. Finally, we demonstrate that the HIV-1 Vpr protein inhibits histone H1 ubiquitination, leading to defects in DNA repair.
In brief
Johnson et al. describe a quantitative resource of ubiquitination, phosphorylation, and protein abundance changes in cells infected with HIV-1. These data uncover a requirement for Aurora kinase activity in HIV-1 infection and find that the HIV-1 Vpr protein is associated with decreased histone H1 ubiquitination.
Graphical Abstract
INTRODUCTION
The HIV-1 genome encodes several accessory genes that are dispensable for replication in some cell lines but are required in vivo for replication and evasion of host antiviral pathways. Three HIV-1 accessory genes, Vif, Vpr, and Vpu, encode proteins that bind to Cullin RING-type E3 ubiquitin ligases (CRLs) to rewire host ubiquitination systems and to antagonize antiviral host pathways (Sauter and Kirschhoff, 2018). The HIV-1 Vif protein binds to the Cullin-5/Elongin-B/Elongin-C (CRL5EloB/EloC) ligase to promote ubiquitination and degradation of APOBEC3 proteins, which otherwise incorporate into HIV-1 virions and inactivate the virus by hypermutation of the viral genome (Harris et al., 2003; Sheehy et al., 2002). Vif also targets the B56 family of protein phosphatase 2A regulatory subunits (PP2A-B56) for ubiquitination and degradation (Greenwood et al., 2016; Salamango and Harris, 2020). PP2A-B56 degradation by Vif is associated with cell-cycle arrest, but the functional relevance and molecular mechanism underlying this process is unknown. The HIV-1 Vpu protein binds to the Cullin-1/Skp1/βTrCP ligase (SCFβTrCP) ligase to promote ubiquitination and removal from the cell surface of BST/tetherin, an antiviral protein that inhibits viral budding (Neil et al., 2008). Some lentiviruses encode an additional accessory factor, Vpx, that binds to the Cullin4/DDB1/DCAF1 (CRL4DCAF1) ligase to promote ubiquitination and degradation of the antiviral protein SAMHD1, which impairs viral reverse transcription (Hrecka et al., 2011; Laguette et al., 2011). HIV-2 Vpx also uses CRL4DCAF1 to promote ubiquitination and degradation of the HUSH transcriptional silencing complex that otherwise acts to silence both endogenous and exogenous retroviruses (Chougui et al., 2018; Yurkovetskiy et al., 2018). The HIV-1 Vpr protein also binds to CRL4DCAF1, but it degrades neither SAMHD1 nor HUSH. Many Vpr-CRL4DCAF1 substrates have been identified, including the uracil N-glycosylase 2 (UNG2), Mus81 (part of the SLX4 complex), helicase-like transcription factor (HLTF), exonuclease 1 (EXO1), and Tet DNA dioxygenase 2 (TET2) (Laguette et al., 2014; Lahouassa et al., 2016; Lv et al., 2018; Yan et al., 2018). Only TET2 has been demonstrated to rescue a replication defect of Vpr-deficient viral replication in primary monocyte-derived macrophages and the rescue was only partial (Wang and Su, 2019). None of the Vpr-CRL4DCAF1 substrates identified thus far explain the ability of Vpr to activate G2/M-phase cell-cycle arrest.
The identification of post-translational modification (PTM) enzyme-substrate relationships can be challenging because of the transient nature of their physical interactions. The discoveries of APOBEC3 and BST2/tetherin proteins as ubiquitination targets of Vif-CRL5ELOB/ELOC and Vpu-SCFβTrCP, respectively, were made by comparing gene expression patterns in closely related cell lines that were permissive or non-permissive to HIV-1 replication with Vif- and Vpu-deficient viruses (Neil et al., 2008; Sheehy et al., 2002). Conversely, the suite of Vpr and Vpx substrates have been identified by physical interactions with Vpr/Vpx-CRL4DCAF1. The development of chemical and immunoaffinity methods to enrich for ubiquitinated and phosphorylated species, combined with increasingly comprehensive and quantitative mass spectrometry-based proteomics approaches allows for a “shotgun” approach to identify PTM enzyme-substrate relationships. In this study, we sought to identify PTM pathways perturbed by HIV-1 infection to better understand the molecular mechanisms underlying HIV-1 accessory gene functions. We applied a global mass spectrometry-based proteomics approach to obtain a quantitative survey of two major PTM types—ubiquitination and phosphorylation—and protein abundance in cells infected with HIV-1 and accessory gene-deficient HIV-1 viruses. These data represent a quantitative resource of PTM changes during HIV-1 infection that will facilitate future investigations of the relationship between HIV-1 and its host.
RESULTS
Proteome-wide evaluation of the proteome, phosphoproteome, and ubiquitinome of HIV-1-infected cells
We applied a mass spectrometry-based proteomics approach to quantify changes in phosphorylation, ubiquitination, and protein abundance in response to HIV-1 infection. Jurkat E6.1 T cells were infected with vesicular stomatitis virus glycoprotein (VSVG-)-pseudotyped, Env-deficient HIV-1 (strain NL4-3, referred to as wild-type [WT] hereafter) and Vif-, Vpr-, and Vpu-deficient HIV-1 strains with the same virus backbone and VSVG-pseudotyping as WT (referred to as ΔVif, ΔVpr, and ΔVpu hereafter). We selected a 24-h post-infection time point because we observed sufficient expression of viral accessory proteins at this time point without observing significant cell death. For mock infection, cells were treated with equal titers of Env-deficient HIV-1 without VSVG-pseudotyping, thus lacking any means to enter cells. Infections were performed at a multiplicity of infection of 5, and all viruses achieved infection rates of >75% (Figure S1). Ubiquitination changes were quantified by combining a stable isotope labeling of amino acids in culture (SILAC) approach with ubiquitin remnant purification and mass spectrometry in biological quadruplicate with the SILAC labels inverted for every pair of replicates (Figure 1A) (Ong et al., 2002; Xu et al., 2010). To stabilize ubiquitinated substrates that may be rapidly degraded by the proteasome, ubiquitination experiments were performed in the presence and absence of a proteasome inhibitor, MG-132, provided at 10 μM for 4 h prior to harvesting. MG-132 treatment increased the number of ubiquitination sites quantified, likely due to inhibition of proteasome-mediated degradation of many ubiquitinated species. We have previously demonstrated that this treatment is necessary to detect ubiquitinated peptides derived from canonical HIV-1 ubiquitination targets APOBEC3C and CD4 during infection (Ball et al., 2016). Phosphorylation and protein abundance changes were quantified by combining a label-free, data-independent acquisition approach with Fe3+ immobilized metal affinity chromatography (Fe3+-IMAC) phosphopeptide enrichment performed in biological triplicate (Figure 1B) (Mertins et al., 2013).
Figure 1. PTM analysis of HIV-1 infection.
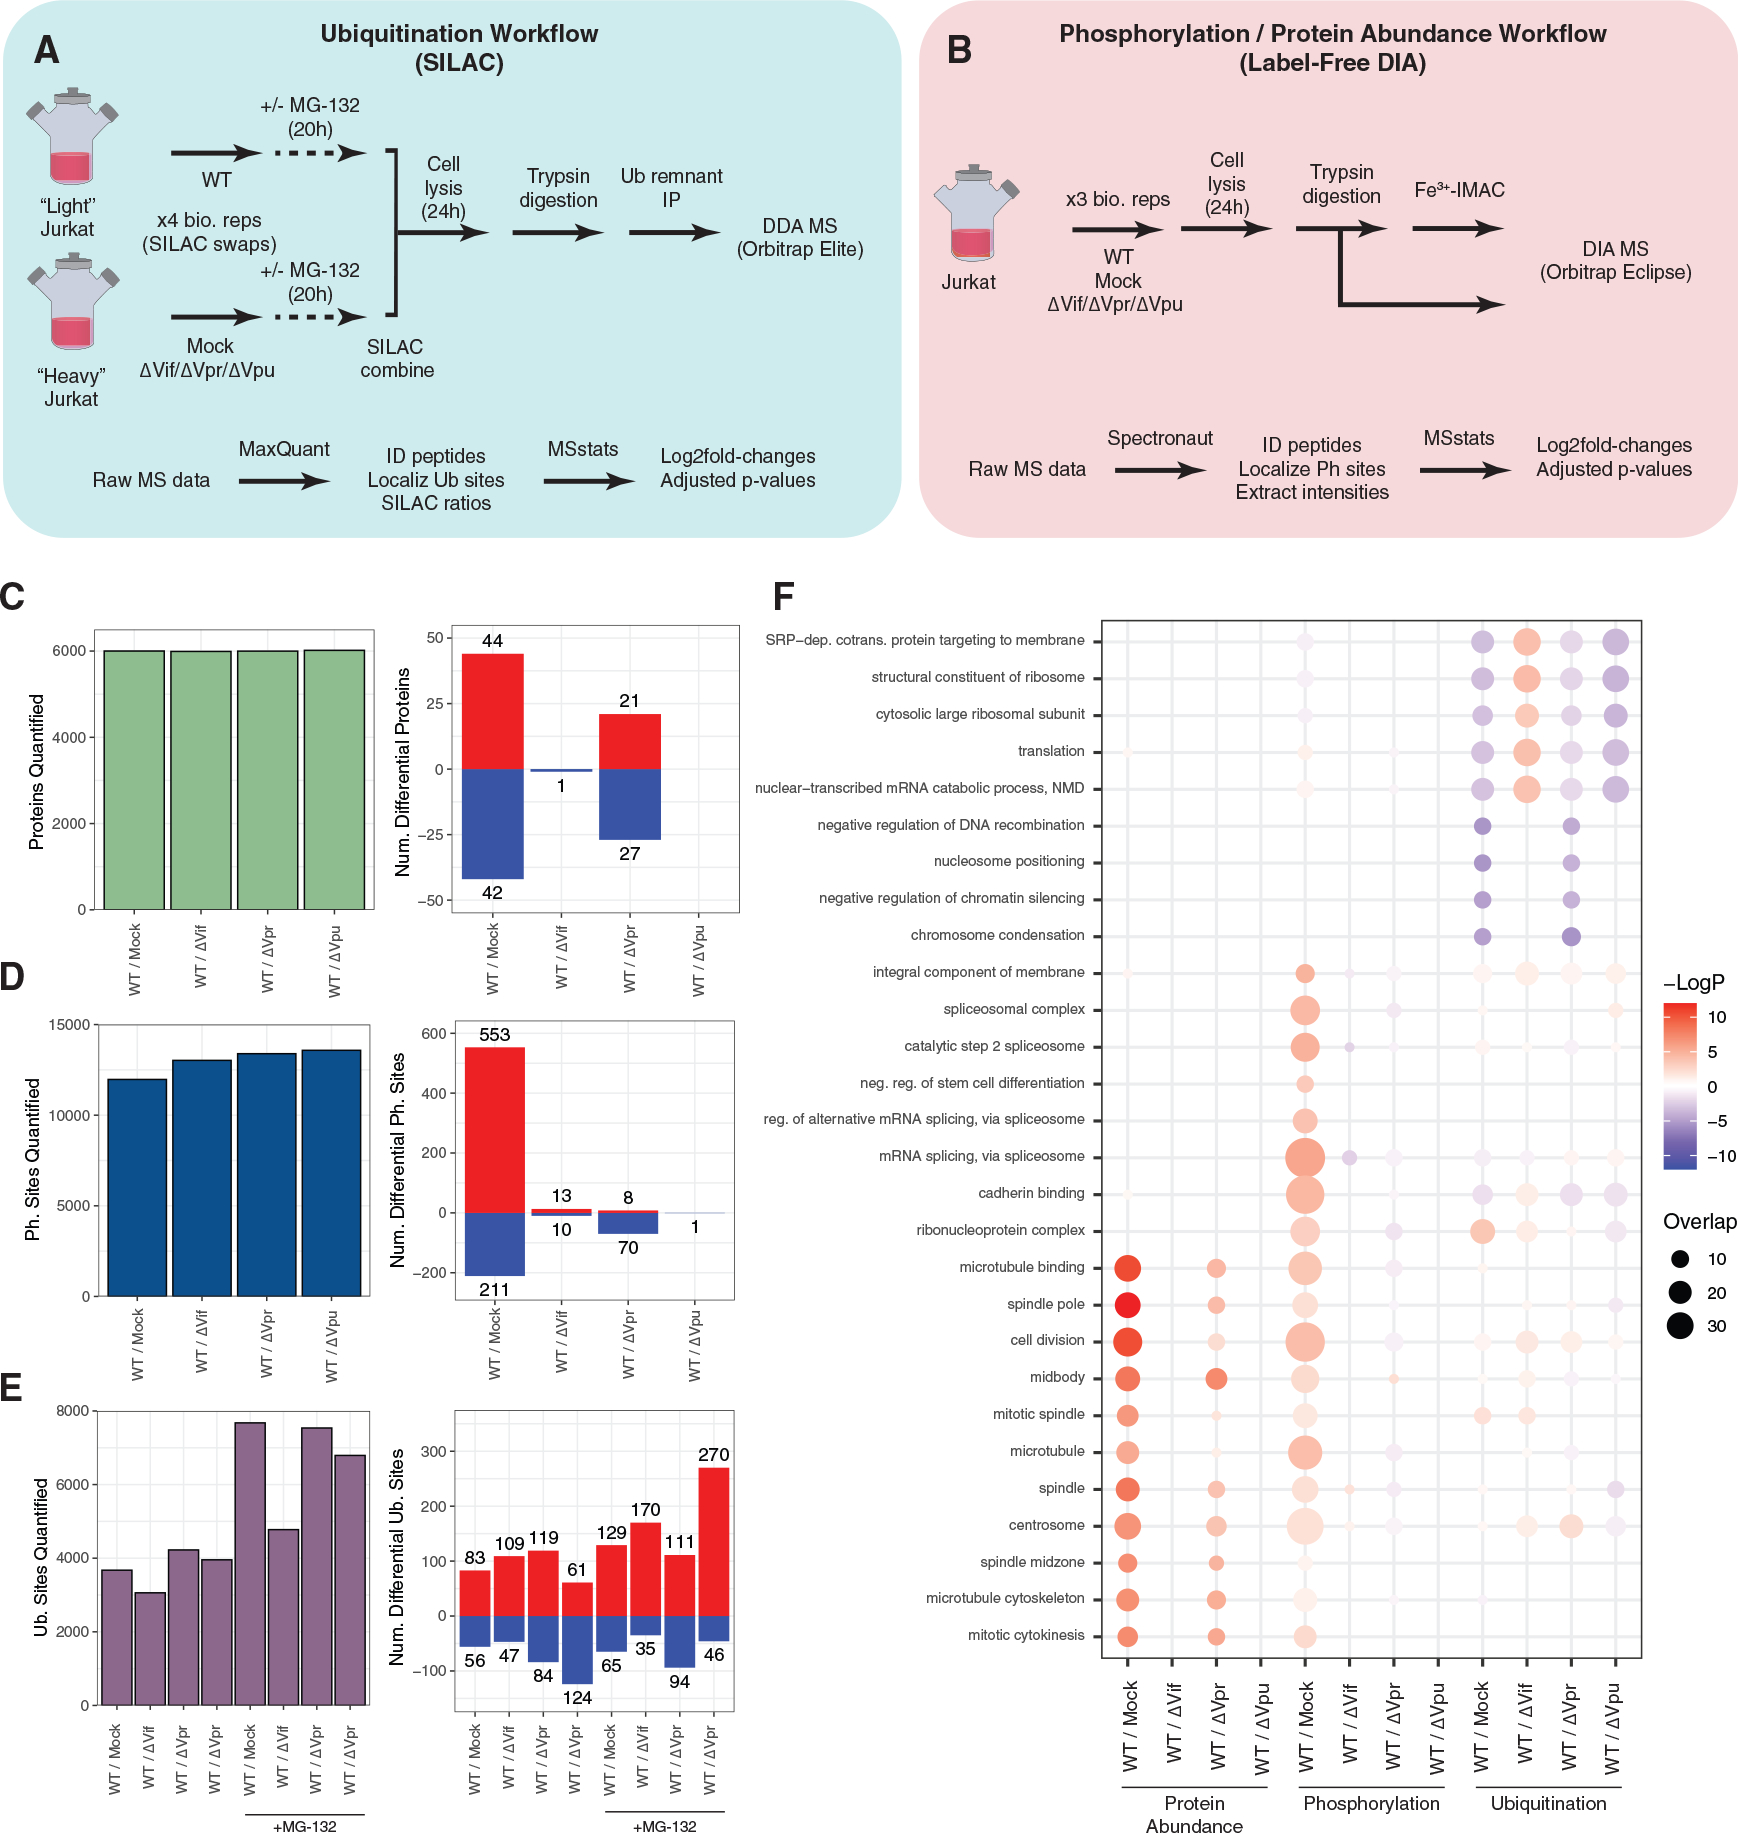
(A) Schematic of experimental and data analysis workflows for global ubiquitination experiments.
(B) Schematic of experimental and data analysis workflows for global phosphorylation and protein abundance experiments.
(C) Number of total quantified protein groups (left) and differentially abundant protein groups (right) by comparison (n = 3 biological replicates).
(D) Number of total quantified phosphorylation site groups (left) and differentially abundant phosphorylation site groups (right) by comparison (n = 3 biological replicates).
(E) Number of total quantified ubiquitination site groups (left) and differentially abundant ubiquitination site groups (right) by comparison (n = 4 biological replicates).
(F) Enrichment analysis of gene ontology terms. The top 10 gene ontology terms per data type are indicated (full gene ontology enrichment results in Table S2). See also Tables S1 and S2.
In total, 11,821 ubiquitination site groups, 14,105 phosphorylation site groups, and 6,078 protein groups were quantified across all experiments (Figures 1C–1E; Table S1). For ubiquitination data, 83% of ubiquitin site groups were quantified in at least one replicate of both the forward and reverse SILAC orientations (Figure S2). For both protein abundance and phosphorylation data, the number of protein groups and phosphorylation site groups that were differentially abundant (defined hereafter as |log2 fold change| > 1 and adjusted p value < 0.05) was greatest for the WT/mock comparison, followed by the WT/ΔVpr comparison (Figures 1C–1E). Pairwise correlation analysis of ubiquitination log2 fold-change profiles showed that WT/mock and WT/ΔVpr samples largely clustered separately from WT/ΔVif and WT/ΔVpu samples (Figure S3). Pairwise correlation analysis of sample intensity profiles for phosphorylation and protein abundance samples showed that intensities generally clustered with biological replicates of the same condition (Figure S4).
We next performed gene ontology enrichment analysis for protein, phosphorylation, and ubiquitination site groups that were differentially increased or decreased in each comparison using the criteria above for thresholding differential abundance (Figure 1F; Table S2) (Ashburner et al., 2000; Gene Ontology, 2021). Because proteasome inhibition had profound effects on ubiquitination profiles in HIV-infected cells, we restricted this analysis to ubiquitination profiles from samples that were not treated with MG-132. This enrichment analysis uncovered differentially increased protein abundance for several gene ontology terms related to cell division and mitotic spindle regulation for both WT/mock and WT/ΔVpr comparisons, which may reflect the effects of HIV-1-mediated G2/M-phase cell-cycle arrest via the Vpr gene (Figure 1F) (Bartz et al., 1996). Enrichment analysis also uncovered differentially decreased ubiquitination of several histone H1 isoforms involved in nucleosome positioning in both WT/mock and WT/ΔVpr comparisons (Figure 1F).
Defining Vif-, Vpr-, and Vpu-dependent proteomic changes
To map Vif-, Vpr-, and Vpu-dependent changes in protein abundance, a Z-score transformation was performed for each protein group to calculate the distance, in standard deviations, between the log2 fold-change value for each comparison with the mean and standard deviation of log2 fold changes of all comparisons. Based on proteins described to be downregulated during HIV-1 infection (i.e., PP2A-B56 family members, HLTF, and UNG), we considered protein groups with a Z-score > 1.35 in any comparison to be specific for that comparison (Greenwood et al., 2016; Lahouassa et al., 2016; Selig et al., 1997; Yan et al., 2019). This yielded a set of 80 protein group changes mapped to Vif, Vpr, or Vpu and correctly mapped degradation of PP2A-B56 family members α, δ, and γ to Vif and degradation of HLTF and UNG to Vpr (Figure 2A) (Greenwood et al., 2016; Lahouassa et al., 2016; Selig et al., 1997; Yan et al., 2019). With the exception of RFX1, which decreased in abundance in a Vpu-dependent manner, all other protein changes mapped to Vpr. Vpr-dependent protein changes included several kinases associated with the cell cycle, including Aurora kinases A and B and PLK1.
Figure 2. HIV-1 accessory protein-dependent changes in protein abundance and ubiquitination.
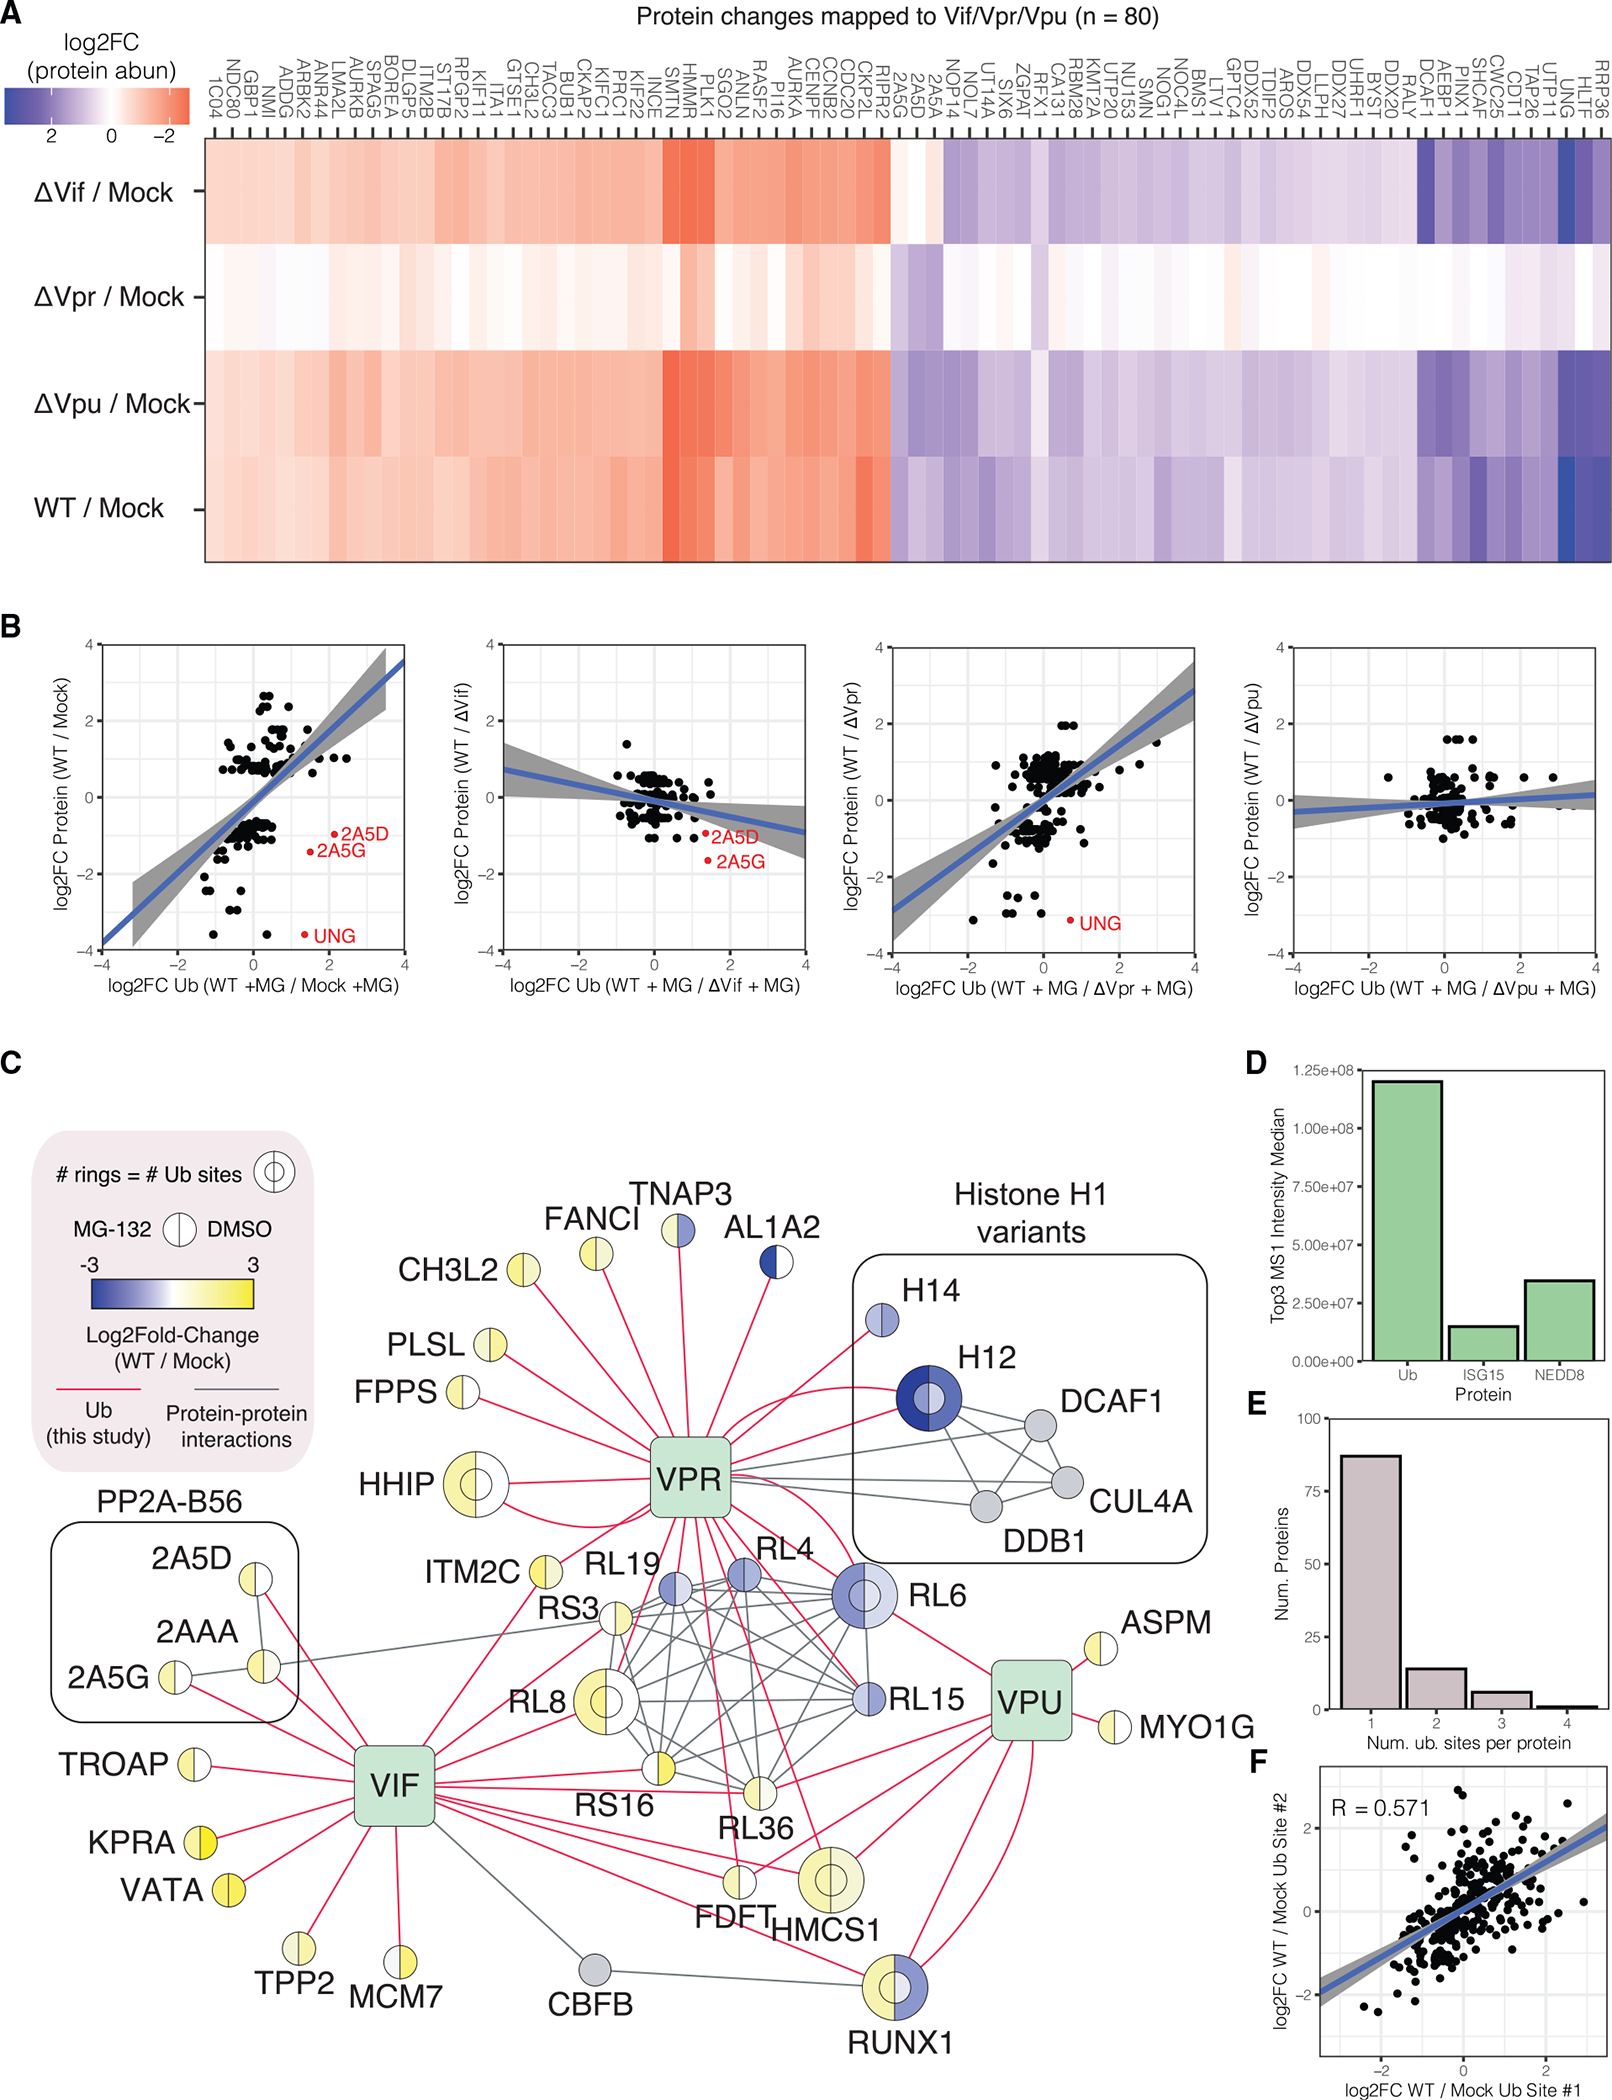
(A) Heatmap of log2 fold changes by comparison for differentially abundant proteins that could be mapped to a specific HIV-1 accessory protein.
(B) Scatterplots of ubiquitination changes (in the presence of proteasome inhibition) versus protein abundance changes for proteins in (A).
(C) Network view of putative Vif-, Vpr-, and Vpu-dependent ubiquitination. See legend for node and edge definitions.
(D) Top 3 MS1 intensity analysis of ubiquitin and ubiquitin-like proteins ISG15 and NEDD8.
(E) Bar graph of the number of proteins with N differentially abundant ubiquitination sites in the WT/mock comparison.
(F) Scatterplot of ubiquitination log2 fold changes for multiply, differentially ubiquitinated proteins in the WT/mock comparison. Each point represents the log2 fold change of a ubiquitination site versus the next consecutive ubiquitination site in the protein sequence.
See also Table S3.
To identify ubiquitination events that are associated with protein degradation, we compared changes in ubiquitination for infections performed in the presence of proteasome inhibitor (MG-132) to their respective protein abundance changes performed in the absence of MG-132 (Figure 2B; Table S3). For the WT/mock comparison, two PP2A-B56 subunits (PP2A-B56δ and -γ) and UNG were observed with increased ubiquitination and decreased protein abundance. The same patterns were observed for PP2A-B56δ and -γ in the WT/ΔVif comparison and for UNG in the WT/ΔVpr comparison. Of note, while it was slightly below our thresholds for differential abundance, the N-myc interacting protein (NMI) was ubiquitinated with a log2 fold change of −0.80 in WT/mock and −1.26 in WT/ΔVpr, while its protein abundance was observed with a log2 fold change of 0.72 in WT/mock and 0.91 in WT/ΔVpr, suggesting that it may be targeted for deubiquitination by Vpr resulting in increased protein abundance.
We next sought to map ubiquitination changes to specific HIV-1 accessory genes. We identified ubiquitination sites that were differentially abundant in WT/ΔVif, WT/ΔVpr, and WT/ΔVpu comparisons that were similarly differentially abundant in the WT/mock comparison. These changes are represented in a network view in Figure 2C (Oughtred et al., 2019). This analysis is consistent with the previously reported Vif-dependent degradation of PP2A-B56 family (2A5D and 2A5G) (Greenwood et al., 2016). We identified two regulated ubiquitination sites within the Runt domains of RUNX1 and RUNX2, transcription factors that form a heterodimeric complex with core-binding factor β (CFBβ). CFBβ is bound by HIV-1 Vif to enhance Vif stability and aid in recruitment of the CRL5ELOB/ELOC E3 ubiquitin ligase complex (Kim et al., 2013a). These RUNX ubiquitination sites were differentially increased exclusively in the presence of proteasome inhibition (Figure S5). RUNX1 dimerization with CFBβ protects RUNX1 from ubiquitination and degradation by the proteasome, and our finding that RUNX proteins are ubiquitinated in HIV-1-infected cells in the presence of proteasome inhibitor is consistent with a model where HIV-1 Vif sequesters CFBβ away from its RUNX cofactors (Huang et al., 2001). Finally, we mapped the activity of histone H1 deubiquitination on variants H1.2 and H1.4 specifically to the Vpr gene.
Ubiquitin is not the only protein known to generate a diglycine remnant that would be enriched with the ubiquitin remnant antibody used in this study. Ubiquitin-like proteins ISG15 and NEDD8 also covalently attach to substrate lysine residues and generate diglycine remnants upon trypsin digestion. We employed a “top 3” intensity average method to estimate the relative absolute abundance of ubiquitin, ISG15, and NEDD8 from protein abundance data (Figure 2D) (Grossmann et al., 2010). By this method, we estimate that ubiquitin is 5 to 10 times more abundant than ISG15 and NEDD8, and thus, we expect most sites discovered in this study to be ubiquitin modifications. Many proteins were observed with multiple ubiquitination sites that were similarly regulated by HIV-1 infection (Figure 2E). To analyze the behavior of ubiquitination sites on multiply ubiquitinated proteins, we plotted the log2 fold-change values for adjacent ubiquitination sites on the same protein for proteins with at least two differentially regulated ubiquitination sites (Figure 2F). Overall, ubiquitination sites on the same protein were correlated with a Pearson coefficient of 0.571.
HIV-1 requires Aurora kinase activity for replication in human primary CD4+ T cells and monocyte-derived macrophages
To identify kinases that may be differentially active in HIV-1 infection, we estimated the significance of changes in kinase activity based on phosphorylation log2 fold-change profiles using a gene set enrichment analysis approach with kinase-substrate annotations derived from the PhosphoSitePlus resource (Table S4) (Beltrao et al., 2012; Hernandez-Armenta et al., 2017; Hornbeck et al., 2015; Subramanian et al., 2005). The 10 most significantly regulated kinases in the WT/mock comparison were Aurora kinase B, ERK1, ERK2, Src, PLK1, ATM, p90RSK, Aurora kinase A, AMPKA1, and ATR. A network view of differentially regulated kinases and their substrates is illustrated in Figure 3A. We found that topoisomerase II alpha (TOP2A) phosphorylation is increased upon HIV-1 infection at multiple sites, consistent with reports that have found phosphorylated TOP2A in both HIV-infected cells and virions (Kondapi et al., 2005; Matthes et al., 1990). Motif enrichment analysis using MoMo/Motif-X identified two motifs overrepresented in differentially increased phosphorylation sites (Figure 3D): an RxxS* motif and an SXS* motif (Chou and Schwartz, 2011). No significantly overrepresented motifs were identified in differentially decreased phosphorylation sites. RxxS* motifs are common among kinase preferences and may reflect the activity of Aurora kinase A or B, p21-activated kinases, AMP-activated kinase, protein kinase A, and Ca2+/calmodulin-dependent kinases.
Figure 3. Phosphoproteomics analysis reveals a requirement for perturbations of Aurora kinase activity in HIV-1 infection.
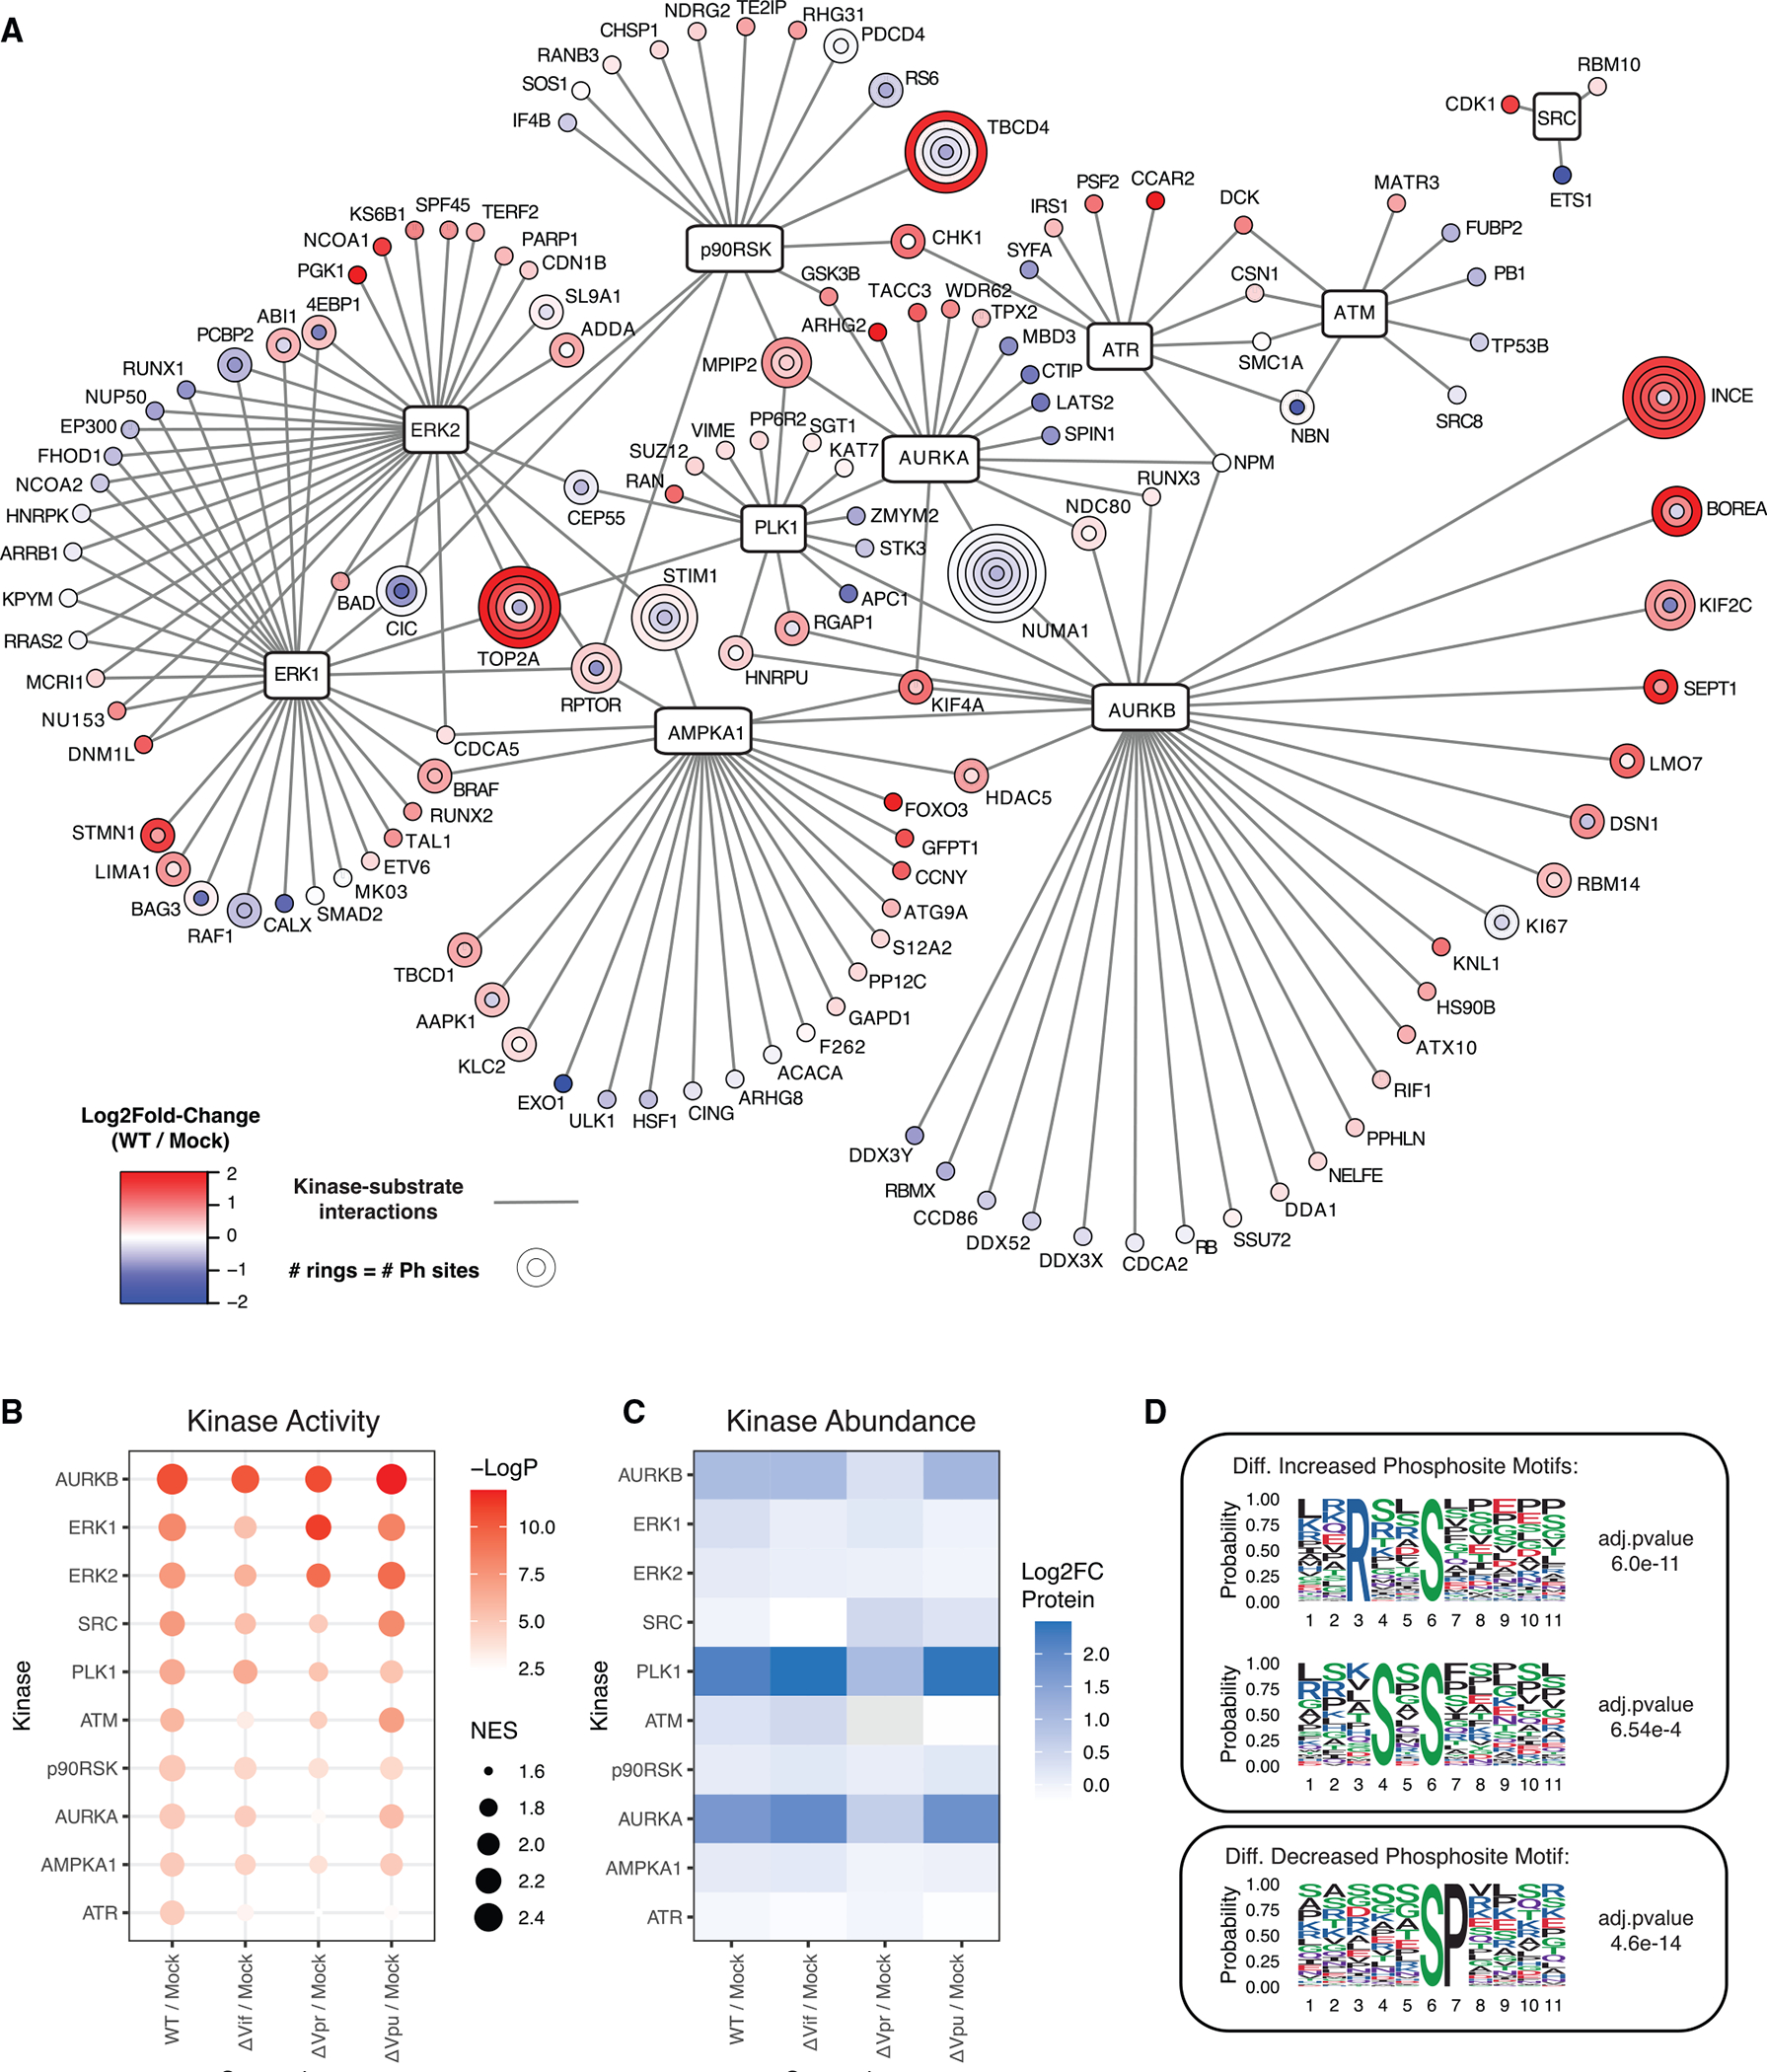
(A) Kinase-substrate network for the 10 most significantly regulated kinases in the WT/mock comparison. See legend for node definitions.
(B) Dot plot of the 10 most significantly regulated kinases across all comparisons.
(C) Heatmap of protein abundance log2 fold changes for the top 10 most significantly regulated kinases across all comparisons.
(D) Logo representations of motifs identified to be overrepresented in differentially increased and decreased phosphosites by MoMo/Motif-X.
See also Table S4.
Our differential kinase activity analysis identified Aurora kinases A, B, and PLK1 as among the most significantly regulated kinases based on their substrate phosphorylation log2 fold-change profiles. As noted above, the protein abundances of Aurora kinases A, B, and PLK1 were differentially increased in all comparisons except the ΔVpr/mock comparison, suggesting that these changes are Vpr dependent (Figure 3C). Furthermore, the significance of Aurora kinase A regulation by this method was significantly lower in the ΔVpr/mock comparison compared with all other comparisons (Figure 3B).
We next tested the impact of Aurora kinase inhibitors on HIV-1 infection in primary human CD4+ T cells. Cells were pre-treated for 1 h with an Aurora kinase A inhibitor, MLN8054, then infected with HIV-1 containing a luciferase reporter in the Nef locus (Manfredi et al., 2007). We observed cell-cycle defects with MLN8054 treatment longer than 24 h and therefore measured luciferase activity at 24 h and confirmed normal cell-cycle progression. MLN8054 inhibited HIV-1 infection in a dose-dependent manner with an EC50 of approximately 500 nM (Figure 4A). We next tested more selective inhibitors of Aurora kinases A and B (Figure 4B). MLN8237 is 200-fold more selective for Aurora kinase A than B and inhibited HIV-1 infection at 5 μM in both human primary CD4+ T cells and human primary monocyte-derived macrophages with no effect on cell viability (Tomita and Mori, 2010). AZD1152-HQPA (Barasertib), an Aurora kinase B inhibitor that is 3,000-fold more selective for Aurora kinase B than A, had no effect on HIV-1 replication but did reduce cell viability by 10% to 20% in human primary CD4+ T cells and monocyte-derived macrophages (Wilkinson et al., 2007). Collectively, these data uncovered several kinase-substrate networks impacted during HIV-1 infection and demonstrate the essential role of Aurora kinase signaling for productive infection.
Figure 4. Aurora kinase activity is required for productive HIV-1 infection in primary CD4+ T cell and monocyte-derived macrophages.
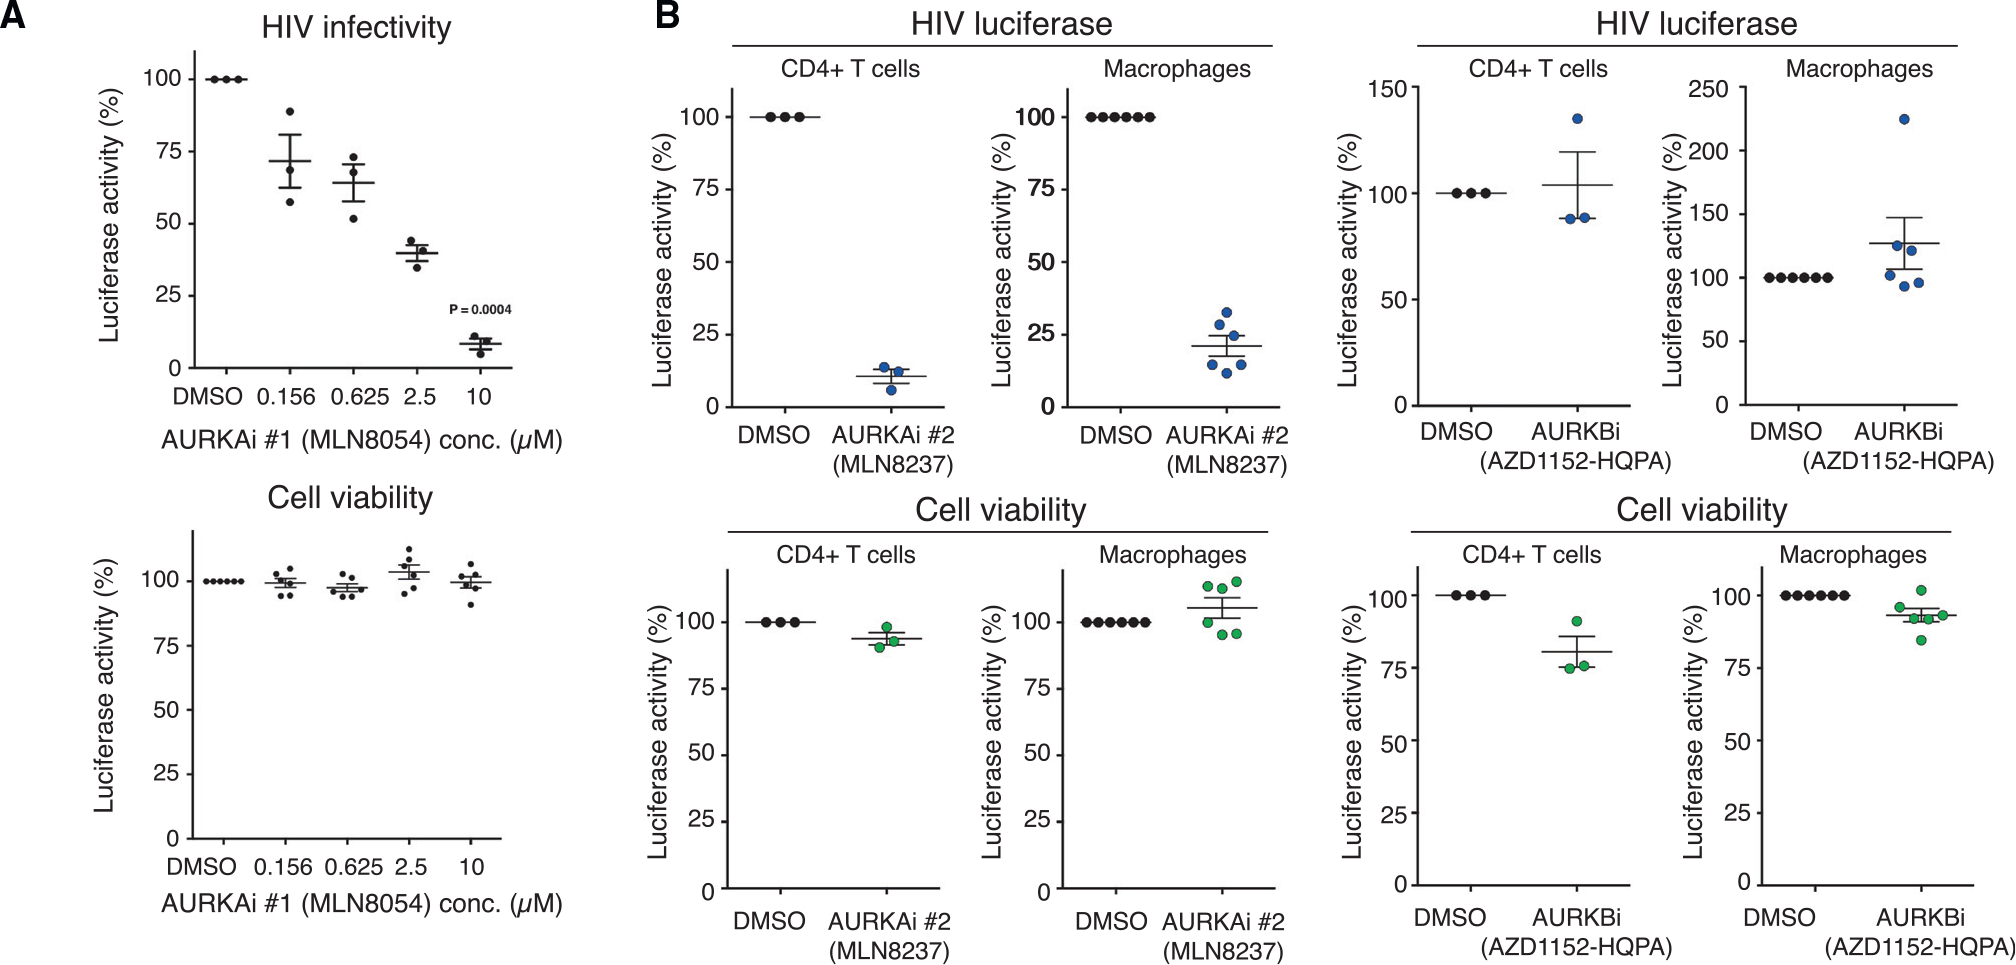
(A) HIV-1 infectivity (n = 3 donors) and cell viability (n = 5 donors) in response to MLN8054 titration in human primary CD4+ T cells, normalized to DMSO control.
(B) HIV-1 infectivity and cell viability in response to MLN8237 and AZD1152-HPQ treatment in human primary CD4+ T cells (n = 3 donors) and monocyte-derived macrophages (n = 5 donors), normalized to DMSO control.
PP2A-B56 degradation by Vif alters ARHG2 binding to 14–3-3 proteins
While PP2A-B56 is ubiquitinated and degraded in a Vif-dependent manner, the functional significance of this process is not understood. To identify putative PP2A-B56 substrates affected by its Vif-mediated degradation, we mined the phosphoproteomics data described above and added a comparison where cells infected with ΔVif, which does not lead to PP2A-B56 degradation, were treated for 1 h prior to harvest with DMSO or okadaic acid (OA), a PP2A inhibitor (Figure 5A). Inspection of validated PP2A-B56 substrates revealed a characteristic pattern of log2 fold-change values among the comparisons where WT/mock and WT/ΔVif were highest, followed by WT/ΔVpr, then WT/ΔVpu (Figure 5D). All validated substrates had negative log2 fold-change values for the ΔVif/ΔVif OA comparison. Based on the log2 fold-change values observed for validated PP2A-B56 substrates, we filtered phosphosite groups for those with log2 fold-change values > 0.5 in the WT/mock and WT/ΔVif comparisons and log2 fold-change values < −0.5 for the ΔVif/ΔVif OA comparison to obtain a set of 125 phosphosite groups that are putative PP2A-B56 substrates (Figure 5C; Table S5). We further filtered these data for phosphosites with annotated functions in the PhosphoSitePlus Regulatory Sites dataset (Hornbeck et al., 2015). This yielded a set of 11 phosphorylation sites that includes several proteins involved in the cell cycle and mitotic spindle formation, including CHK1, TOP2A, and ARHG2 (Figure 5E).
Figure 5. Phosphoproteomics identification of putative PP2A-B56 substrates in the context of HIV-1 infection.
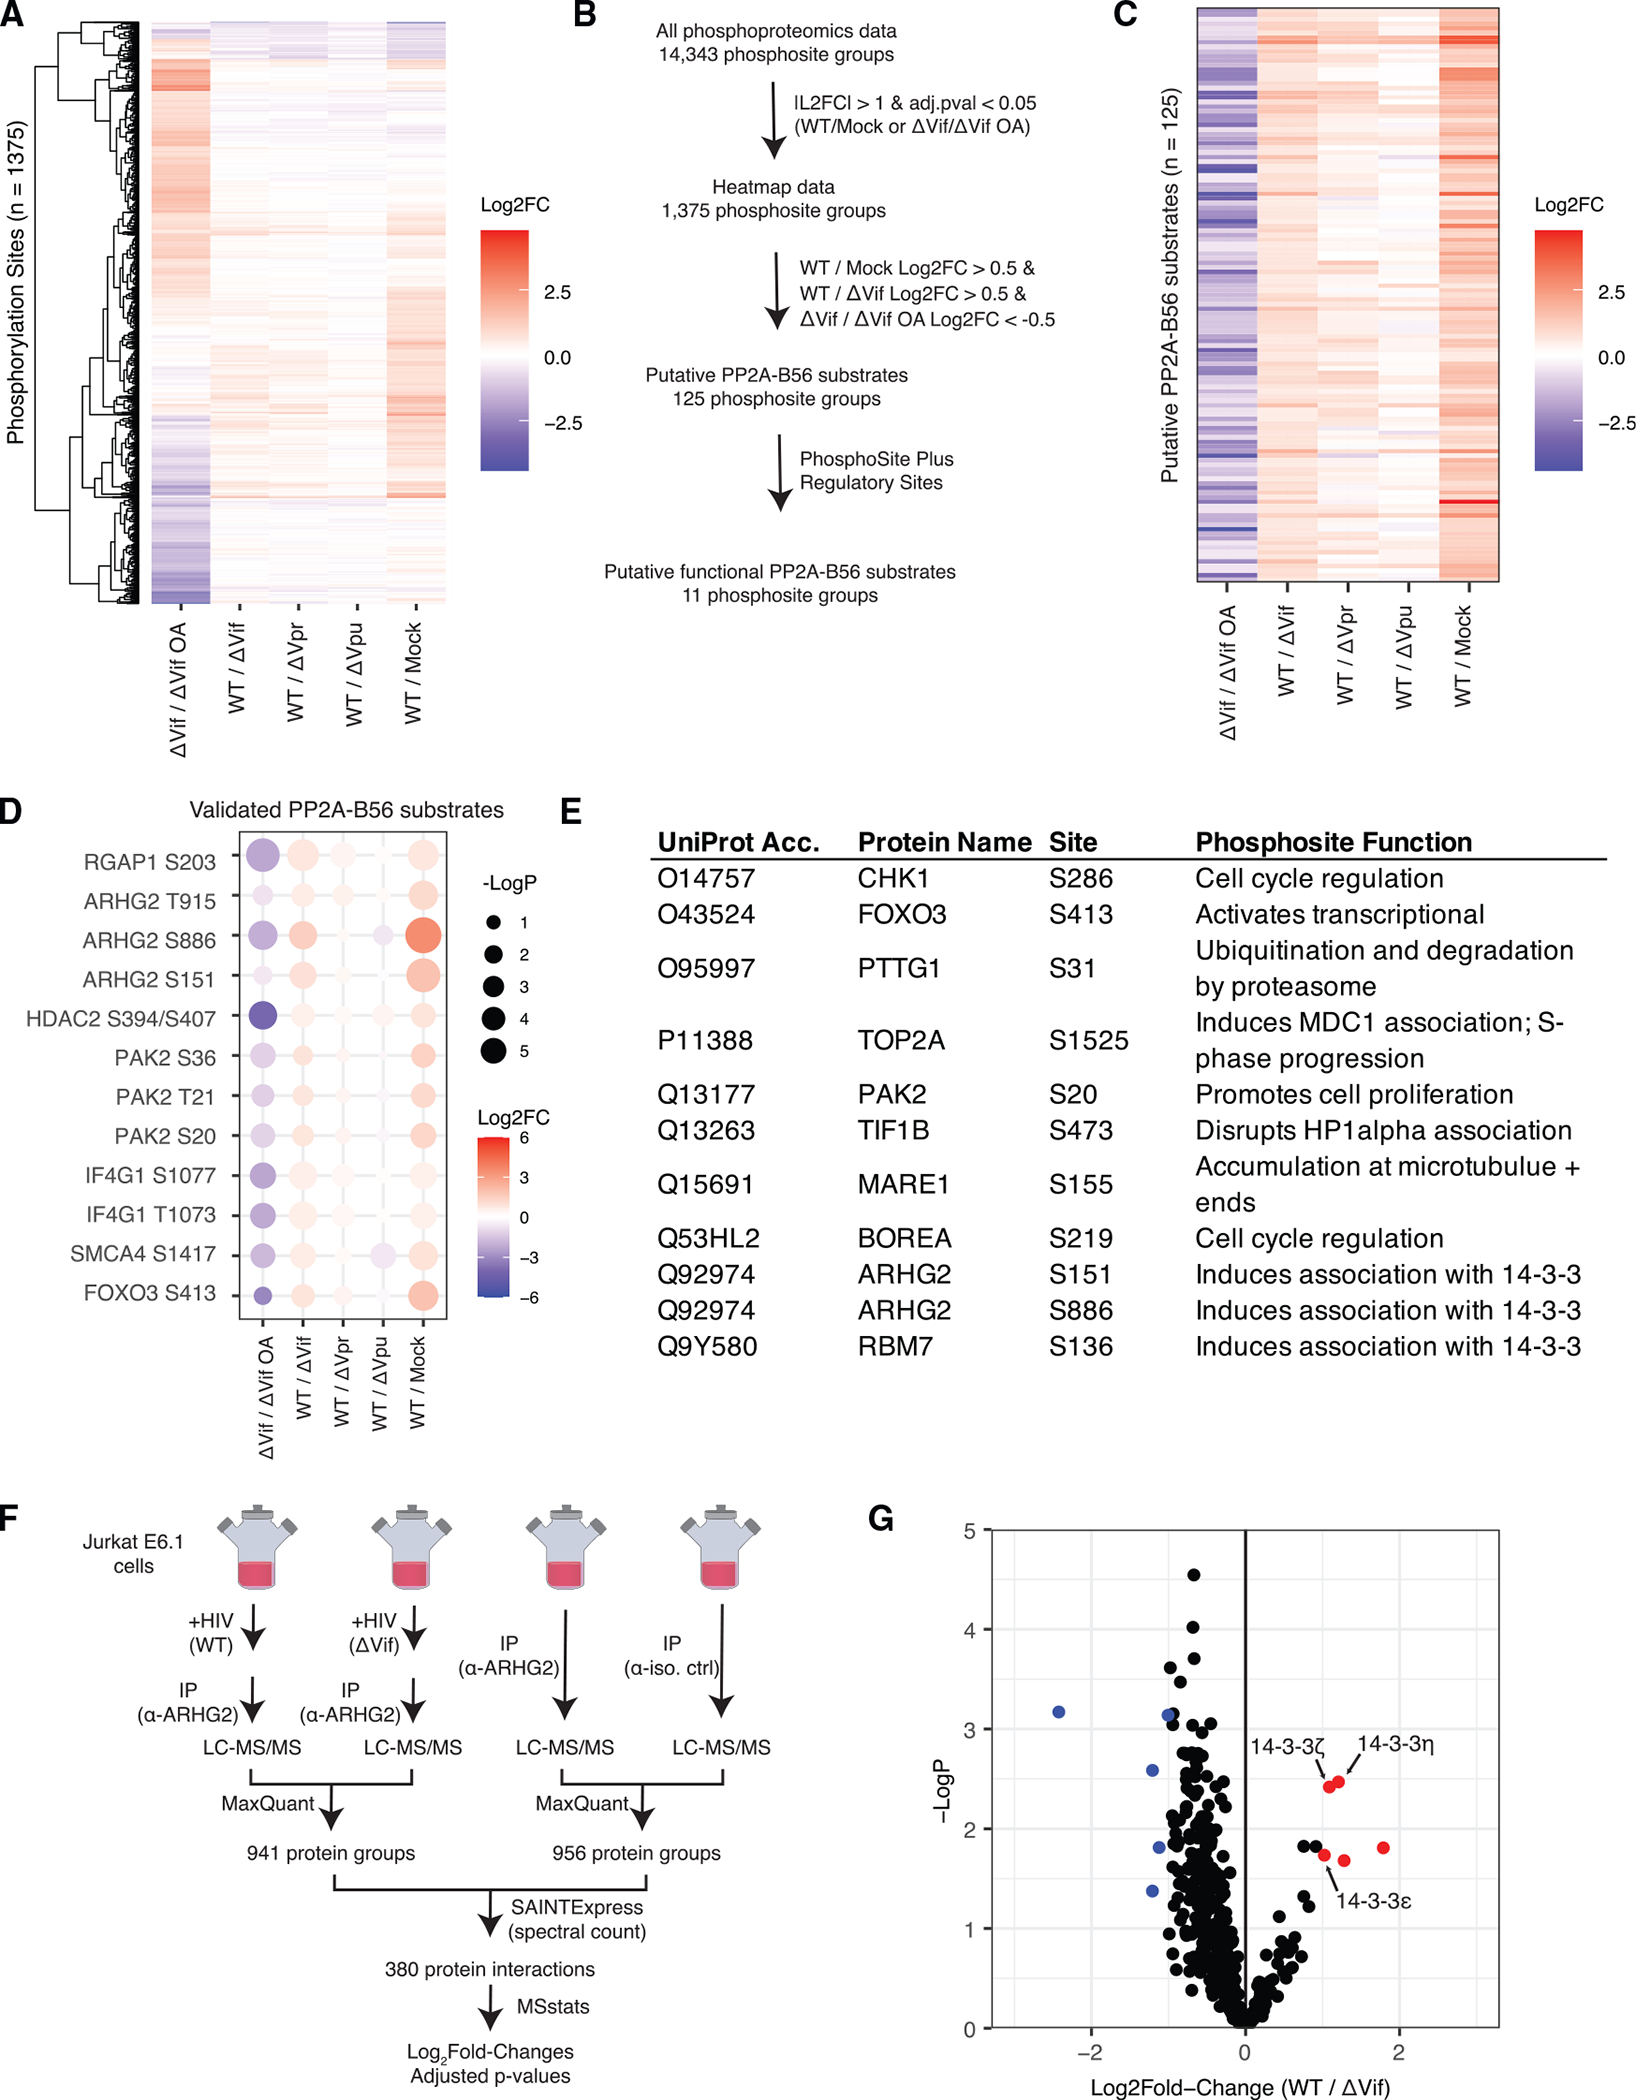
(A) Heatmap of log2 fold changes for phosphorylation site groups that were differentially abundant in at least one comparison with no missing values.
(B) Schematic of data filtering process to identify putative PP2A-B56 substrates with defined regulatory functions.
(C) Heatmap of log2 fold changes for putative PP2A-B56 substrates.
(D) Dot plot of validated PP2A-B56 substrates.
(E) Table of regulatory functions annotated for putative PP2A-B56 substrates in the PhosphoSitePlus regulatory dataset.
(F) Schematic of experimental and data analysis workflows for ARHG2 interaction analysis in the context of HIV-1 infection (n = 3 biological replicates).
(G) Volcano plot of changes in ARHG2 IP-MS experiments. Protein group changes that were differentially increased and decreased are in red and blue, respectively. See also Tables S5 and S6 and Figure S6.
Of the validated PP2A-B56 substrates, ARHG2 S886 phosphorylation was observed with the highest log2 fold changes in both the WT/mock and WT/ΔVif comparisons. Two sites on ARHG2 have been described to regulate binding to 14-3-3 proteins and sequester ARHG2 to microtubule networks (Zenke et al., 2004). To test whether HIV-1 and Vif impact AHRG2 binding to 14-3-3 proteins, we combined co-immunoprecipitation of ARHG2 with quantitative mass spectrometry in cells infected with WT, ΔVif, or mock (Figures 5F and S7). We identified 380 ARHG2-interacting proteins, including 14-3-3 family members ζ, ε, and η. We found that ARHG2 binding to 14-3-3 family members ζ, ε, and η was, in fact, significantly increased in cells infected with WT compared with both mock and ΔVif (Figure 5G; Table S6). It remains to be determined whether ARHG2 interactions with 14-3-3 proteins impacts HIV-1 infection processes.
Vpr reduces ubiquitination of histone H1 variants
Histone H1 variants were found to be deubiquitinated by HIV-1 infection at several positions. Figure 6A illustrates the ubiquitination sites identified on all histone H1 variants and their changes in cells infected with WT compared with mock. The central globular domain is highly conserved among histone H1 variants, and many modified peptides in this region could not distinguish precisely which variants were modified. The more variable N- and C-terminal regions allowed us to identify differentially decreased ubiquitination of histone H1 variants H1.2, H1.3, and H1.4 at positions K17 and K21 (aligned relative to H1.2) in response to HIV-1 infection, but histone H1.5 ubiquitination at these sites did not meet our thresholds for differential abundance. Histone H1.1 was not detected in protein abundance analysis and histone H1.0 was detected with far fewer peptides than the somatic variants, so it is possible that these histone H1 isoforms may be modified but are below the detection limit of our assay.
Figure 6. Vpr inhibits ubiquitination of histone H1 variants by CRL4DCAF1.
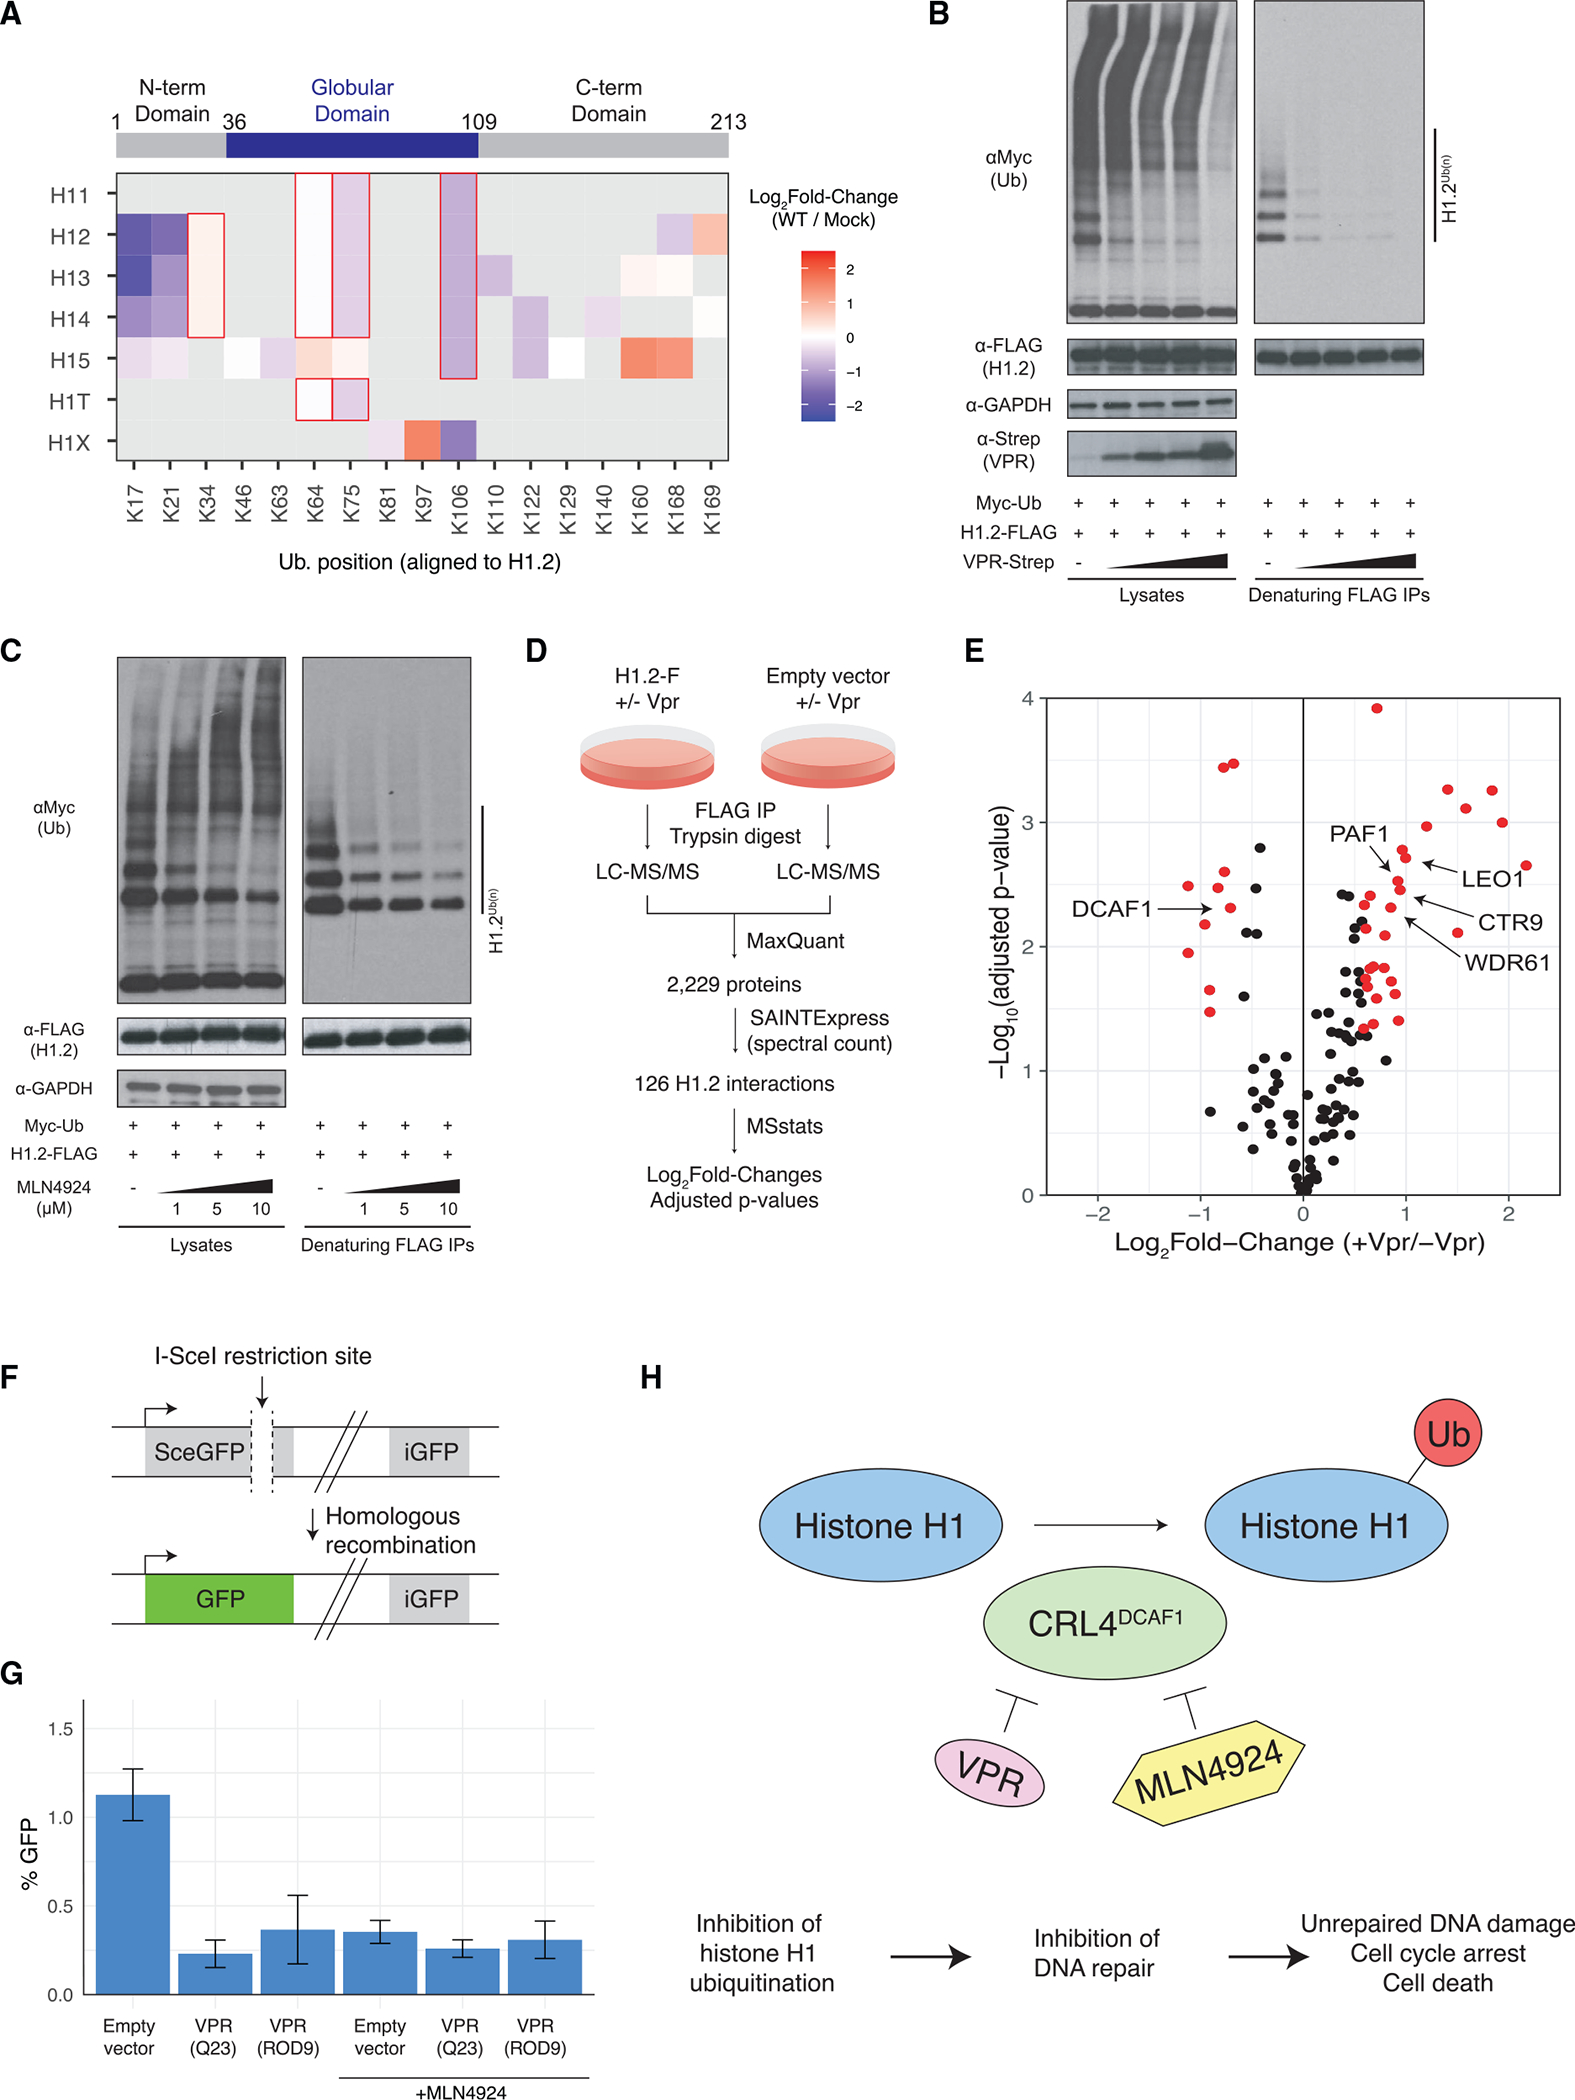
(A) Schematic of histone h1 protein domains (top; positions indicated are for histone H1.2). Heatmap of ubiquitination changes on histone H1 variants. All sites are aligned to the sequence positions of histone H1.2. Cells with a red outline were identified by peptides that cannot distinguish between histone variants.
(B) Denaturing ubiquitin immunoprecipitation analysis of histone H1.2 with Vpr titration.
(C) Denaturing ubiquitin immunoprecipitation analysis of histone H1.2 with MLN4924 titration.
(D) Schematic of experimental and data analysis workflows for quantitative AP-MS analysis of histone H1.2 in the presence and absence of Vpr co-expression.
(E) Volcano plot of histone H1.2 protein binding changes in response to Vpr expression. Proteins with |log2 fold change| > 0.58 (i.e., 1.5-fold change) and adjusted p value < 0.05 are highlighted in red.
(F) Schematic of a fluorescence-based assay for HDR of DNA double-strand breaks.
(G) HDR assay of cells in response to VPR expression and MLN4924 treatment. Bar heights represent an average of three biological replicates and error bars indicate the standard deviation (n = 3 biological replicates).
(H) A model for HIV-1 VPR-mediated inhibition of histone H1 ubiquitination, DNA repair, cell-cycle arrest, and cell death.
Our analysis of cells infected with Vif-, Vpu-, and Vpr-deficient HIV-1 revealed that ubiquitination of histone H1 variants H1.2 and H1.4 is Vpr dependent. We validated that Vpr expression reduced histone H1.2 ubiquitination by performing denaturing immunoprecipitation in cells co-transfected with histone H1.2, ubiquitin, and increasing amounts of Vpr (Figure 6B). Histone H1 variants physically interact with the CRL4DCAF1 ubiquitin ligase, which suggests two likely scenarios: (1) CRL4DCAF1 is a histone H1 ubiquitin ligase whose activity toward histone H1 is reduced by Vpr, or (2) Vpr hijacks CRL4DCAF1 to inhibit a histone H1 ubiquitin ligase (Kim et al., 2013b). To discern which of these scenarios occurs, we used a NEDD8 activating enzyme inhibitor, MLN4924, which inactivates Cullin RING-type E3 ubiquitin ligases by preventing their NEDDylation-based activation (Soucy et al., 2009). MLN4924 treatment reduced histone H1.2 ubiquitination in a dose-dependent manner similar to Vpr expression. This finding is consistent with the first scenario described above whereby CRL4DCAF1 is a histone H1 ubiquitin ligase that is inhibited by Vpr (Figure 6C).
To understand how Vpr inhibits ubiquitination of histone H1 variants, we next employed quantitative affinity purification and mass spectrometry (AP-MS) analysis to quantify changes in histone H1.2 protein interactions in response to Vpr co-expression (Figure 6D). HEK293T cells were transfected with FLAG-tagged histone H1.2 or an empty vector and co-transfected with Vpr or empty vector in biological triplicate for each condition and subjected to native FLAG AP-MS analysis. This analysis identified 126 histone H1.2-interacting proteins of which 28 and 10 were differentially increased or decreased by Vpr co-expression, respectively (Figures 6E and S8; Table S7). DCAF1 binding was reduced by 1.6-fold when Vpr was co-expressed, as well as three subunits of the mitochondrial ribosome. Increased binding was observed between histone H1.2 and members of the PAF1 complex (PAF1, CTR9, LEO1, and WDR61) when Vpr was co-expressed. These findings are consistent with a recent study that found a decreased association of the PAF1 complex with ubiquityl-histone H1 relative to unmodified histone H1 (Hollmuller et al., 2021).
Histone H1 ubiquitination plays a key role in the DNA damage response by facilitating the recruitment of repair factors BRCA1 and 53BP1 to sites of damage to initiate repair processes (Thorslund et al., 2015). Furthermore, Vpr has been recently demonstrated to inhibit DNA repair (Li et al., 2020). To test whether histone H1 deubiquitination affects DNA repair processes, we implemented a fluorescence-based assay of homology-directed repair (HDR) of DNA double-strand breaks (Figure 6F) (Pierce et al., 1999). In this system, I-SceI expression induces a double-strand break within a defective GFP locus that is made functional only when repaired by homologous recombination from a second GFP locus in the genome. Neither GFP locus is functional unless HDR occurs. We found that expression of VPR derived from HIV-1 (Q23 isolate) and HIV-2 (ROD9 isolate) inhibited HDR by up to 4-fold (Figure 6G). A similar reduction in HDR was observed when cells were treated with MLN4924, indicating that Cullin inhibition, and not Cullin-mediated degradation of a target protein, caused HDR impairment (Figure 6G).
DISCUSSION
In this study, we present a quantitative analysis of ubiquitination, phosphorylation, and protein abundance changes in response to HIV-1 infection. We demonstrate strategies to integrate and interpret proteomics data to identify host cellular pathways that are targeted by HIV-1 and to determine the molecular mechanisms by which HIV-1 perturbs their functions.
Integrating ubiquitination profiles with proteasome perturbations and protein abundance measurements
Our ubiquitination analysis identified many proteins that were ubiquitinated on multiple resides, and we demonstrated that a vast majority of those sites respond similarly to HIV-1 infection. This has implications on the experimental approaches intended to test the biological function of individual ubiquitination sites: if the exact site of ubiquitination is flexible, then mutating residues found to be ubiquitinated are unlikely to elicit an effect in a functional assay.
We have previously demonstrated that differential ubiquitination of APOBEC3C and CD4 in HIV-1-infected cells could only be observed in the presence of proteasome inhibition (Ball et al., 2016). By combining ubiquitination profiles of proteasome-inhibited, HIV-1-infected cells with protein abundance profiles of HIV-1-infected cells in which the proteasome was not inhibited, we rapidly identified PP2A-B56 and UNG as ubiquitination events that are destined for degradation by the proteasome and mapped their degradation correctly to Vif and Vpr, respectively. While proteasome inhibition is essential for identifying ubiquitination substrates that are targeted for proteasomal degradation, we found a low overlap between ubiquitination changes in the presence and absence of proteasome inhibition, suggesting that proteasome inhibition has profound effects on cellular ubiquitination profiles. This presents a challenge when interpreting ubiquitination profiles for proteins such as RUNX1 and RUNX2, where differential ubiquitination is observed only in the presence of proteasome inhibition but for which there are no observable changes in protein abundance. One possible explanation could be that only a minor subpopulation of these proteins is targeted for ubiquitination and degradation such that the total steady-state abundance of these proteins is not significantly perturbed.
In the case of RUNX proteins, HIV-1 Vif recruits the RUNX cofactor CFBβ into a complex with the CUL5EloB/EloC ubiquitin ligase in order to target APOBEC3 proteins for proteasomal degradation (Jager et al., 2011). CFBβ protects RUNX proteins from ubiquitination and degradation, and our findings are consistent with a model where Vif sequesters CFBβ and exposes RUNX proteins to ubiquitination (Huang et al., 2001; Kim et al., 2013a). That RUNX proteins are not observed to be differentially abundant in HIV-1-infected cells could imply that Vif is targeting a specific CBFβ-RUNX subpopulation for disruption. It will be of interest to identify the characteristics of that population (e.g., genomic location, PTMs, or relevant cofactors) and a mechanism for how a specific population is targeted by Vif.
Phosphoproteomics analysis identifies a requirement for Aurora kinase activity in HIV-1 infection
Phosphoproteomics analysis and subsequent kinase-substrate analysis revealed a strong enrichment for Aurora kinase A and B substrates in HIV-1-infected cells. This is consistent with a previous study that also reported an inverse correlation between phosphorylation sites that were more abundant in CEM-T4 cells infected with Vif-deficient than Vif-competent HIV-1 and sites that decreased upon inhibition with Aurora kinase A and B inhibitors (Greenwood et al., 2016). Our study complements this work in a Jurkat cell line and further profiles phosphoproteomics responses that are mediated by HIV-1 Vif, Vpu, and Vpr accessory factors. By investigating these accessory proteins, we identified an association between Vpr and Aurora kinase protein levels and activity.
The mechanism by which Aurora kinases promote HIV-1 replication is unclear. It has been reported that de novo HIV-1 infection and reactivation of latently infected primary CD4+ T cells increased protein levels of PLK1 and that inhibition of PLK1 promoted death of HIV-1-infected cells (Zhou et al., 2020). Aurora kinase A can regulate PLK1 activity, and it was demonstrated that Aurora kinase A inhibition modestly impaired the elevation of PLK1 protein levels in de novo infection and latency reactivation. In our study, we limited Aurora kinase inhibitor treatment duration to 24 h in order to separate the effects of inhibition on HIV-1 replication from its effects on cell viability. Interestingly, Aurora kinases A and B have both been reported to be inhibited by the DNA damage response (DDR) pathway, while it is well established that the HIV-1 Vpr protein activates DDR (Krystyniak et al., 2006; Monaco et al., 2005). How the Aurora kinases maintain their activity in the presence of activated DDR also remains to be determined.
Vpr modulates DNA damage signaling by inhibiting ubiquitination of histone H1 variants
Histone H1 ubiquitination plays a key role in the DDR by facilitating the recruitment of repair factors BRCA1 and 53BP1 to sites of damage to initiate repair processes (Thorslund et al., 2015). We found that Vpr inhibits histone H1 ubiquitination and HDR of double-strand DNA breaks. This is consistent with reports that HIV-1-infected cells accumulate double-strand DNA breaks in a Vpr-dependent manner and that even latently infected cells exhibit defects in DNA repair (Piekna-Przybylska et al., 2017; Tachiwana et al., 2006). Importantly, by demonstrating that MLN4924, a NEDD8-activating enzyme inhibitor, phenocopies Vpr in its capacity to inhibit HDR, we propose that Vpr’s capacity to inhibit a Cullin activity, and not to hijack Cullin activity, is responsible for the HDR phenotype.
It remains to be determined whether inhibition of histone H1 ubiquitination provides a benefit to HIV-1 infection. We found that histone H1.2 binding to the PAF1 complex is enhanced by Vpr. Several viruses target the PAF1 complex to suppress interferon-stimulated gene expression. Flaviviruses inhibit the recruitment of PAF1 complexes to interferon-stimulated gene locations via the NS5 protein, and the influenza virus NS1 protein mimics histones to bind PAF1 complexes and suppress antiviral gene expression (Marazzi et al., 2012; Shah et al., 2018). Therefore, it is plausible that HIV-1 perturbs PAF1 in a manner that suppresses interferon-stimulated gene expression. Histone H1 variants play important roles in chromatin accessibility, condensation, and gene regulation. It will be important to identify whether specific genome locations in host cells are being targeted by Vpr-mediated inhibition of histone H1 ubiquitination and what the consequences of this inhibition are on gene expression.
Limitations of the study
While primary CD4+ T cells would be a more relevant system to study HIV-1 infection, requirements for high amounts of starting material required (e.g., 2 × 10⁸ cells for global ubiquitination analysis) and high infection rates preclude their application at this time.
We found that two Aurora kinase A inhibitors reduced infection levels, while an Aurora kinase B inhibitor had no effect. Unfortunately, we could not achieve appreciable genetic reduction of Aurora kinase A or B without significant cell death to support the findings with inhibitors, presumably because these kinases are essentially involved in mitotic and cell-cycle processes. Therefore, we cannot decisively conclude the specific contributions of Aurora kinases A and B to HIV-1 replication at this time.
Our study identified phosphorylation and ubiquitination events associated with HIV-1 infection and specific HIV-1 accessory factors that lead to significant changes in the host cellular environment. Assessing the functional impact of individual PTM events is challenging for several reasons. We found that ubiquitination site changes on multiply ubiquitinated proteins were correlated with each other, which suggests that mutating individual residues may not impact protein function if additional sites on the protein can compensate (Figure 2F). Furthermore, while genetic reduction of protein levels by RNAi and CRISPR-Cas9 technologies is straightforward for amenable targets, these approaches affect the entire protein and do not inform on the specific contributions of individual PTMs. Rescuing genetic perturbations with WT and mutant cDNAs at the PTM site is required to assess the function of an individual residue, which precludes high-throughput assessment and would require an effective prioritization approach to focus on PTMs likely to have a functional effect. These limitations emphasize the importance of bioinformatics approaches to prioritize PTMs likely to have a functional impact based on additional factors such as proximity to other PTMs, functional protein domains, or protein interaction interfaces (Beltrao et al., 2012; Johnson et al., 2015). The breath-taking development of CRISPR-Cas9 DNA genome-editing technologies may enable approaches to systematically mutate modified residues in a genomic context and test their function in high-throughput manner feasible in the near future.
STAR★METHODS
RESOURCE AVAILABILITY
Lead contact
Further information and requests for resources and reagents should be directed to and will be fulfilled by the lead contact, Nevan Krogan (nevan.krogan@ucsf.edu).
Materials availability
Proviral pNL4-3 plasmids described in this paper (ΔEnv pNL4-3, ΔEnv ΔVif pNL4-3, ΔEnv ΔVpr pNL4-3, and ΔEnv ΔVpu pNL4-3) have been submitted to the NIH AIDS Reagent Program. Other plasmids described in this study are available from the lead contact upon request.
Data and code availability
Mass spectrometry data have been deposited at the ProteomeXchange Consortium via the PRIDE partner repository and are publicly available as of the date of publication. Accession numbers are listed in the key resources table.
This paper does not report original code.
Any additional information required to reanalyze the data reported in this paper is available from the lead contact upon request.
KEY RESOURCES TABLE.
| REAGENT or RESOURCE | SOURCE | IDENTIFIER |
|---|---|---|
| Antibodies | ||
| Ubiquitin Remnant Motif (K-ε-GG) immunoaffinity beads | Cell Signaling | Cat# 5562 |
| Rabbit Anti-GEF-H1 (ARHG2) antibody | Abcam | RRID:AB_2818944 |
| Rabbit IgG, polyclonal (isotype control) antibody | Abcam | RRID:AB_2631996 |
| Mouse Anti-Myc-HRP antibody | Thermo Fisher | Cat# R951-25; RRID:AB_2314045 |
| Rabbit Anti-FLAG antibody | Sigma | Cat# F7425; RRID:AB_439687 |
| Mouse Anti-GAPDH antibody | Sigma | Cat# G8795; RRID:AB_1078991 |
| Mouse Anti-FLAG M2 magnetic beads | Sigma | Cat# M8823; RRID:AB_2637089 |
| Mouse Anti-Strep II | Sigma | Cat# 71590-M; RRID:AB_10807650 |
| Mouse Anti-HIV-1 p24 FITC-conjugated (KC57) antibody | Beckman Coulter | Cat# 6604665; RRID:AB_1575987 |
| Anti-CD3/CD28 magnetic beads | Thermo Fisher | Cat# 11131D |
|
Bacterial and virus strains | ||
| NEB5alpha competent E. coli | NEB | C2987 |
|
Biological samples | ||
| Buffy coats | Blood Centers of the Pacific | N/A |
|
Chemicals, peptides, and recombinant proteins | ||
| Trypsin (sequencing grade) | Promega | V5111 |
| MLN8237 | Selleckchem | S1133 |
| MLN8054 | Selleckchem | S1100 |
| AZD1152-HQPA | Selleckchem | S1147 |
| MLN4924 | Selleckchem | S7109 |
| iRT peptides | Biognosys | iRT Kit |
|
Critical commercial assays | ||
| HIV-1 p24 ELISA | Abcam | Ab218268 |
|
Deposited data | ||
| Mass spectrometry data | Proteomics Identification Database (PRIDE) | PXD032085 |
|
Experimental models: Cell lines | ||
| Jurkat E6-1 | ATCC | TIB-152 |
| 293T | ATCC | CRL-3216 |
| U2OS | ATCC | HTB-96 |
|
Recombinant DNA | ||
| pNL4-3 | NIH AIDS Reagent Program | ARP-114 |
| pNL4-3 IRES-eGFP Nef+ (pBR43IeG-nef+) | NIH AIDS Reagent Program | ARP-11349 |
| pcDNA4-Histone H1.2-3xFLAG | Krogan Lab | N/A |
| pcDNA4-Myc-Ubiquitin | Krogan Lab | N/A |
| pcDNA4-Vpr-Strep | Krogan Lab | N/A |
| pNL4-3 ΔEnv | Krogan Lab | N/A |
| pNL4-3 ΔEnv/ΔVif | Krogan Lab | N/A |
| pNL4-3 ΔEnv/ΔVpr | Krogan Lab | N/A |
| pNL4-3 ΔEnv/ΔVpu | Krogan Lab | N/A |
| pMD2.G (VSV-G) | Addgene (via Didier Trono Lab) | 12259 |
|
| ||
| Software and algorithms | ||
|
| ||
| MaxQuant (version 2.6.8) | MaxQuant.org (Cox and Mann, 2008) | N/A |
| Spectronaut (version 14) | Biognosys (Bruderer et al., 2015) | N/A |
| MSstats (version 4) | Bioconductor (Choi et al., 2014) | N/A |
|
| ||
| Other | ||
|
| ||
| ReproSil-Pur 120 C18 AQ-1.9 packing material | ESI Source Solutions | r119.aq.0001 |
| Ni-NTA Agarose | QIAGEN | 30210 |
| EasySep Human CD4+ T cell isolation kit | Stemcell Technologies | 17952 |
| SepPak tC18 3cc desalting cartridges, 200 mg | Waters | WAT054925 |
EXPERIMENTAL MODELS AND SUBJECT DETAILS
Viruses
For global proteomics analyses, the pNL4-3 plasmid (obtained from the NIH AIDS Reagent Program) of HIV-1 was modified to prevent expression of the Env glycoprotein by mutating the start codon and introducing two stop codons (Adachi et al., 1986). All mutations maintain identical protein coding sequence for the overlapping Vpu open reading frame. Vif, Vpr, and Vpu were similarly mutated to disrupt their start codons and to introduce premature stop codons. For testing the effects of kinase inhibitors on HIV-1 infection in primary CD4+ T cells, cells were infected with a replication competent NL4-3/Nef-IRES/Renilla luciferase HIV-1 reporter virus that expresses Renilla lucieferase from an internal ribosome entry site, or IRES, that was provided by Sumit Chanda.
Cell lines
The Jurkat E6.1 T cell line was used as a model for T cells infected with HIV-1. Cells were grown in RPMI-1640 medium (Corning) supplemented with penicillin and streptomycin antibiotics (Gibco) and 10% fetal bovine serum (Gibco) at 37°C. The HEK293T cell line was used for virus production and protein interaction studies. Cells were grown in DMEM medium (Corning) supplemented with penicillin and streptomycin antibiotics (Gibco) and 10% fetal bovine serum (Gibco) at 37°C.
Human primary CD4+ T cells
Human T cell isolation and leukoreduction chambers from healthy, anonymous donors were purchased from Blood Centers of the Pacific and processed within 12 h. Primary CD4+ T cells were harvested by positive selection using a FABian automated enrichment system and CD4 isolation kit (IBA Lifesciences). Isolated T cells were suspended in complete RPMI-1640 medium supplemented with 5 mM HEPES, 2 mM glutamine, 50 μg/mL penicillin/streptomycin, 5 mM nonessential amino acids, 5 mM sodium pyruvate, and 10% fetal bovine serum (Atlanta Biologicals). These cells were immediately stimulated on anti-CD3-coated plates (coated overnight with 10 μg/mL anti-CD3 from Tonbo Biosciences) in the presence of 5 μg/mL soluble anti-CD28 (CD28.2, Tonbo Biosciences). Cells were stimulated for 48 h prior to infection.
METHOD DETAILS
Virus production
HEK293T cells were transfected in T-175 flask format with 22.02 μg of ΔEnv pNL4-3 HIV-1 provirus and 2.98 μg pcDNA/VSVg using acidified PEI pH 4 in lactate-buffered saline (LBS), which yielded a stoichiometric ratio of 3:1 provirus:envelope. Viral supernatant was collected 48 h after transfection, cleared by centrifugation, and filtered through a 0.45 μm filter. Virus was precipitated by addition of 50% PEG-6000 and 4M NaCl to final concentrations of 8.5% and 0.3M, respectively, followed by incubation at 4° for 2 h, centrifugation and resuspension in phosphate buffer saline (PBS). Viral titer was quantified by titration on Jurkat T cells followed by fixation, staining with anti-HIV-1 Core Antigen Clone KC57 FITC (Beckman Coulter) and detection of HIV-1-infected cells by flow cytometry. Vif-, Vpr-, and Vpu-deficient viruses were produced in the same manner.
HIV-1 infection of jurkat T cells
For ubiquitination analysis, Jurkat cells were first labeled with light and heavy SILAC medium for two weeks. SILAC medium was comprised of RPMI-1640 lacking L-Lysine and L-Arginine supplemented with 10% dialyzed FCS, antibiotics, and natural L-Lysine and L-Arginine (for light medium) and 13C6-Lysine and 13C6,15N4-Argining for heavy medium. The efficiency of stable isotope-labeled amino acids incorporation was assessed by analyzing an aliquot of a lysate from cells grown in heavy medium to ensure that the amount of unlabeled proteins was <1%. All infections were performed by spinoculation for 2 h at 1400 × g with VSVg pseudotyped HIV-1 at MOI of 5 in the presence of 1 μg/mL PEI (Polysciences) and 16 μg/mL Polybrene (Sigma-Aldrich).
Preparation of samples for global ubiquitination, phosphorylation, and protein abundance analysis
Infected cells were lysed in a buffer containing 8M urea, 50 mM ammonium bicarbonate, 150 mM NaCl, and PhosStop and Complete-EDTA free phosphatase and protease inhibitors (Roche) and sonicated to sheer membranes and DNA. Protein concentrations were measured by a Bradford assay. For SILAC analyses, light and heavy cells for each comparison (i.e., ΔEnv vs. mock, ΔEnv vs. ΔEnvΔVif, ΔEnv vs. ΔEnvΔVpr, ΔEnv vs. ΔEnvΔVpu) were combined at equal protein concentrations. Lysates were reduced by the addition of 4 mM TCEP (Sigma) for 30 min at room temperature, disulfide bonds were alkylated with 10 mM iodoacetamide (Sigma) for 30 min in the dark at room temperature, and excess iodoacetamide was quenched with 20 mM DTT (Sigma). Lysates were diluted 1:4 in 50 mM ammonium bicarbonate and trypsin was added at a 1:100 enzyme:substrate ratio. Lysates were digested for 18 h at room temperature with rotation. Digested lysates were acidifed with 0.1% TFA and peptides concentrated on Sep-Pak C18 solid phase extraction columns (Waters). For ubiquitin remnant analysis, an amount of digested lysate equivalent to 10 mg of protein was subjected to ubiquitin remnant immunoprecipitation according to the manufacturer’s protocol (Cell Signaling Technologies). For phosphorylation analysis, an amount of digested lysate equivalent to 1 mg of protein was lyophilized and then resuspended in a buffer containing 75% ACN with 0.1% TFA. Peptides were incubated with Fe3+-immobilized metal affinity chromatography (IMAC) beads, washed with the same resuspension buffer, and then phosphopeptides were eluted with 500 mM HK2PO4. For both ubiquitin remnant-enriched and phosphopeptide-enriched samples, the purified material was desalted using homemade C18 STAGE tips, evaporated to dryness, and then resuspended in 0.1% formic acid for mass spectrometry analysis (Rappsilber et al., 2007).
ARHG2 immunoprecipitation for IP-MS
10 million Jurkat E6.1 cells per sample were lysed in cold IP buffer (5 mM Tris-HCl pH 7.4, 150 mM NaCl, 1 mM EDTA, Complete EDTA-free protease inhibitor tablet) with 0.5% NP-40. Debris was pelleted and lysates incubated with Rabbit anti-ARHG2 antibody (Abcam) or isotype control (Abcam). Lysates were incubated with antibody overnight at 4°C, then with Protein A dynabeads (Thermo Scientific) for 2 h at 4°C. Beads were washed three times in IP buffer with 0.05% NP-40, then once in IP buffer with no detergent. Samples were eluted with 0.2 M Glycine-HCl pH 2.5 for 5 min at room temperature. The pH of eluates was neutralized by adding Tris-HCl pH 8.0 to a final concentration of 100 mM.
Histone H1.2 FLAG affinity purification for AP-MS
HEK293T cells were co-transfected in 15 cm format with 3 μg pcDNA4/histone H1.2-3xFLAG with 12 μg of pcDNA4 or with 60 ng pcDNA4/VPR-2xStrep and 11.04 μg pcDNA4 using the PolyJet transfection reagent (SignaGen). Cells were harvested 48 h after transfection by lysis in cold IP buffer (5 mM Tris-HCl pH 7.4, 150 mM NaCl, 1 mM EDTA, Complete EDTA-free protease inhibitor tablet) with 0.5% NP-40. Debris was pelleted and 40 μL of a 50% slurry of anti-FLAG M2 magnetic beads (Sigma) were added for 2 h. The sample was eluted by with 100 μg/mL 3xFLAG peptide (Elim Bio) in IP buffer with 0.05% Rapigest SF (Waters).
Preparation of IP-MS and AP-MS samples for mass spectrometry analysis
IP-MS and AP-MS samples were added to a buffer containing 2M urea, 10 mM ammonium bicarbonate, and 2 mM DTT. Samples were reduced at 60°C for 30 min and alkylated with 2 mM iodoacetamide for 30 min at room temperature in the dark. Trypsin was then added at a 1:100 enzyme:substrate ratio. Samples were digested for 18 h at 37°C and then desalted using C18 STAGE tips, evaporated to dryness, and then resuspended in 0.1% formic acid for mass spectrometry analysis.
Denaturing ubiquitin immunoprecipitation
For denaturing ubiquitin immunoprecipitation experiments, HEK293T cells were co-transfected in 6 cm format with 500 ng pcDNA4/histone H1.2-3xFLAG, 500 ng pcDNA/Myc-Ub, 500 ng pMaxGFP, and pcDNA4/TO to bring the total transfected amount to 2 μg. Cells were harvested 48 h after transfection by pelleting cells, lysing in 150 μL SDS lysis buffer (1% SDS, 50 mM Tris-HCl pH 8.0, 150 mM NaCl) and boiling at 95°C for 10 min. Samples were sonicated to sheer DNA and insoluble material was pelleted by centrifugation at 14,000 × g. 10 μL of a 50% slurry of anti-FLAG M2 magnetic beads (Sigma) was incubated with the samples for 2 h at 4°C and then were washed three times with RIPA buffer. Samples were eluted in 30 μL Laemmli sample buffer (Bio-Rad) and boiling at 95°C for 10 min. Samples were then separated by gel electrophoresis using a Criterion TGX gel (Bio-RAD), transferred to a nitrocellulose membrane, blocked with either 5% milk or 2% BSA in Tris-buffered sale (TBS) with 0.1% Tween 20, incubated with antibody, and developed with Pierce ECL Western Blotting Substrate (Thermo) and autoradiographic film (Amersham). Antibodies were used at the following concentrations: Myc-HRP (Thermo) at 1:5000, rabbit anti-FLAG (Sigma) at 1:5000, mouse anti-GAPDH (Sigma) at 1:2000, mouse anti-Strep II (Sigma) at 1:2000, goat anti-mouse-HFP (Bio-Rad) at 1:10,000, and goat anti-rabbit-HRP (Bio-Rad) at 1:10,000.
Mass spectrometry analysis
Ubiquitination samples were analyzed on a Thermo Scientific LTQ Orbitrap Elite mass spectrometry system equipped with an Easy nLC 1000 uHPLC system interfaced with the mass spectrometer via a Nanoflex II nanoelectrospray source. Samples were injected onto a C18 reverse phase capillary column (75 μm inner diameter × 25 cm, packed with 1.9 μm Reprosil Pur C18-AQ particles). Peptides were then separated by an organic gradient from 5% to 30% in 0.1% formic acid over 112 min at a flow rate of 300 nL/min. The mass spectrometry collected data in a data-dependent fashion, collecting one full scan in the Orbitrap (120,000 resolution, 50 ms maximum injection time, 400,000 AGC target) followed by 20 collision-induced dissociation MS/MS scans in the dual linear ion trap for the 20 most intense peaks from the full scan. Dynamic exclusion was employed with an exclusion duration of 20 s. Charge state screening was enabled to reject MS/MS analysis of singly charged species or species for which a charge could not be assigned.
Phosphorylation and protein abundance samples were analyzed on a Thermo Scientific Orbitrap Eclipse mass spectrometry system equipped with an Easy nLC 1200 uHPLC system interfaced with the mass spectrometer via a Nanoflex II nanoelectrospray source. Samples were injected onto a C18 reverse phase capillary column (75 μm inner diameter × 25 cm, packed with 1.9 μm Reprosil Pur C18-AQ particles). Peptides were then separated by an organic gradient from 5% to 30% in 0.1% formic acid over 120 min at a flow rate of 300 nL/min. To build a spectral library, biological replicates were pooled and analyzed by a data-dependent acquisition method with a full scan in the Orbitrap (120,000 resolution, 400–1300 m/z scan range, 50 ms maximum injection time, AGC target of 400,000) followed by the maximum number of high energy collision-induced dissociation MS/MS scans that could be obtained within 3 s. MS/MS scans were collected in the Orbitrap (15,000 resolution, 22 ms maximum injection time, 50,000 AGC target, isolation in quadrupole, isolation window 1.6 m/z). Dynamic exclusion was enabled to exclude peaks with an exclusion duration of 45 s and a mass tolerance of +/− 10 ppm. Charge state screening was enabled to reject MS/MS analysis of singly charged species or species for which the charge could not be assigned.
Individual samples were analyzed by a data-independent acquisition method with a full scan in the Orbitrap (60,000 resolution, 390–1010 m/z scan range, 50 ms maximum injection time, AGC target of 400,000) followed by 30 MS/MS scans in the Orbitrap spanning the full scan mass range in 8 m/z windows (15,000 resolution, 22 ms maximum injection time, 400,000 AGC target, isolation in quadrupole).
ARHG2 IP-MS and histone H1.2 AP-MS samples were analyzed on a Thermo Scientific Orbitrap Fusion mass spectrometry system equipped with an Easy nLC 1200 uHPLC system interfaced with the mass spectrometer via a Nanoflex II nanoelectrospray source. The sample capillary columns were used as above. For phosphoproteomics analysis, peptides were separated by an organic gradient from 5% to 30% ACN in 0.1% formic acid over 172 min at a flow rate of 300 nL/min. For AP-MS analysis the gradient was over 52 min at the same flow rate. In both cases the mass spectrometer collected data in a data-dependent fashion, collecting one full scan in the Orbitrap (240,000 resolution, 50 ms maximum injection time, 400,000 AGC target) followed by the maximum number of high energy collision-induced dissociation MS/MS scans that could obtained in the dual linear ion trap within 3 s. Dynamic exclusion was enabled for 30 s. Charge state screening was enabled to reject MS/MS analysis of singly charged species or species for which the charge could not be assigned.
QUANTIFICATION AND STATISTICAL ANALYSIS
Mass spectrometry data analysis
Mass spectrometry data was analyzed by MaxQuant and Spectronaut to identify peptides/proteins, localize post-translational modifications, and extract quantitative information (Bruderer et al., 2015; Cox and Mann, 2008). False discovery rates were estimated using a decoy database strategy (Elias and Gygi, 2007). All data were filtered to achieve a false discovery rate of 0.01 for peptide-spectrum matches, peptide identifications, and protein identifications. Search parameters included a fixed modification for carbamidomethyl cysteine and variable modifications for N-terminal protein acetylation, methionine oxidation, and serine, threonine and tyrosine phosphorylation for phosphoenriched samples and diglycine-modified lysine for ubiquitin remnant-enriched samples. All other search parameters were defaults for the respective algorithms.
The MSstats statistical package was employed to integrate data from technical and biological replicates to estimate log2 fold changes, p values, and adjusted p values (Choi et al., 2014). All data were normalized by equalizing median intensities, the summary method was Tukey’s median polish, and the maximum quantile for deciding censored missing values was 0.999.
Gene ontology enrichment analysis
Gene ontology enrichment analysis was performed by hypergeometric testing using the dhyper function in R. p values were adjusted for multiple testing using the Benjamini-Hochberg method (Benjamini and Hochberg, 1995).
Kinase activity analysis
Kinase activity analysis was performed using the FGSEA package in R and kinase-substrate annotations in the PhosphoSitePlus resource (Hornbeck et al., 2015; Korotkevich et al., 2021). p-values were adjusted for multiple testing using the Benjamini-Hochberg method (Benjamini and Hochberg, 1995).
Supplementary Material
Highlights.
Integrated analysis of HIV-1-mediated changes in posttranslational modifications
HIV-1 requires Aurora kinase activity for productive infection
HIV-1 Vpr is associated with decreased ubiquitination of histone H1 isoforms
ACKNOWLEDGMENTS
This research was funded by grants from the National Institutes of Health (P50 AI150476, U19 AI135990, and U19 AI135972) and by funding from F. Hoffmann-La Roche and Vir Biotechnology to N.J.K. and R01 AI147837 to O.I. A.M. holds a Career Award for Medical Scientists from the Burroughs Wellcome Fund, is an investigator at the Chan Zuckerberg Biohub, and has received funding from the Innovative Genomics Institute (IGI) and the Parker Institute for Cancer Immunotherapy (PICI). P.B. is supported by the Helmut Horten Stiftung and the ETH Zürich Foundation. A.M. is supported by a Cancer Research Institute (CRI) Lloyd J. Old STAR career award.
Footnotes
DECLARATION OF INTERESTS
The Krogan Laboratory has received research support from Vir Biotechnology and F. Hoffmann-La Roche. N.J.K. has consulting agreements with the Icahn School of Medicine at Mount Sinai, Maze Therapeutics, and Interline Therapeutics, is a shareholder in Tenaya Therapeutics, Maze Therapeutics, and Interline Therapeutics, and is a financially compensated scientific advisory board member for GEn1E Lifesciences, Inc. A.M. is a compensated cofounder, a member of the board of directors, and a member of the scientific advisory boards of Spotlight Therapeutics and Arsenal Biosciences. A.M. is a cofounder, a member of the board of directors, and a member of the scientific advisory board of Survey Genomics. A.M. is a compensated member of the scientific advisory board of NewLimit. A.M. owns stock in Arsenal Biosciences, Spotlight Therapeutics, NewLimit, Survey Genomics, PACT Pharma, and Merck. A.M. has received fees from 23andMe, PACT Pharma, Juno Therapeutics, Trizell, Vertex, Merck, Amgen, Genentech, AlphaSights, Rupert Case Management, Bernstein, and ALDA. A.M. is an investor in and informal advisor to Offline Ventures and a client of EPIQ. The Marson lab has received research support from Juno Therapeutics, Epinomics, Sanofi, GlaxoSmithKline, Gilead, and Anthem.
SUPPLEMENTAL INFORMATION
Supplemental information can be found online at https://doi.org/10.1016/j.celrep.2022.110690.
REFERENCES
- Ashburner M, Ball CA, Blake JA, Botstein D, Butler H, Cherry JM, Davis AP, Dolinski K, Dwight SS, Eppig JT, et al. (2000). Gene ontology: tool for the unification of biology. The Gene Ontology Consortium. Nat. Genet. 25, 25–29. [DOI] [PMC free article] [PubMed] [Google Scholar]
- Ball KA, Johnson JR, Lewinski MK, Guatelli J, Verschueren E, Krogan NJ, and Jacobson MP (2016). Non-degradative ubiquitination of protein kinases. PLoS Comput. Biol. 12, e1004898. [DOI] [PMC free article] [PubMed] [Google Scholar]
- Bartz SR, Rogel ME, and Emerman M (1996). Human immunodeficiency virus type 1 cell cycle control: Vpr is cytostatic and mediates G2 accumulation by a mechanism which differs from DNA damage checkpoint control. J. Virol. 70, 2324–2331. [DOI] [PMC free article] [PubMed] [Google Scholar]
- Beltrao P, Albanese V, Kenner LR, Swaney DL, Burlingame A, Villen J, Lim WA, Fraser JS, Frydman J, and Krogan NJ (2012). Systematic functional prioritization of protein posttranslational modifications. Cell 150, 413–425. [DOI] [PMC free article] [PubMed] [Google Scholar]
- Benjamini Y, and Hochberg Y (1995). Controlling the false discovery rate: a practical and powerful approach to multiple testing. J. R. Stat. Soc. Ser. B 57, 289–300. [Google Scholar]
- Bruderer R, Bernhardt OM, Gandhi T, Miladinović SM, Cheng SM, Messner S, Ehrenberger T, Zanotelli V, Burscheid Y, Vitek O, Rinner O, and Reiter L (2015). Extending the limits of quantitative proteome profiling with data-independent acquisition and application to acetaminophen-treated three-dimensional liver microtissues. Mol. Cell. Proteomics 14, 1400–1410. [DOI] [PMC free article] [PubMed] [Google Scholar]
- Choi M, Chang CY, Clough T, Broudy D, Killeen T, MacLean B, and Vitek O (2014). MSstats: an R package for statistical analysis of quantitative mass spectrometry-based proteomic experiments. Bioinformatics 30, 2524–2526. [DOI] [PubMed] [Google Scholar]
- Chou MF, and Schwartz D (2011). Biological sequence motif discovery using motif-x. Curr. Protoc. Bioinf. 35, 13.15.1–13.15.24. [DOI] [PubMed] [Google Scholar]
- Chougui G, Munir-Matloob S, Matkovic R, Martin MM, Morel M, Lahouassa H, Leduc M, Ramirez BC, Etienne L, and Margottin-Goguet F (2018). HIV-2/SIV viral protein X counteracts HUSH repressor complex. Nat. Microbiol. 3, 891–897. [DOI] [PubMed] [Google Scholar]
- Cox J, and Mann M (2008). MaxQuant enables high peptide identification rates, individualized p.p.b.-range mass accuracies and proteome-wide protein quantification. Nat. Biotechnol. 26, 1367–1372, In press. [DOI] [PubMed] [Google Scholar]
- Elias JE, and Gygi SP (2007). Target-decoy search strategy for increased confidence in large-scale protein identifications by mass spectrometry. Nat. Methods 4, 207–214. [DOI] [PubMed] [Google Scholar]
- Gene Ontology C (2021). The Gene Ontology resource: enriching a GOld mine. Nucleic Acids Res. 49, D325–D334. [DOI] [PMC free article] [PubMed] [Google Scholar]
- Greenwood EJ, Matheson NJ, Wals K, van den Boomen DJ, Antrobus R, Williamson JC, and Lehner PJ (2016). Temporal proteomic analysis of HIV infection reveals remodelling of the host phosphoproteome by lentiviral Vif variants. eLife 5, e18296. [DOI] [PMC free article] [PubMed] [Google Scholar]
- Grossmann J, Roschitzki B, Panse C, Fortes C, Barkow-Oesterreicher S, Rutishauser D, and Schlapbach R (2010). Implementation and evaluation of relative and absolute quantification in shotgun proteomics with label-free methods. J. Proteomics 73, 1740–1746. [DOI] [PubMed] [Google Scholar]
- Harris RS, Bishop KN, Sheehy AM, Craig HM, Petersen-Mahrt SK, Watt IN, Neuberger MS, and Malim MH (2003). DNA deamination mediates innate immunity to retroviral infection. Cell 113, 803–809. [DOI] [PubMed] [Google Scholar]
- Hernandez-Armenta C, Ochoa D, Goncalves E, Saez-Rodriguez J, and Beltrao P (2017). Benchmarking substrate-based kinase activity inference using phosphoproteomic data. Bioinformatics 33, 1845–1851. [DOI] [PMC free article] [PubMed] [Google Scholar]
- Hollmuller E, Geigges S, Niedermeier ML, Kammer KM, Kienle SM, Rosner D, Scheffner M, Marx A, and Stengel F (2021). Site-specific ubiquitylation acts as a regulator of linker histone H1. Nat. Commun. 12, 3497. [DOI] [PMC free article] [PubMed] [Google Scholar]
- Hornbeck PV, Zhang B, Murray B, Kornhauser JM, Latham V, and Skrzypek E (2015). PhosphoSitePlus, 2014: mutations, PTMs and recalibrations. Nucleic Acids Res. 43, D512–D520. [DOI] [PMC free article] [PubMed] [Google Scholar]
- Hrecka K, Hao C, Gierszewska M, Swanson SK, Kesik-Brodacka M, Srivastava S, Florens L, Washburn MP, and Skowronski J (2011). Vpx relieves inhibition of HIV-1 infection of macrophages mediated by the SAMHD1 protein. Nature 474, 658–661. [DOI] [PMC free article] [PubMed] [Google Scholar]
- Huang G, Shigesada K, Ito K, Wee HJ, Yokomizo T, and Ito Y (2001). Dimerization with PEBP2beta protects RUNX1/AML1 from ubiquitin-proteasome-mediated degradation. EMBO J. 20, 723–733. [DOI] [PMC free article] [PubMed] [Google Scholar]
- Jager S, Kim DY, Hultquist JF, Shindo K, LaRue RS, Kwon E, Li M, Anderson BD, Yen L, Stanley D, et al. (2011). Vif hijacks CBF-beta to degrade APOBEC3G and promote HIV-1 infection. Nature 481, 371–375. [DOI] [PMC free article] [PubMed] [Google Scholar]
- Johnson JR, Santos SD, Johnson T, Pieper U, Strumillo M, Wagih O, Sali A, Krogan NJ, and Beltrao P (2015). Prediction of functionally important phospho-regulatory events in Xenopus laevis oocytes. PLoS Comput. Biol. 11, e1004362. [DOI] [PMC free article] [PubMed] [Google Scholar]
- Kim DY, Kwon E, Hartley PD, Crosby DC, Mann S, Krogan NJ, and Gross JD (2013a). CBFbeta stabilizes HIV Vif to counteract APOBEC3 at the expense of RUNX1 target gene expression. Mol. Cell 49, 632–644. [DOI] [PMC free article] [PubMed] [Google Scholar]
- Kim K, Lee B, Kim J, Choi J, Kim JM, Xiong Y, Roeder RG, and An W (2013b). Linker Histone H1.2 cooperates with Cul4A and PAF1 to drive H4K31 ubiquitylation-mediated transactivation. Cell Rep. 5, 1690–1703. [DOI] [PMC free article] [PubMed] [Google Scholar]
- Kondapi AK, Padmaja G, Satyanarayana N, Mukhopadyaya R, and Reitz MS (2005). A biochemical analysis of topoisomerase II alpha and beta kinase activity found in HIV-1 infected cells and virus. Arch. Biochem. Biophys. 441, 41–55. [DOI] [PubMed] [Google Scholar]
- Korotkevich G, Sukhov V, Budin N, Shpak B, Artyomov MN, and Sergushichev A (2021). Fast gene set enrichment analysis. Preprint at bioRxiv. 10.1101/060012. [DOI] [Google Scholar]
- Krystyniak A, Garcia-Echeverria C, Prigent C, and Ferrari S (2006). Inhibition of Aurora A in response to DNA damage. Oncogene 25, 338–348. [DOI] [PubMed] [Google Scholar]
- Laguette N, Sobhian B, Casartelli N, Ringeard M, Chable-Bessia C, Segeral E, Yatim A, Emiliani S, Schwartz O, and Benkirane M (2011). SAMHD1 is the dendritic- and myeloid-cell-specific HIV-1 restriction factor counteracted by Vpx. Nature 474, 654–657. [DOI] [PMC free article] [PubMed] [Google Scholar]
- Laguette N, Bregnard C, Hue P, Basbous J, Yatim A, Larroque M, Kirchhoff F, Constantinou A, Sobhian B, and Benkirane M (2014). Premature activation of the SLX4 complex by Vpr promotes G2/M arrest and escape from innate immune sensing. Cell 156, 134–145. [DOI] [PubMed] [Google Scholar]
- Lahouassa H, Blondot ML, Chauveau L, Chougui G, Morel M, Leduc M, Guillonneau F, Ramirez BC, Schwartz O, and Margottin-Goguet F (2016). HIV-1 Vpr degrades the HLTF DNA translocase in T cells and macrophages. Proc. Natl. Acad. Sci. U S A 113, 5311–5316. [DOI] [PMC free article] [PubMed] [Google Scholar]
- Li D, Lopez A, Sandoval C, Nichols Doyle R, and Fregoso OI (2020). HIV Vpr modulates the host DNA damage response at two independent steps to damage DNA and repress double-strand DNA break repair. mBio 11, e00940–20. [DOI] [PMC free article] [PubMed] [Google Scholar]
- Lv L, Wang Q, Xu Y, Tsao LC, Nakagawa T, Guo H, Su L, and Xiong Y (2018). Vpr targets TET2 for degradation by CRL4(VprBP) E3 ligase to sustain IL-6 expression and enhance HIV-1 replication. Mol. Cell 70, 961–970.e5. [DOI] [PMC free article] [PubMed] [Google Scholar]
- Manfredi MG, Ecsedy JA, Meetze KA, Balani SK, Burenkova O, Chen W, Galvin KM, Hoar KM, Huck JJ, LeRoy PJ, et al. (2007). Antitumor activity of MLN8054, an orally active small-molecule inhibitor of Aurora A kinase. Proc. Natl. Acad. Sci. U S A 104, 4106–4111. [DOI] [PMC free article] [PubMed] [Google Scholar]
- Marazzi I, Ho JS, Kim J, Manicassamy B, Dewell S, Albrecht RA, Seibert CW, Schaefer U, Jeffrey KL, Prinjha RK, et al. (2012). Suppression of the antiviral response by an influenza histone mimic. Nature 483, 428–433. [DOI] [PMC free article] [PubMed] [Google Scholar]
- Matthes E, Langen P, Brachwitz H, Schroder HC, Maidhof A, Weiler BE, Renneisen K, and Muller WE (1990). Alteration of DNA topoisomerase II activity during infection of H9 cells by human immunodeficiency virus type 1 in vitro: a target for potential therapeutic agents. Antivir. Res. 13, 273–286. [DOI] [PubMed] [Google Scholar]
- Mertins P, Qiao JW, Patel J, Udeshi ND, Clauser KR, Mani DR, Burgess MW, Gillette MA, Jaffe JD, and Carr SA (2013). Integrated proteomic analysis of post-translational modifications by serial enrichment. Nat. Methods 10, 634–637. [DOI] [PMC free article] [PubMed] [Google Scholar]
- Monaco L, Kolthur-Seetharam U, Loury R, Murcia JM, de Murcia G, and Sassone-Corsi P (2005). Inhibition of Aurora-B kinase activity by poly(ADP-ribosyl)ation in response to DNA damage. Proc. Natl. Acad. Sci. U S A 102, 14244–14248. [DOI] [PMC free article] [PubMed] [Google Scholar]
- Neil SJ, Zang T, and Bieniasz PD (2008). Tetherin inhibits retrovirus release and is antagonized by HIV-1 Vpu. Nature 451, 425–430. [DOI] [PubMed] [Google Scholar]
- Ong SE, Blagoev B, Kratchmarova I, Kristensen DB, Steen H, Pandey A, and Mann M (2002). Stable isotope labeling by amino acids in cell culture, SILAC, as a simple and accurate approach to expression proteomics. Mol. Cell. Proteomics 1, 376–386. [DOI] [PubMed] [Google Scholar]
- Oughtred R, Stark C, Breitkreutz BJ, Rust J, Boucher L, Chang C, Kolas N, O’Donnell L, Leung G, McAdam R, et al. (2019). The BioGRID interaction database: 2019 update. Nucleic Acids Res. 47, D529–D541. [DOI] [PMC free article] [PubMed] [Google Scholar]
- Piekna-Przybylska D, Sharma G, Maggirwar SB, and Bambara RA (2017). Deficiency in DNA damage response, a new characteristic of cells infected with latent HIV-1. Cell Cycle 16, 968–978. [DOI] [PMC free article] [PubMed] [Google Scholar]
- Pierce AJ, Johnson RD, Thompson LH, and Jasin M (1999). XRCC3 promotes homology-directed repair of DNA damage in mammalian cells. Genes Dev. 13, 2633–2638. [DOI] [PMC free article] [PubMed] [Google Scholar]
- Rappsilber J, Mann M, and Ishihama Y (2007). Protocol for micro-purification, enrichment, pre-fractionation and storage of peptides for proteomics using StageTips. Nat. Protoc. 2, 1896–1906. [DOI] [PubMed] [Google Scholar]
- Salamango DJ, and Harris RS (2020). Dual functionality of HIV-1 Vif in APOBEC3 counteraction and cell cycle arrest. Front. Microbiol. 11, 622012. [DOI] [PMC free article] [PubMed] [Google Scholar]
- Sauter D, and Kirschhoff F (2018). Multilayered and versatile inhibition of cellular antiviral factors by HIV and SIV accessory proteins. Cytokine Growth Factor Rev. 40, 3–12. [DOI] [PubMed] [Google Scholar]
- Selig L, Benichou S, Rogel ME, Wu LI, Vodicka MA, Sire J, Benarous R, and Emerman M (1997). Uracil DNA glycosylase specifically interacts with Vpr of both human immunodeficiency virus type 1 and simian immunodeficiency virus of sooty mangabeys, but binding does not correlate with cell cycle arrest. J. Virol. 71, 4842–4846. [DOI] [PMC free article] [PubMed] [Google Scholar]
- Shah PS, Link N, Jang GM, Sharp PP, Zhu T, Swaney DL, Johnson JR, Von Dollen J, Ramage HR, Satkamp L, et al. (2018). Comparative flavivirus-host protein interaction mapping reveals mechanisms of dengue and zika virus pathogenesis. Cell 175, 1931–1945.e18. [DOI] [PMC free article] [PubMed] [Google Scholar]
- Sheehy AM, Gaddis NC, Choi JD, and Malim MH (2002). Isolation of a human gene that inhibits HIV-1 infection and is suppressed by the viral Vif protein. Nature 418, 646–650. [DOI] [PubMed] [Google Scholar]
- Soucy TA, Smith PG, Milhollen MA, Berger AJ, Gavin JM, Adhikari S, Brownell JE, Burke KE, Cardin DP, Critchley S, et al. (2009). An inhibitor of NEDD8-activating enzyme as a new approach to treat cancer. Nature 458, 732–736. [DOI] [PubMed] [Google Scholar]
- Subramanian A, Tamayo P, Mootha VK, Mukherjee S, Ebert BL, Gillette MA, Paulovich A, Pomeroy SL, Golub TR, Lander ES, et al. (2005). Gene set enrichment analysis: a knowledge-based approach for interpreting genome-wide expression profiles. Proc. Natl. Acad. Sci. U S A 102, 15545–15550. [DOI] [PMC free article] [PubMed] [Google Scholar]
- Tachiwana H, Shimura M, Nakai-Murakami C, Tokunaga K, Takizawa Y, Sata T, Kurumizaka H, and Ishizaka Y (2006). HIV-1 Vpr induces DNA double-strand breaks. Cancer Res. 66, 627–631. [DOI] [PubMed] [Google Scholar]
- Thorslund T, Ripplinger A, Hoffmann S, Wild T, Uckelmann M, Villumsen B, Narita T, Sixma TK, Choudhary C, Bekker-Jensen S, et al. (2015). Histone H1 couples initiation and amplification of ubiquitin signalling after DNA damage. Nature 527, 389–393. [DOI] [PubMed] [Google Scholar]
- Tomita M, and Mori N (2010). Aurora A selective inhibitor MLN8237 suppresses the growth and survival of HTLV-1-infected T-cells in vitro. Cancer Sci. 101, 1204–1211. [DOI] [PMC free article] [PubMed] [Google Scholar]
- Wang Q, and Su L (2019). Vpr enhances HIV-1 Env processing and virion infectivity in macrophages by modulating TET2-dependent IFITM3 expression. mBio 10, e01344–19. [DOI] [PMC free article] [PubMed] [Google Scholar]
- Wilkinson RW, Odedra R, Heaton SP, Wedge SR, Keen NJ, Crafter C, Foster JR, Brady MC, Bigley A, Brown E, et al. (2007). AZD1152, a selective inhibitor of Aurora B kinase, inhibits human tumor xenograft growth by inducing apoptosis. Clin. Cancer Res. 13, 3682–3688. [DOI] [PubMed] [Google Scholar]
- Xu G, Paige JS, and Jaffrey SR (2010). Global analysis of lysine ubiquitination by ubiquitin remnant immunoaffinity profiling. Nat. Biotechnol. 28, 868–873. [DOI] [PMC free article] [PubMed] [Google Scholar]
- Yan J, Shun MC, Hao C, Zhang Y, Qian J, Hrecka K, DeLucia M, Monnie C, Ahn J, and Skowronski J (2018). HIV-1 Vpr reprograms CLR4(DCAF1) E3 ubiquitin ligase to antagonize exonuclease 1-mediated restriction of HIV-1 infection. mBio 9, e01732–18. [DOI] [PMC free article] [PubMed] [Google Scholar]
- Yan J, Shun MC, Zhang Y, Hao C, and Skowronski J (2019). HIV-1 Vpr counteracts HLTF-mediated restriction of HIV-1 infection in T cells. Proc. Natl. Acad. Sci. U S A 116, 9568–9577. [DOI] [PMC free article] [PubMed] [Google Scholar]
- Yurkovetskiy L, Guney MH, Kim K, Goh SL, McCauley S, Dauphin A, Diehl WE, and Luban J (2018). Primate immunodeficiency virus proteins Vpx and Vpr counteract transcriptional repression of proviruses by the HUSH complex. Nat. Microbiol. 3, 1354–1361. [DOI] [PMC free article] [PubMed] [Google Scholar]
- Zenke FT, Krendel M, DerMardirossian C, King CC, Bohl BP, and Bokoch GM (2004). p21-activated kinase 1 phosphorylates and regulates 14–3-3 binding to GEF-H1, a microtubule-localized Rho exchange factor. J. Biol. Chem. 279, 18392–18400. [DOI] [PubMed] [Google Scholar]
- Zhou D, Hayashi T, Jean M, Kong W, Fiches G, Biswas A, Liu S, Yosief HO, Zhang X, Bradner J, et al. (2020). Inhibition of Polo-like kinase 1 (PLK1) facilitates the elimination of HIV-1 viral reservoirs in CD4(+) T cells ex vivo. Sci. Adv. 6, eaba1941. [DOI] [PMC free article] [PubMed] [Google Scholar]
Associated Data
This section collects any data citations, data availability statements, or supplementary materials included in this article.
Supplementary Materials
Data Availability Statement
Mass spectrometry data have been deposited at the ProteomeXchange Consortium via the PRIDE partner repository and are publicly available as of the date of publication. Accession numbers are listed in the key resources table.
This paper does not report original code.
Any additional information required to reanalyze the data reported in this paper is available from the lead contact upon request.
KEY RESOURCES TABLE.
| REAGENT or RESOURCE | SOURCE | IDENTIFIER |
|---|---|---|
| Antibodies | ||
| Ubiquitin Remnant Motif (K-ε-GG) immunoaffinity beads | Cell Signaling | Cat# 5562 |
| Rabbit Anti-GEF-H1 (ARHG2) antibody | Abcam | RRID:AB_2818944 |
| Rabbit IgG, polyclonal (isotype control) antibody | Abcam | RRID:AB_2631996 |
| Mouse Anti-Myc-HRP antibody | Thermo Fisher | Cat# R951-25; RRID:AB_2314045 |
| Rabbit Anti-FLAG antibody | Sigma | Cat# F7425; RRID:AB_439687 |
| Mouse Anti-GAPDH antibody | Sigma | Cat# G8795; RRID:AB_1078991 |
| Mouse Anti-FLAG M2 magnetic beads | Sigma | Cat# M8823; RRID:AB_2637089 |
| Mouse Anti-Strep II | Sigma | Cat# 71590-M; RRID:AB_10807650 |
| Mouse Anti-HIV-1 p24 FITC-conjugated (KC57) antibody | Beckman Coulter | Cat# 6604665; RRID:AB_1575987 |
| Anti-CD3/CD28 magnetic beads | Thermo Fisher | Cat# 11131D |
|
Bacterial and virus strains | ||
| NEB5alpha competent E. coli | NEB | C2987 |
|
Biological samples | ||
| Buffy coats | Blood Centers of the Pacific | N/A |
|
Chemicals, peptides, and recombinant proteins | ||
| Trypsin (sequencing grade) | Promega | V5111 |
| MLN8237 | Selleckchem | S1133 |
| MLN8054 | Selleckchem | S1100 |
| AZD1152-HQPA | Selleckchem | S1147 |
| MLN4924 | Selleckchem | S7109 |
| iRT peptides | Biognosys | iRT Kit |
|
Critical commercial assays | ||
| HIV-1 p24 ELISA | Abcam | Ab218268 |
|
Deposited data | ||
| Mass spectrometry data | Proteomics Identification Database (PRIDE) | PXD032085 |
|
Experimental models: Cell lines | ||
| Jurkat E6-1 | ATCC | TIB-152 |
| 293T | ATCC | CRL-3216 |
| U2OS | ATCC | HTB-96 |
|
Recombinant DNA | ||
| pNL4-3 | NIH AIDS Reagent Program | ARP-114 |
| pNL4-3 IRES-eGFP Nef+ (pBR43IeG-nef+) | NIH AIDS Reagent Program | ARP-11349 |
| pcDNA4-Histone H1.2-3xFLAG | Krogan Lab | N/A |
| pcDNA4-Myc-Ubiquitin | Krogan Lab | N/A |
| pcDNA4-Vpr-Strep | Krogan Lab | N/A |
| pNL4-3 ΔEnv | Krogan Lab | N/A |
| pNL4-3 ΔEnv/ΔVif | Krogan Lab | N/A |
| pNL4-3 ΔEnv/ΔVpr | Krogan Lab | N/A |
| pNL4-3 ΔEnv/ΔVpu | Krogan Lab | N/A |
| pMD2.G (VSV-G) | Addgene (via Didier Trono Lab) | 12259 |
|
| ||
| Software and algorithms | ||
|
| ||
| MaxQuant (version 2.6.8) | MaxQuant.org (Cox and Mann, 2008) | N/A |
| Spectronaut (version 14) | Biognosys (Bruderer et al., 2015) | N/A |
| MSstats (version 4) | Bioconductor (Choi et al., 2014) | N/A |
|
| ||
| Other | ||
|
| ||
| ReproSil-Pur 120 C18 AQ-1.9 packing material | ESI Source Solutions | r119.aq.0001 |
| Ni-NTA Agarose | QIAGEN | 30210 |
| EasySep Human CD4+ T cell isolation kit | Stemcell Technologies | 17952 |
| SepPak tC18 3cc desalting cartridges, 200 mg | Waters | WAT054925 |