

Abstract
In working memory training studies, individual trajectories are known to vary considerably between participants. A better understanding of how individual differences affect training outcomes is important because it might inform the development of more effective training interventions. This study explored how measures of working memory, intelligence, sustained attention, training motivation, mindset, psychological well-being, perceived stress, and sleep quality affect initial training performance and rate of change. A total of 217 upper secondary students completed 12 weeks of adaptive dual-n-back in a classroom setting. We analyzed their self-reported training data using latent growth curve modeling. We found that working memory and intelligence predicted both, initial training performance and rate of performance change. Sustained attention and sleep quality predicted initial performance, but not the rate of change. Furthermore, we observed that participants who completed the intervention scored significantly higher on measures of working memory and intelligence and reported lower levels of perceived stress and higher levels of sleep quality at baseline compared to dropouts. In general, our study supports the magnification account with higher ability individuals starting out at a higher performance level and showing a higher rate of performance change, and moreover, being more likely to adhere to the training protocol.
Keywords: Working memory training, Cognitive training, Working memory, Individual differences, Intelligence, Latent growth curve modeling, Magnification account
Introduction
Working memory is a limited capacity system involved in simultaneously storing and processing information (Baddeley 1992). Studies have shown that working memory is involved in reading and listening comprehension and arithmetic skills, and it is a predictor of scholastic success (Alloway and Alloway 2010; Engle 2002). Individuals with higher working memory capacity have also been found to be better at multitasking (Bühner et al. 2006) and effortful regulation of emotion (Schmeichel et al. 2008). In general, working memory capacity is a limiting factor for a variety of central higher-order cognitive abilities. Consequently, being able to increase working memory capacity or improve the related processes or skills might benefit a whole range of cognitive activities.
For the past two decades, working memory training has been subject to vigorous research (Redick 2019). A common task used in working memory training is the n-back task. In n-back tasks, the participant is presented with a series of stimuli and must decide if the current item presented matches the item presented n stimuli ago (Jaeggi et al. 2010). Dual-n-back is a variation of the classic n-back task, where the dual signifies the fact that the participant has to process two kinds of information simultaneously instead of just one, usually both visuospatial and auditory-verbal material (Jaeggi et al. 2008). In recent years, numerous studies using variants of the n-back task as an intervention have been conducted (Pergher et al. 2019). Generally, there is agreement that participants improve on the trained task and tasks similar to the trained task. But there is limited evidence that those benefits reliably generalize to tasks or domains that are different from training (i.e., far transfer), and the effects found in meta-analyses are generally small, which further illustrates the inconsistency of the findings (Karbach and Verhaeghen 2014; Melby-Lervåg and Hulme 2013; Melby-Lervåg et al. 2016, Soveri et al. 2017, Au et al. 2015; Weicker et al. 2016; Schwaighofer et al. 2015).
Training-specific design factors have sometimes been discussed as reasons for the discrepancies, such as type, intensity, and duration of the training (Könen and Karbach 2015; Pergher et al. 2019). Another fruitful approach to advance the field is to consider individual differences in response to training (Könen and Karbach 2015; Jaeggi et al. 2014; Studer-Luethi et al. 2012). Individuals participating in the same training might have very different training outcomes, and in order to create effective training programs, it is critical to get a better understanding of why some individuals excel while others lag behind.
It has been argued that individual differences in pre-existing cognitive abilities (i.e., working memory, general intelligence (g) and attention) can predict the outcome of working memory training interventions (Lövdén et al. 2012; Katz et al. 2016; Jaeggi et al. 2014). Beyond those cognitive domains, other factors like differences in perceived stress, psychological well-being, sleep quality, and certain personality characteristics like mindset, or also demographic variables like socioeconomic status or age might also play a role in training outcomes (Katz et al. 2016; Könen and Karbach 2015; Matysiak et al. 2019; Rhodes and Katz 2017; Segretin et al. 2014; Studer-Luethi et al. 2012; Studer-Luethi et al. 2016). This paper aims to contribute to the existing knowledge on the potential role of individual differences in working memory training outcome.
Magnification or Compensation
There are two opposing theories of how individual differences in cognitive ability might affect training outcomes. According to the magnification theory, individuals with more task-relevant cognitive resources will respond better to training interventions than individuals with less cognitive resources (Kliegl and Lindenberger 1993; Lövdén et al. 2012). First of all, individuals with more cognitive resources will demonstrate a higher initial training performance, because they are more adept at the requirements of the working memory training such as storing and processing information. Secondly, individuals with higher cognitive ability might engage in more effortful strategies, which ultimately lead to higher gains in performance because they acquire more effective strategies to deal with training demands. If magnification is the ruling principle of working memory training, two predictions would follow: (1) Both cognitive abilities and initial training performance should correlate positively with training gains, (2) individual differences should be even more pronounced after training because individuals with higher task-relevant cognitive resources have larger training gains compared to individuals with less task-relevant resources (Lövdén et al. 2012). In contrast, the compensation theory argues that individuals with more task-relevant cognitive abilities are already functioning at a high level, and therefore, the training will not increase their abilities further. However, individuals with lower abilities have room to improve and consequentially benefit from training (Lövdén et al. 2012). The predictions that are in line with the compensation account are (1) Cognitive abilities and initial training performance should negatively correlate with training gains, (2) individual differences should be minimized after the training intervention (Lövdén et al. 2012). An illustration of hypothetical training trajectories as a function of the magnification or compensation account is provided in Fig. 1.
Fig. 1.
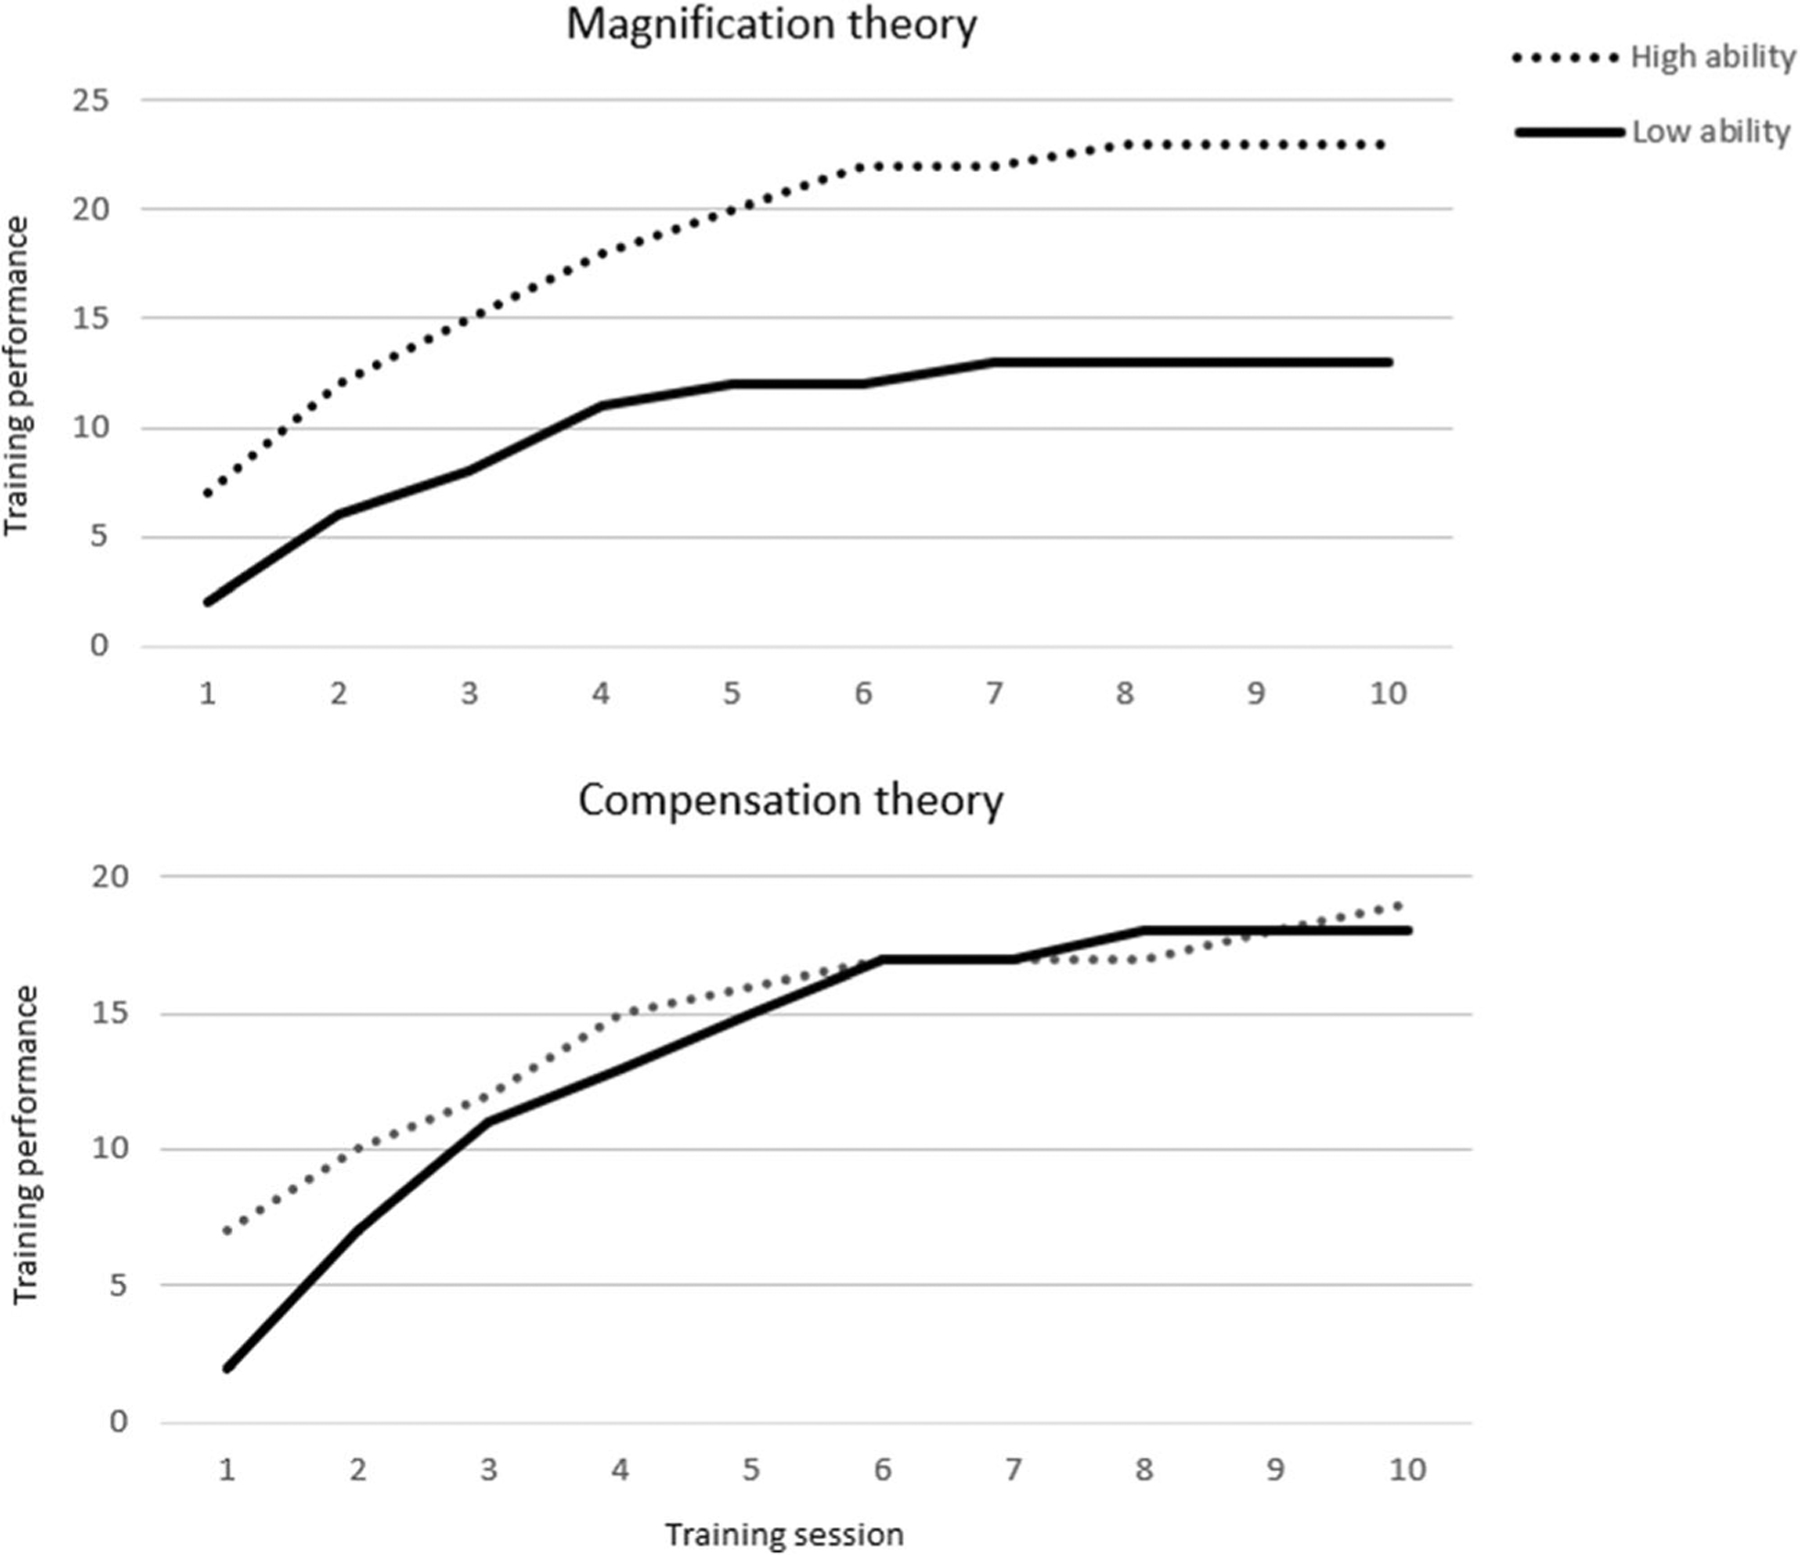
The magnification and compensation theory
Baseline Cognitive Abilities
Magnification versus compensation accounts in the context of cognitive training have been addressed in several recent studies (Borella et al. 2017; Karbach et al. 2017; Guye et al. 2017; Foster et al. 2017; Matysiak et al. 2019; Wiemers et al. 2019). Karbach et al. (2017) studied individual differences and training gains in a mixed population of children, young adults, and older adults. They found that individual differences were reduced after training and that baseline cognitive abilities were negatively correlated with training gains, and thus, their results were consistent with the compensation account. Borella et al. (2017) studied an older adult population and found that the results of measures requiring more active information processing supported a magnification effect, whereas the results of tests requiring a more passive strategy were more in line with a compensational effect. Thus, their results suggest that magnification and compensation are not mutually exclusive, but rather, they might be driven by cognitive domains or processes. In contrast, the studies by Guye et al. (2017), Wiemers et al. (2019), Foster et al. (2017), and Matysiak et al. (2019) all align with the magnification account. Guye et al. (2017) found that the performance at the first training session did predict overall training improvement across all training sessions, which is consistent with the magnification account. Wiemers et al. (2019) combined training data from seven different studies and found that baseline working memory and intelligence predicted training performance, with higher baseline measures leading to larger gains in training improvement. Both Foster et al. (2017) and Matysiak et al. (2019) used pre-test of working memory capacity and found that it predicted training gains: Individuals with higher working memory capacity showed higher gains on the training task compared to individuals with lover working memory capacity.
Given the observations of Borella et al. (2017), different types of interventions might explain the different results found in the literature. The training used by Karbach et al. (2017) targeted predominantly attentional control, whereas the intervention used by the other studies focused more on processing, updating and storing information. Alternatively, the different age groups used across studies might account for some of the discrepancies as well, especially given that age has been found to differentially impact training improvements and transfer following training interventions (Bürki et al. 2014; Dahlin et al. 2008; Borella et al. 2014; Rhodes and Katz 2017). Overall, most studies investigating the relationship between individual cognitive ability, initial training performance and training gain seem to support the magnification account, although there is some emerging evidence for differential effects as a function of cognitive domain or process. But more studies are needed to further clarify this issue.
Here, we focus on other individual difference factors than cognitive abilities that might drive working memory outcomes, in particular, training motivation, implicit theories about intelligence, psychological well-being, perceived stress, and sleep quality. In the following, we will address whether and how these individual differences have been shown to impact performance change during working memory training.
Motivation
A basic distinction made within self-determination theory is between intrinsic motivation - engaging in a task for its own sake, and extrinsic motivation - engaging in a task because of some separable incentive (Ryan and Deci 2000). A comprehensive meta-analysis has shown a positive relationship between intrinsic motivation and performance (Cerasoli et al. 2014). Nonetheless, the interaction between extrinsic and intrinsic motivation and the relationship between intrinsic motivation and performance have been heavily debated (Deci et al. 1999; Cameron and Pierce 1994; Jenkins Jr et al. 1998; Cerasoli et al. 2014).
In the working memory domain, a study by Brose et al. (2012) investigated the role of motivation, negative affect, and attentional control in the daily variability in working memory performance. They found that the self-reported global motivation to work on cognitive tasks on a particular day explained the largest amount of variance in working memory performance, followed by attention and negative affect. The fact that motivation explains daily variability in working memory performance suggests that motivation might also affect training performance over time. However, a recent study by Guye et al. (2017) failed to find a relationship between intrinsic motivation and working memory training performance. In addition, another recent study suggested that external motivation that was manipulated through remuneration did not affect training outcome (Katz et al. 2018). Still, there are some indications that participants who are intrinsically driven to participate in working memory training may benefit more (Jaeggi et al. 2014; Au et al. 2015). Other work has shown that motivational features, e.g., through a game-like environment, seem to boost not only self-reported motivation and engagement levels but also training performance (Mohammed et al. 2017). Given the inconsistent results in the literature, further examination to shed more light on the potential contributions of motivational factors to training outcome is warranted.
Implicit Theories about Intelligence
A few studies have investigated the role of individual differences in implicit theories about intelligence (ITI) in relation to cognitive training. ITI refers to whether participants believe their cognitive ability to be malleable or not. Individuals who perceive their abilities to be malleable are referred to as having a “growth mindset,” whereas individuals believing their cognitive abilities as stable, have a “fixed mindset” (Dweck 2013). ITI has been shown to affect gaol setting, thus individuals with a “growth mindset” tend to pursue learning goals, where they try to master new skills and understand new information and increase their competence (Dweck 1986). In contrast, individuals with a “fixed mindset” tend to pursue performance goals, where they try to get recognized for their competence and avoid negative judgments. Overall, having a “growth mindset” is associated with seeking out challenges that foster learning and being more persistent in the face of difficulties (Dweck 1986). Consequentially, ITI might affect how participants engage with the training in a working memory intervention. Given that the training is typically adaptive, the participants’ cognitive abilities will eventually be challenged by the intervention. ITI might therefore affect participants’ responses to those challenges. Indeed, Jaeggi et al. (2014) found that participants with a “growth mindset” showed more pronounced transfer from dual-n-back training to visuospatial reasoning task than participants with a “fixed mindset,” although this effect was mainly driven by the active control group. Two other studies have investigated the effect of ITI on learning curves and surprisingly; both found a negative association between growth mindset and training performance (Guye et al. 2017; Thompson et al. 2013). The negative association found between growth mindset and training performance is contradictory to the broader literature on how ITI affects goal setting and achievement; however, there are recent studies suggesting that mindset might not affect achievement to the extent as previously thought (Bahník and Vranka 2017; Sisk et al. 2018). Guye and Von Bastian (2017) speculate that individuals with a growth mindset might be too occupied with changing their cognitive performance, leaving little resources to perform the actual training tasks. The relationship between ITI and working memory training performance is somewhat equivocal to date, and clearly, more research is needed to clarify this relationship.
Psychological Well-being and Perceived Stress
The relationship between performance and psychological health has been studied in the broad contexts of work and education. In their review, Ford et al. (2011) found that psychological well-being, depression, general anxiety, and life satisfaction were related to work performance with correlations being moderate to strong. Reviewing the effect of psychological health on performance in an educational context, Bücker et al. 2018) found a small to medium correlation between subjective psychological well-being, depression, general anxiety, subjective well-being and academic achievement. Within the cognitive domain, psychological health issues, such as depression, are associated with impairments in memory, executive function, and processing speed (McDermott and Ebmeier 2009). Relatedly, high levels of or prolonged stress have been shown to be associated with deficits in attention and memory (Sandström et al. 2005; Tsai et al. 2019; Tsai et al. 2020). Given this observed relationship between psychological health and performance, it seems likely that this relationship would also apply to the working memory training domain. For example, psychological health might directly affect performance during working memory training. Specifically, impaired cognitive functioning due to depression or chronic stress might have a negative effect on performance during working memory training.
Sleep Quality and Sleep Deprivation
Poor sleep quality or sleep deprivation can affect our general cognitive ability (Lo et al. 2015; Lo et al. 2012). This is illustrated in a study by Santisteban et al. (2019) where participants, who eliminated 1, of sleep relative to their baseline habitual sleep for six nights, performed significantly lower in a test of working memory when compared to a control group that was not sleep deprived. Such findings are commonly explained by the fact that sleep supports consolidation of declarative and procedural memory for perceptual and motor memories (Stickgold 2005). In line with this interpretation, studies by Kuriyama et al. (2008) and Zinke et al. (2018) showed a gain in training-induced working memory performance when the training sessions were separated by an overnight sleep as compared to wakefulness. Similarly, Lau et al. (2015) showed that a daytime nap between two training sessions improved working memory performance. In contrast, a recent study by Jaeggi et al. (2019) failed to observe differential effects on training performance as a function of training sessions that were either separated by overnight sleep vs. sessions that were held on the same day, and thus, the literature on the optimal spacing of training sessions is still inconsistent. Alternatively, poor sleep quality rather than the actual sleep schedule or number of sleep hours could lead to compromised working memory (Xie et al. 2019; K2020) failed to obsePoor sleep quality might also affect the ability to consolidate declarative and procedural memory, and thus, sleep quality might be correlated with the trajectory of working memory training performance. However, the effect of self-reported sleep quality on training performance has, to our knowledge, not been investigated.
The Present Study
The aim of this paper is to explore how individual differences might predict specific training gains during a working memory intervention. The present study relies on a subset of data collected in a cluster randomized controlled trial involving a large sample of healthy young adults. The focus of the trial was to investigate the effect of a multifaceted brain training intervention and the overall results of the trial are reported elsewhere (and the overall res. The trial used the dual-n-back intervention as an active control condition (total training time < 4 h), which is the focus of the present paper.
In line with previous research, and in particular, consistent with the magnification hypothesis, we predict that participants with higher cognitive abilities (visual and verbal working memory, general intelligence, sustained attention) would have a steeper slope of the training curve and higher initial training performance compared to participants with lower baseline scores on cognitive abilities. Specifically, we expect that initial individual differences in training performance would become more pronounced over the course of the training intervention. Our hypotheses are in line with the magnification account because the training task used here consisted of the dual-n-back task which involves processing and updating information more so than more basic attentional control processes (Borella et al. 2017).
Furthermore, we hypothesize that self-reported sleep quality, psychological well-being, and perceived stress will affect the slope, and possibly, the intercept of the training curve. Specifically, we expect that better sleep quality and psychological well-being will be associated with a steeper slope and an increase in intercept, while the opposite would be expected for perceived stress. We further expect that participants with a “growth mindset” will have a steeper training curve and an increased intercept compared to participants with more of a fixed mindset. Finally, we expect that motivation will explain training performance at each training session above and beyond what is predicted by the slope and intercept of the training curve.
Materials and Methods
Below follows a description of the details concerning the present paper and detailed methods concerning the full trial have been reported elsewhere (etailed methods con.
Participants
A total of 754 students (49% women) mean age 17.78 (SD = 2.52) were assigned to dual-n-back training. The participants were recruited from a total of 17 Danish upper secondary schools, and they consisted of mainly general upper secondary students preparing themselves for higher education, but some students also attended technical colleges. Students not speaking Danish, such as exchange students, were excluded from the study. For this paper, we focused on a sub-sample of students, who completed 9 out of 12 training sessions. This analytical sample consisted of 217 students from 21 classes and 13 schools (cf. Table 1).
Table 1.
Baseline characteristics of the samples
| Analytical sample | Original sample | Difference between samples | |
|---|---|---|---|
| Mean (SD) | Mean (SD) | p value | |
| Number of students (n) | 217 | 754 | |
| Age | 17.55 (1.46) | 17.78 (2.52) | 0.094 |
| Gender f/m | 54/46 | 49/51 | 0.189 |
| Visual working memory | 62.49 (10.86) | 59.89 (11.73) | 0.003* |
| Verbal working memory | 56.66 (16.85) | 53.82 (17.70) | 0.035* |
| Intelligence (OIO) | 16.84 (3.08) | 16.15 (3.26) | 0.005* |
| Sustained attention (go/no-go) | 0.70 (0.19) | 0.67 (0.20) | 0.115 |
| Implicit theories of intelligence (ITI) | 33.53 (6.55) | 33.37 (6.77) | 0.573 |
| Well-being (WHO) | 64.66 (18.25) | 61.95 (18.56) | 0.061 |
| Perceived stress (PSS)† | 13.69 (6.69) | 15.26 (6.96) | 0.003* |
| Sleep Quality (PSQI)† | 5.37 (2.64) | 6.01 (3.01) | 0.003* |
Significant at 0.05 level.
Higher scores refer to higher levels of perceived stress and poorer sleep quality
Procedure
Participants were given assessments and questionnaires in the first week of the project period, after which they underwent the working memory intervention, followed by a post-test and an intermediate test halfway through the intervention period. The study was conducted in a school setting, and it was carried implemented using an opt-out procedure. At each assessment, the participant had to actively consent to participate after receiving written information about the study. The participants could withdraw their consent at any time and have their data deleted. The working memory training consisted of 20 min of dual-n-back training completed once a week for 12 weeks. At the first training session, the training software was installed on the students’ laptops, and the students familiarized themselves with the dual-n-back task. The first training session was restricted to n-back levels 1 and 2. The data from this first training session were excluded because of its introductory nature. From the second training session and onwards, the program ran in an adaptive mode increasing the level of difficulty as the participants improved. The students self-reported their training performance and training motivation online after completing each training session. Training sessions with less than 5 min of dual-n-back training were not considered proper training sessions and were removed from the dataset (22% or all sessions). From the remaining sessions, students had to provide training reports on nine out of twelve training sessions (not necessarily consecutive) to be included in the analysis (see Fig. 2). Data collected for the study was handled in accordance with the Danish law on personal data and the study was approved by Danish Data Protection Agency (Journal number 2015-57-0008 and 2015-57-0047).
Fig. 2.
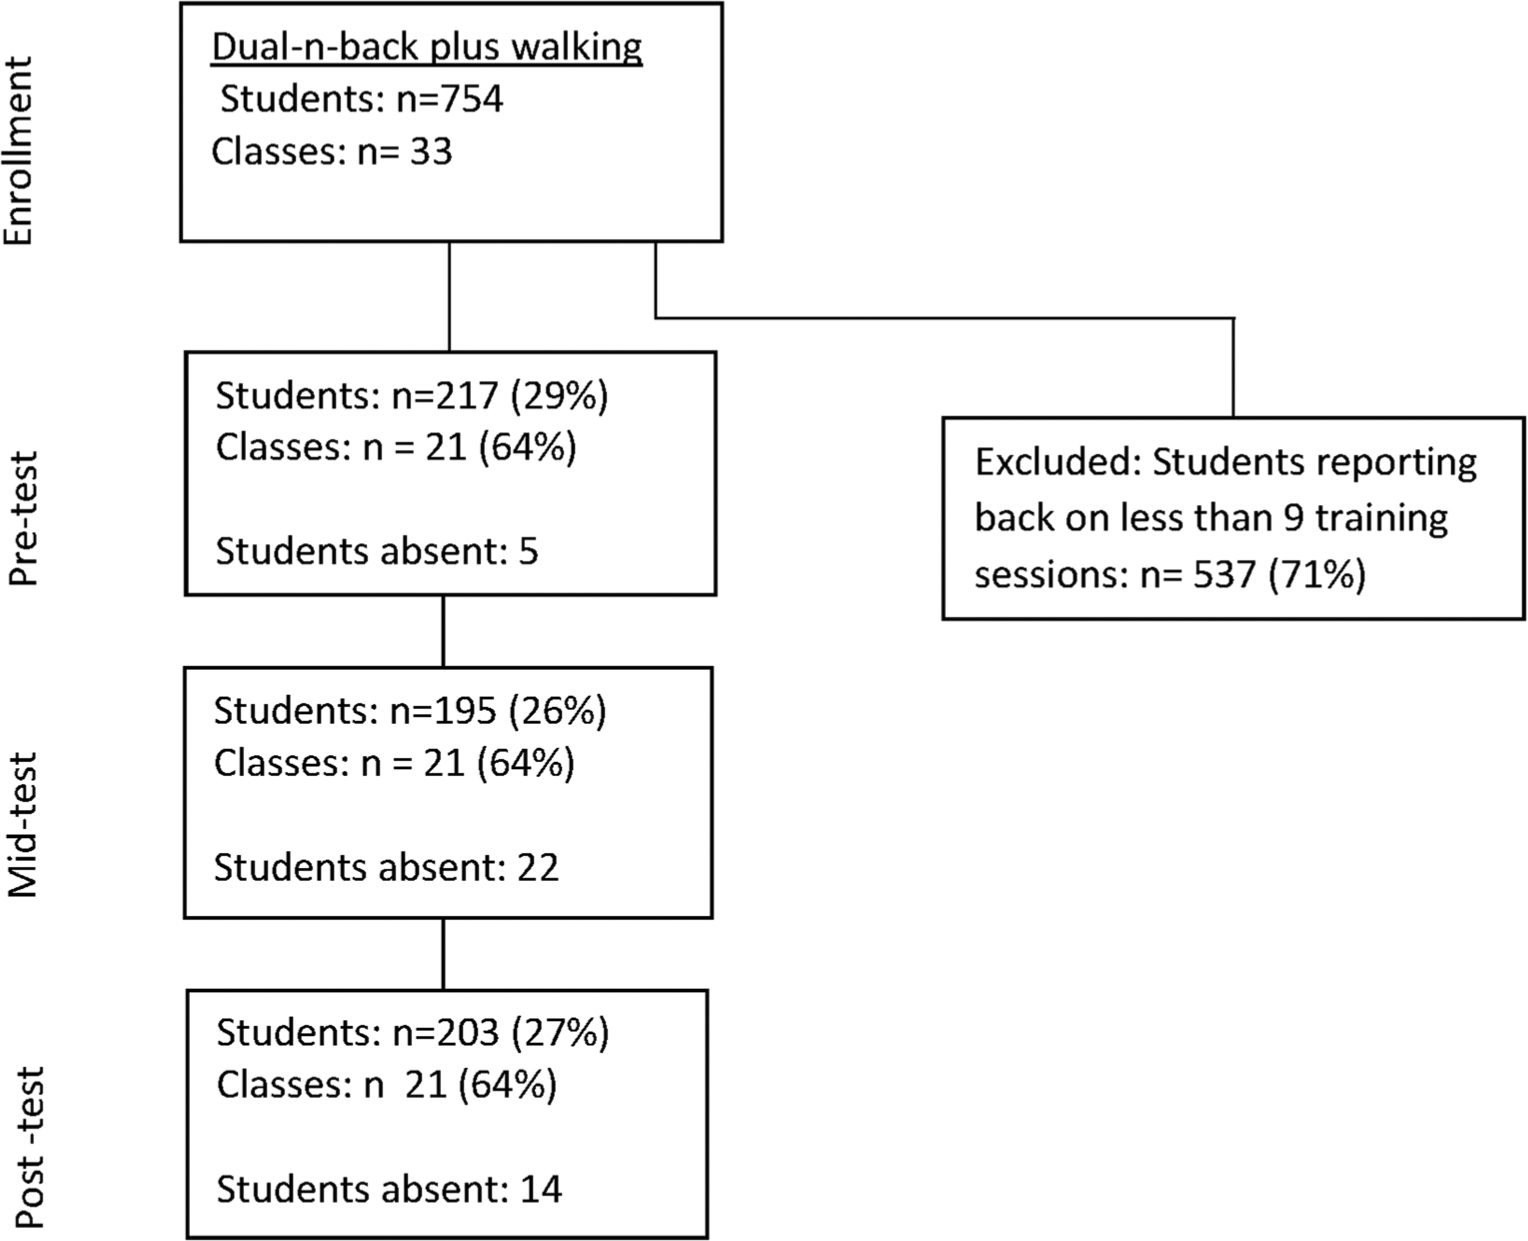
Flow diagram of participants
Training Intervention
The dual-n-back training was administered using the free online program Brain Workshop. The visuospatial information was presented on the computer screen and consisted of blue squares presented one after another on different locations in a grid. The auditory material was presented via headphones and consisted of letter sounds (C, H, K, L, Q, R, S, and T) also presented one after another. The stimuli in both modalities were presented at the same time and had to be processed simultaneously. The participant had to respond whenever the visuospatial or auditory stimuli matched the stimuli one, two, three, or n positions back in the sequence. A stimulus was presented for 500 ms, with an inter stimuli interval of 2500 ms. Target and non-targets were presented pseudo-randomly, and auditory and visuospatial targets could occur simultaneously. The chance of a lure item was 12.5 % (i.e., a 3-back target in 2 back-condition). A block consisted of 20 + n^2 trials, where n refers to the n-back level.
Immediate feedback was presented after the participant’s response indicating if the response was correct (true positive) or wrong (false positive). After each block, the participant was also given a summary on their training performance by receiving a score. The score was calculated using the following equation: score = true positive / (true negative + false positive + false negative) 100%. If the participant had a score of 80% or above, the difficulty level was increased by one for the next block. If the participant got less than half of the answers correct in three blocks (not necessarily consecutive), the level was decreased by one. Each training session lasted approximately 20 min, but the actual time spent on training could be shorter if the participant decided to take small breaks within the allotted time. The average number of blocks completed per training session was 9.53 (SD = 6.73) at training session 2 and 8.88 (SD = 4.94) at training session 12. The decrease in the number of blocks completed per training session can be explained by the number of trials per block that increased along with n-back level, resulting in longer training blocks as the students increased their performance over the course of the intervention.
Participants were asked to self-report their training performance using an online survey, given that the actual training data was not accessible through the software. The participants were asked to enter their ID number and the number of the training session (i.e., what number out of the 12 training sessions). In addition, they were asked to report their n-back level and score after each block of trials. The n-back level was used as the dependent variable capturing training performance. We checked the validity of those self-reported training data by assessing whether the data reported by the participants was consistent with the adaptivity algorithm implemented by the training software. Specifically, if participants reported their training data adequately, the data should be in line with the adaptivity procedure set by Brain Workshop (e.g., the difficulty level should increase by one after a training block with 80% or more responses correct). The reported data was cross-validated using a syntax created in SPSS.
After each training session, the online survey also asked participants to report their training motivation. Training motivation was measured on a 5-point scale of 1–5 (1: very low, 1: low, 3: average, 4: high, 5: very high). Participants were asked: ir training motivation. Training motivation was measured on a g a syntax crea We used the individual score at each training session as a time-variant predictor in the analytical model.
Assessments
All the assessments were carried on using online administered surveys and tests. Surveys and tests along with their individual items were presented in a fixed order. The online survey solution was delivered by the Danish company Epinion (https://epinionglobal.com/en/). Assessments were carried out in the classroom (i.e., in a group setting) supervised by a teacher.
Visual Working Memory
The matrix span was adapted from Vartanian et al. (2016). Participants were presented with a four by four matrix. The stimuli consisted of red squares presented one after another on different locations in the matrix. The squares were presented for 1 s with a 1-s interstimulus interval. For each trial, three, six, or nine squares were presented in a sequence. The presentation was blocked according to sequence length with five trials in each block (3-3-3-3-3→6-6-6-6-6 →9-9-9-9-9). At the end of each trial, participants were asked to recall the locations of the red squares in the order in which they were presented. The dependent variable was total number of correct answers with scores ranging between 0 and 90. Based on data from the full trial (Ørskov et al. 2020) we found that the matrix span had moderate test-retest reliability with an Interclass correlation coefficient (ICC) of 0.541 and good internal consistency with a Cronbach’s alpha of 0.95.
Verbal Working Memory
The verbal working memory measure was also adapted from Vartanian et al. (2016). Four-letter high-frequency Danish nouns were presented one at a time on the screen. Each word was presented for 1 s with a 1-s interstimulus interval. The words were presented in three blocks of five trials. In the first block, three words were presented per trial. For the second and third blocks respectively, six and nine words were presented per trial. After each trial, participants were prompted to recall the words presented to them in their corresponding order. The participants typed in the words they could remember in an open-ended format. Correct answers were scored when a recalled word was in the right serial position, making the total score used as a dependent variable range between 0 and 90. This way of scoring is based on the same idea as “proportion correct scoring” and is suitable for the relatively high number of words used in this test (Unsworth and Engle 2007). Based on data from the full trial (Ørskov et al. 2020) we found that the measure of verbal working memory had moderate test-retest reliability with an ICC of 0.454 and a good internal consistency with a Cronbach’s alpha of 0.92.
Intelligence
We used the subtest Odd Item Out (OIO) from Reynold’s Intellectual Screening Test (RIST) as a proxy for participants’ general intelligence Reynolds (2011). For every item in the OIO, the participant was presented with 5 to 7 pictures and was asked to select the one picture that did not fit with the others. The original sub-test correlates strongly with the sub-test Vocabulary (0.64) and Matrix Reasoning (0.62) from WAIS III indicating reasonable convergent validity Reynolds (2011). RIST has a stability coefficient of r = 0.84, an internal consistency of α=0.95 and a standard error of measurement (SEM) of 3.35, which is sufficient for screening purposes Reynolds (2011). We modified the procedure administering the test online making the progression self-paced with an overall time limit of 10 minutes to complete the 29 items. Of the students, 86% were able to complete all items, and all students completed three quarters of the items (Ørskov and Beatty 2018). For each correct answer one point was given, and the dependent variable consisted of the total score ranging from 0 to 29.
Sustained Attention
A go/no-go task adapted from Metcalfe and colleagues was used to test sustained attention (Metcalfe et al. 2016). Participants were presented with the digits 1–9 in pseudorandom order. Each number was displayed for 250 ms followed by 1000 ms of fixation. “Go”-trials consisted of all numbers except 3. On “go”-trials, the participants were asked to respond as fast as possible by pressing “space.” On the “no-go”-trials, participants were presented with the number 3 and were instructed to not respond. Only 15% of trials were “no-go”-trials. The test consisted of 6 blocks of 30 numbers each. The percentage of correct answers (i.e., no response) on the “no-go”-trial was used as a dependent variable. Based on data from the full trial (Ørskov et al. 2020) we found that the go/no-go had had moderate test-retest reliability with an ICC of 0.57 and good internal consistency with a Cronbach’s alpha of 0.82.
Pittsburgh Sleep Quality Index
The Pittsburgh Sleep Quality Index (PSQI) is a self-rated questionnaire that measures sleep quality and disturbances (Buysse et al. 1989). The participants report on their sleep for the past month. PSQI is a psychometrically validated 19-item instrument. The 19 items form 7 component scores each ranging from 0 to 3. A score of 0 indicates no sleeping problems, and a score of 3 indicates severe sleeping problems. The global sleep quality score is the sum of the component scores and ranges from 0 to 21. For this study, the global sleep quality score was used as outcome ranging from 0 to 21. The Danish version of the PSQI shows moderate test-retest reliability with an ICC of 0.68 and adequate internal consistency with a Cronbach’s alpha of 0.72 (Ørskov 2020).
Implicit Theories about Intelligence
Dweckls questionnaire (Dweck 2013) on implicit beliefs about intelligence was used to assess how much the participants believed that their efforts could change their intelligence. On a 6-point scale, they indicate whether they agree or disagree to statements like: “You can learn new things, but you can’t really change your basic intelligence.” There was a total of eight statements and the sum score served as the dependent variable. Scores ranged between 8 and 48 (with some items reverse coded for scoring). Internal reliability for the ITI has high internal consistency with a Cronbach’s alpha of 0.85, and test-retest reliability for ITI was reported as r=0.80 Dweck et al. (1995).
Psychological Well-being
The 5-item World Health Organization Well-being Index (WHO-5) was used to assess general psychological well-being (Topp et al. 2015). The questionnaire has been applied across a range of study fields (Topp et al. 2015) and has demonstrated high internal consistency with a Cronbach’s alpha of 0.85–0.95 (Guðmundsdóttir et al. 2014; Heun et al. 1999) and adequate test-retest reliability with an ICC of 0.81 and standard error of measurement (SEM) 8.51 (Schougaard et al. 2018). Each item is scored on a 6-point Likert scale (0: at no time, 1: some of the time, 2: less than half of the time, 3: more than half of the time, 4: most of the time, 5: all of the time), and possible raw scores range between 0 and 25. Standard scoring requires the calculation of a percentage score by multiplying the raw score by four. The dependent variable is the standard score ranging from 0 to 100.
Perceived Stress
Self-reported stress was assessed with the Perceived Stress Scale 10-item version (Cohen et al. 1983). The questionnaire aims to assess the degree to which individuals find their lives to be unpredictable, uncontrollable, and overloaded (Cohen et al. 1983). Each of the 10 items is answered on a 5-point Likert scale ranging from 0 to 4 (0: never, 1: almost never, 2: sometimes, 3: fairly often, 4: very often). The total sum score was used as the dependent variable and ranges between 0 and 40. The Danish version has shown an acceptable reliability and internal consistency with an SEM of 1.8 and Cronbach’s alpha of 0.85 (Eskildsen et al. 2015).
Statistical Analysis
Latent growth curve modeling (LGCM) using SPSS AMOS 24 was applied in order to explore whether and how individual differences in ability and other person-centered characteristics might predict the intercept and slope in modeling the average n-back level across training sessions.
We compared three models to determine the best fitting baseline model to fit the training data: a linear model assuming a linear change in cognitive performance (model 1), a quadratic model assuming a quadratic change in cognitive performance over time (model 2), and a piecewise linear model assuming a change in slope over time (model 3). The quadratic model is a typical comparison model in the LGCM literature, and we included this model for the sake of completeness. Model fit was evaluated by using the chi-square statistic, the Root Mean Square Error of Approximation (RMSEA), and Comparative Fit Index (CFI) (Park and Schutz 2005).
For measures of working memory, intelligence, sustained attention, and implicit theories about intelligence, data from the pre-test was used for the analysis and added in the model as a time-invariant covariant. For psychological well-being and sleep quality, an average from pre-, mid-, and post-test was used for analysis and was also added as a time-invariant covariant. For motivation, data was available from each training session; thus, motivation was entered as a time-variant covariant.
To avoid issues with multicollinearity, we ran separate models for each predictor: (1) visual working memory, (2) verbal working memory, (3) intelligence, (4) sustained attention, (5) motivation, (6) sleep quality, (7) implicit theories about intelligence, (8) psychological well-being, and (9) perceived stress. Univariate correlations between the different variables are reported in the supplemental material (ESM 1). Our approach to account for multicollinearity has been adopted from other researches in the field (Guye et al. 2017).
Given that all measures used in the study are assumed to be correlated, correcting for family-wise error rate is not straight-forward (Bender and Lange 2001). Given the exploratory nature of the study, we decided to not correct for multiple testing with respect to the individual predictors. However, whenever the same predictor was used several times, we applied the Bonferroni correction to correct for multiple comparisons. We adopted a standard significance level of 0.05.
Results
Baseline Characteristics
The baseline characteristics of the analytical sample used in this paper are presented in Table 1. The table also shows the characteristics of all the students participating in the study. The analytical sample differs significantly from the original sample in several ways. Specifically, the students in the analytical sample (i.e., participants that completed the minimum required number of training sessions) show higher baseline scores on visual and verbal working memory and intelligence, and furthermore, they report better sleep quality and lower stress levels.
The original sample consisted of all the students enrolled in the dual-n-back group. In this paper, we focus on a sub-sample that met specific completion criteria (cf. text for details). The two samples are compared using t-tests and chi-square tests; p values are displayed in the right column.
Baseline Model
Three different baseline models were fitted, and the following indices for best fit were compared: (1) linear, (2) quadratic, and (3) piecewise linear. The linear model applied includes an intercept and a slope. The factor loadings for the slope were 0, 1, 2, 3, 4, 5, 6, 7, 8, 9, and 10, each factor loading corresponding to a weekly training session. The quadratic model had quadratic factor loadings (i.e., 0, 1, 4, 9, 16, 25, 36, 49, 64, 81, and 100) in addition to separate factor loadings for intercept and the linear slope. The piecewise linear model consists of three lines meeting in two knots each line with separate slopes. The placing of the knots was based on visualization of the data, and by comparing different models with knots placed at different timepoints (Flora 2008). The factor loadings for the first line were 0, 1, 2, 3, 4, 4, 4, 4, 4, 4, and, 4, and the factor loadings of the second line were 0, 0, 0, 0, 0, 1, 2, 3, 3, 3, and 3. Finally, the last line had the factor loadings 0, 0, 0, 0, 0, 0, 0, 0, 1, 2, and 3. The placing of the knots was based on visualization of the overall data. A plot for the average training curve is presented in Fig. 3. According to Hu and Bentler (1999), a cut-off value close to 0.95 for the CFI and a cutoff close to 0.06 for RMSEA indicate an acceptable fit, and the fit indices suggest that the training data are best described by the piecewise linear model (see Table 2).
Fig. 3.

Simple line plot of the mean n-back level across training sessions. The first training session was excluded from the analysis (cf. text for details). The knots of the piecewise model were placed at training sessions 6 and 9. Error bars represent 95% CI
Table 2.
Fit indices for the three baseline models fitted to the data
| χ2/df | CFI | RMSEA | |
|---|---|---|---|
| Linear | 213,932/61 | 0.927 | 0.108 |
| Quadratic | 131,582/57 | 0.965 | 0.078 |
| Piecewise linear | 99.09/52 | 0.978 | 0.065 |
CFI, comparative fit index; RMSEA, root mean square error of approximation
The parameters of the piecewise linear model are presented in Table 3. The model indicates that the participants had an initial average n-back level of 2.107, S.E. = 0.030, p < 0.001. The first piece of the linear model had a positive slope of 0.108, S.E. = 0.009, p < 0.001. This indicates an increase in mean n-back level during the first five training sessions from 2.107 to 2.539. The second line spans training sessions 5–8. Here the slope is also positive, but smaller 0.024, S.E. = 0.009, p < 0.001. This indicates a continued increase in n-back level, but at a slower rate. The third and final line also had a positive slope 0.030, S.E. 0.011, p=0.005. The model indicated that the final n-back level was 2.701. The model suggests that there was no association between intercept and the slopes of the model; that is, there was no relationship between initial performance on the dual-n-back and rate of improvement. There were significant individual differences in the variance of the intercept and the slopes: intercept: 0.143, S.E.=0.020, p < 0.001, slope 1: 0.008, S.E.=0.002, p < 0.001, slope 2: 0.006, S.E.=0.02, p = 0.001, slope 3: 0.012, S.E. = 0.03, p < 0.001).
Table 3.
Parameters of the best fitting baseline model (model 3: piecewise)
| Mean | S.E. | p value | |
|---|---|---|---|
| Intercept | 2.107 | 0.030 | <0.001* |
| Slope 1 (training session: 1–5) | 0.108 | 0.009 | <0.001* |
| Slope 2 (training sessions: 5–8) | 0.024 | 0.009 | <0.001* |
| Slope 3 (training sessions: 8–11) | 0.030 | 0.011 | 0.005* |
A significant p value indicates that the parameters are significantly different from null.
Significant at 0.05 level
Individual Differences Affecting Intercept and Slope
Next, the different predictors were included in the piecewise linear model. This model examined whether the predictors explain the between-person variation in the intercept and slopes in the model. The following predictors were examined individually: visual working memory, verbal working memory, intelligence, sustained attention, implicit theories about intelligence, sleep quality, and perceived stress. Results are presented in Tables 4 and 5.
Table 4.
Association between predictors and initial training performance (intercept)
| Predictors | Unstandardized estimate | S.E. | Standardized estimate | R 2 | p value |
|---|---|---|---|---|---|
| Visual working memory | 0.015 | 0.003 | 0.433 | 0.188 | <0.001* |
| Verbal working memory | 0.007 | 0.002 | 0.294 | 0.087 | <0.001* |
| Intelligence (OIO) | 0.036 | 0.01 | 0.295 | 0.087 | <0.001* |
| Sustained attention (go/no-go) | 0.214 | 0.046 | 0.010* | ||
| Implicit theories of intelligence (ITI) | −0.007 | 0.005 | −0.120 | 0.014 | 0.147 |
| Well-being (WHO-5) | 0.002 | 0.002 | 0.078 | 0.006 | 0.340 |
| Perceived stress (PSS) | −0.005 | 0.005 | −0.082 | 0.007 | 0.315 |
| Sleep Quality (PSQI) | −0.019 | 0.008 | −0.186 | 0.034 | 0.022* |
Significant at 0.05 level
Table 5.
Association between predictors and rate of change in training performance (slope)
| Predictors | Unstandardized estimate | S.E. | Standardized estimate | R 2 | p value | Bonferroni-corrected p value | |
|---|---|---|---|---|---|---|---|
| Visual working memory | Piece 1 | 0.000 | 0.001 | 0.011 | 0.000 | 0.909 | 1.000 |
| Piece 2 | 0.002 | 0.001 | 0.311 | 0.097 | 0.007* | 0.021* | |
| Piece 3 | 0.000 | 0.001 | 0.025 | 0.001 | 0.791 | 1.000 | |
| Verbal working memory | Piece 1 | 0.002 | 0.001 | 0.342 | 0.117 | <0.001* | <0.003* |
| Piece 2 | 0.001 | 0.001 | 0.114 | 0.013 | 0.325 | 0.975 | |
| Piece 3 | 0.000 | 0.001 | 0.045 | 0.002 | 0.638 | 1.000 | |
| Intelligence (OIO) | Piece 1 | 0.005 | 0.003 | 0.168 | 0.091 | 0.093 | 0.279 |
| Piece 2 | 0.007 | 0.003 | 0.301 | 0.028 | 0.008* | 0.024* | |
| Piece 3 | 0.002 | 0.003 | 0.065 | 0.004 | 0.502 | 1.000 | |
| Sustained attention (go/no-go) | Piece 1 | 0.043 | 0.049 | 0.091 | 0.008 | 0.372 | 1.000 |
| Piece 2 | −0.006 | 0.046 | −0.015 | 0.000 | 0.900 | 1.000 | |
| Piece 3 | 0.022 | 0.057 | 0.037 | 0.001 | 0.702 | 1.000 | |
| Implicit theories of intelligence (ITI) | Piece 1 | 0.002 | 0.001 | 0.126 | 0.016 | 0.210 | 0.630 |
| Piece 2 | 0.001 | 0.001 | 0.067 | 0.005 | 0.564 | 1.000 | |
| Piece 3 | 0.000 | 0.002 | −0.007 | 0.000 | 0.940 | 1.000 | |
| Well-being (WHO-5) | Piece 1 | 0.001 | 0.001 | 0.097 | 0.009 | 0.340 | 1.000 |
| Piece 2 | 0.000 | 0.001 | −0.042 | 0.002 | 0.714 | 1.000 | |
| Piece 3 | 0.001 | 0.001 | 0.093 | 0.009 | 0.326 | 0.978 | |
| Perceived stress (PSS) | Piece 1 | −0.002 | 0.002 | −0.133 | 0.018 | 0.175 | 0.525 |
| Piece 2 | 0.001 | 0.001 | 0.057 | 0.003 | 0.494 | 1.000 | |
| Piece 3 | −0.001 | 0.002 | −0.074 | 0.005 | 0.435 | 1.000 | |
| Sleep quality (PSQI) | Piece 1 | −0.003 | 0.002 | −0.110 | 0.012 | 0.266 | 0.798 |
| Piece 2 | 0.000 | 0.002 | 0.000 | 0.000 | 0.998 | 1.000 | |
| Piece 3 | 0.000 | 0.003 | −0.009 | 0.000 | 0.925 | 1.000 |
Pieces 1, 2, and 3 refer to the three linear pieces included in the piecewise linear model.
Significant at 0.05 level
Visual working memory, verbal working memory, intelligence, sustained attention, and sleep quality all significantly predicted initial training performance. Cognitive ability significantly predicted initial training performance with standardized estimates ranging between 0.214 and 0.443 (cf. Table 3), indicating that higher cognitive ability was associated with higher initial training performance. Poorer sleep quality (a higher score on PSQI) was associated with a lower initial training performance (standardized estimate = −0.186). Neither implicit beliefs theories of intelligence nor well-being or perceived stress was associated with initial training performance.
The piecewise linear model consisted of three linear pieces, each with an individual slope. Verbal working memory predicted the slope of the first linear piece (piece 1; standardized estimate = 0.342, p<0.001). Visual working memory and intelligence significantly predicted the second linear piece (piece 2; standardized estimate of 0.311, p=0.007, and 0.301, p=0.008, respectively). None of the predictors predicted the slope of the third and final piece of the model (piece 3). Bonferroni-corrected p values are provided in Table 5. Figure 4 illustrates training performance over time for individuals scoring respectively above and below the median on visual working memory, verbal working memory, and intelligence.
Fig. 4. Training performance over time and baseline cognitive ability.
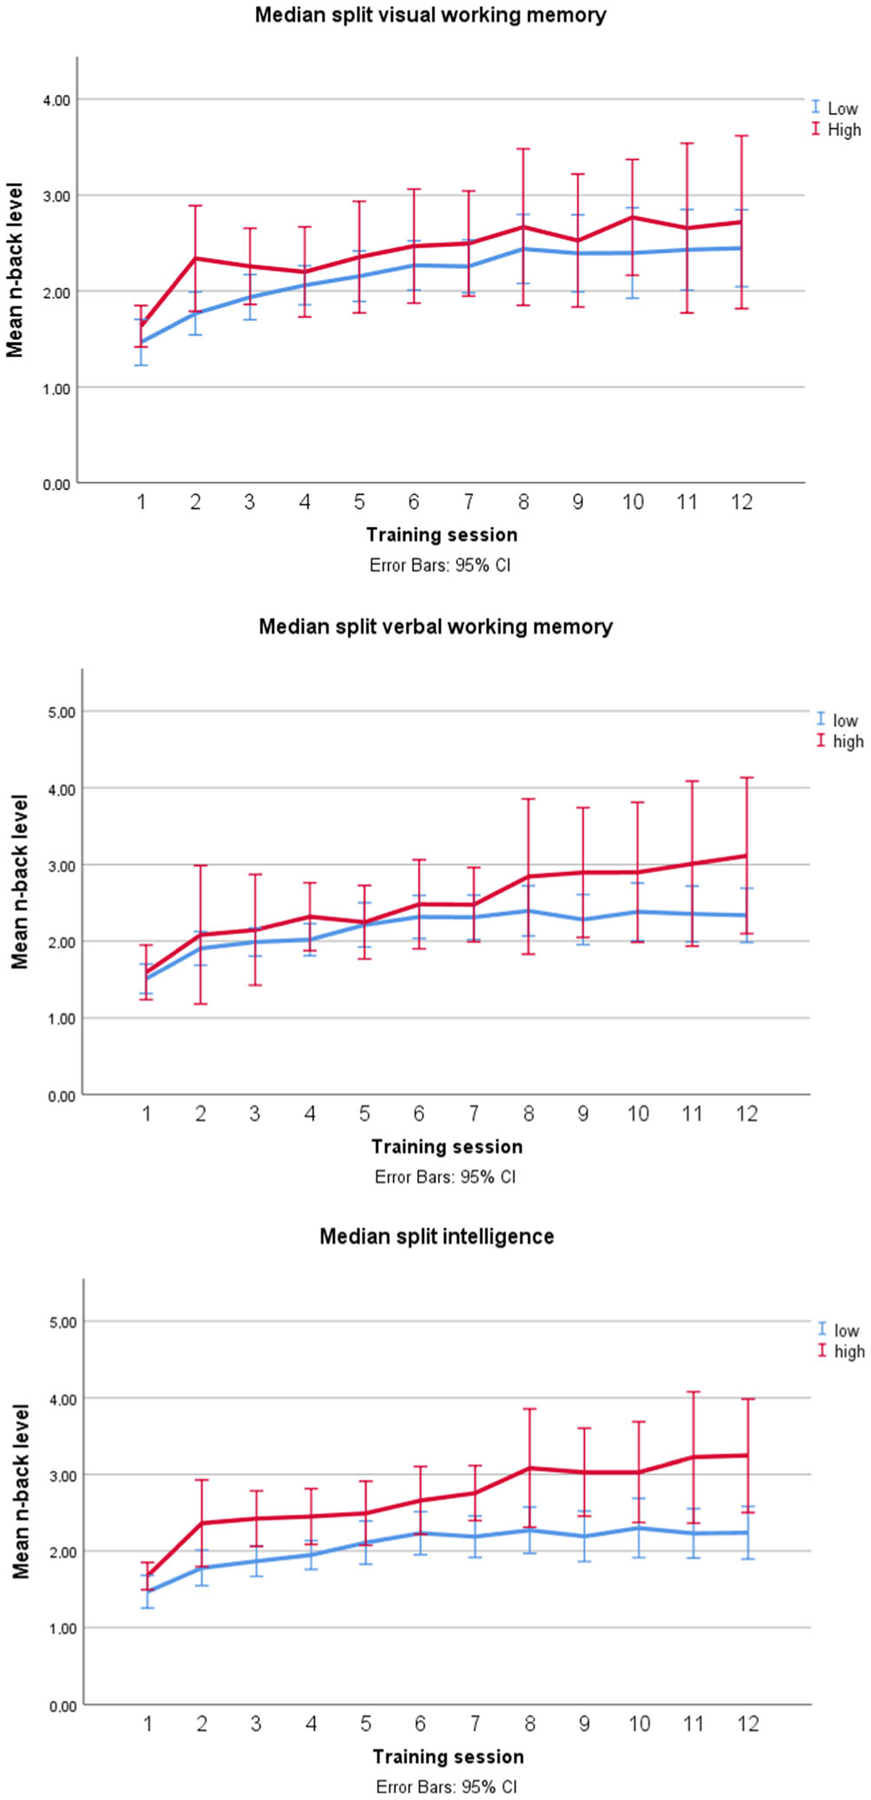
Line chart showing the median splits for training performance based on visual working memory (top), verbal working memory (middle), and intelligence (bottom)
Motivation was examined as a time-variant predictor. So, instead of asking how the average motivation predicted the slope and intercept of the baseline model, we asked how motivation affected the training performance at each individual training session. This allowed us to examine how motivation and its relationship with training performance might change over time. Figure 5 shows the distribution of self-reported motivation indices at training sessions 2, 6, and 12, respectively, illustrating that overall, motivation decreased over time. The association between motivation and training performance is presented in Table 6. The model suggests that motivation significantly predicted training performance at training sessions 4, 5, 6, and 7. After correcting for multiple comparisons, the association between motivation and training performance remained significant only for training sessions 5 and 6.
Fig. 5.

Training motivation across training sessions. Simple histograms illustrating the self-reported training motivation scores. a 2nd training session, b 6th training session, c 12th training session. The scores are (1) very low, (2) low, (3) average, (4) high, and (5) very high
Table 6.
Association between motivation and training performance across sessions
| Training session | Unstandardized Estimate | S.E. | Standardized estimate | p value | Bonferroni-corrected p value |
|---|---|---|---|---|---|
| 2† | 0.001 | 0.029 | 0.002 | 0.969 | 1.000 |
| 3 | 0.032 | 0.021 | 0.065 | 0.124 | 1.000 |
| 4 | 0.042 | 0.016 | 0.086 | 0.007* | 0.077 |
| 5 | 0.056 | 0.017 | 0.103 | 0.001* | 0.011* |
| 6 | 0.075 | 0.025 | 0.129 | 0.003* | 0.033* |
| 7 | 0.049 | 0.020 | 0.071 | 0.013* | 0.143 |
| 8 | 0.028 | 0.018 | 0.043 | 0.118 | 1.000 |
| 9 | 0.011 | 0.026 | 0.018 | 0.659 | 1.000 |
| 10 | 0.012 | 0.017 | 0.019 | 0.478 | 1.000 |
| 11 | 0.031 | 0.022 | 0.046 | 0.155 | 1.000 |
| 12 | 0.050 | 0.033 | 0.074 | 0.128 | 1.000 |
The first training session was excluded from the analysis (cf. text for details).
Significant at 0.05 level
Discussion
This study aimed to explore specific individual differences factors as predictors for training performance during a dual-n-back training intervention. First, the study investigated whether cognitive ability affected the initial training performance and the rate of change. Consistent with our hypothesis and the previous literature, we found support for a magnification effect: Individuals with higher cognitive ability performed at a higher level initially and improved at a faster rate than individuals with lower cognitive ability. Second, we investigated the potential impact of training motivation, implicit beliefs about intelligence, psychological well-being, perceived stress and sleep quality on initial training performance, and rate of change. Training motivation and sleep quality predicted initial training performance. Furthermore, training motivation predicted training performance midway through the intervention. However, neither mindset nor well-being or perceived stress predicted initial training performance or rate of change.
Cognitive Ability
We fitted three different baseline models to the data and found that a piecewise linear model had the best fit. Implementing a piecewise linear model made it possible to separately investigate the different stages of the intervention and how they might be impacted by cognitive ability and other factors. We found that visual and verbal working memory sustained attention as well as intelligence predicted the initial training performance. Consistent with the magnification account, individuals with higher cognitive ability started out at a higher n-back level than individuals with lower cognitive ability, and furthermore, they increased their performance at a higher rate. Sustained attention only predicted the initial training performance, whereas working memory and intelligence also predicted the rate of change. Verbal working memory affected the early rate of change (sessions 2–6). Visual working memory and intelligence affected the rate of change later in the intervention (sessions 6–9). None of the cognitive ability predictors explained the rate of change towards the end of the intervention (sessions 9–12). The differential effects of working memory and intelligence on learning rates during the intervention might indicate the changing cognitive demands. Specifically, early training gains might be supported by verbal working memory if participants started out adopting verbal rehearsal as a mnemonic strategy. Verbal rehearsal is an ingrained cognitive routine (Gathercole et al. 2019) and is the most frequently adopted strategy in n-back tasks early on (Laine et al. 2018). In contrast, in order to continually increase training performance, new cognitive routines have to be successfully applied, and this process might be dependent on visual working memory and intelligence more so than sustained attention, which might also explain why visual working memory and intelligence predicted the rate of change later in the intervention. The notion that intelligence becomes more important for training performance during the training intervention is supported by previous work (Colom et al. 2013) as well as a recent study by Meiran et al. (2019) who found that the correlation of intelligence and training performance tends to increase over the course of the training intervention.
Studies suggest that training performance is boosted through the use of strategies (Laine et al. 2018; Fellman et al. 2020). Intelligence is likely promoting the acquisition and implementation of effective strategies in general (Ltelligence is2012). Furthermore, visual-spatial strategies have been proven to be effective strategies dealing with n-back tasks, and mastering them is likely dependent on the capacity of visual working memory.
Overall, our results are in accordance with other studies supporting the magnification effect (Foster et al. 2017; Matysiak et al. 2019; Guye et al. 2017; Bürki et al. 2014). Individuals with more task-relevant cognitive resources tended to gain more benefits from the intervention than individuals with less cognitive resources. Our results further suggest that task-relevant cognitive resources might differentially impact learning over the course of the intervention.
Relation between Initial Training Performance and Rate of Change
In contrast to what we expected, we found no significant association between initial training performance and rate of performance change. Such a relationship is predicted by the magnification account (Lövdén et al. 2012) and has been observed in other studies (e.g., Guye et al. 2017). We gave participants a chance to familiarize themselves with the dual-n-back task before the intervention; the fact that this introduction was restricted to the most basic n-back levels might have attenuated any individual differences in initial training performance, resulting in restricted range issues. This might in turn have prevented us from observing the expected association between initial training performance and rate of performance change across the remainder of the intervention.
Motivation
We further investigated whether motivation reported after each training session might explain some of the residual variance in the model over and above what was predicted by the initial training performance (intercept) and rate of performance change (slope). We found that motivation did indeed predict performance at some training sessions, specifically, at training sessions 4, 5, 6, and 7. This suggests that motivation is important for training performance, but it does not seem to be equally important throughout the training intervention. During the first couple of sessions, motivation might not matter that much, as the participants are still getting familiar with the intervention and performance increases without much effort. Around the fourth training, there might be a shift, where participants have to invest more effort in order to increase their performance. They have to stay focused to advance or even maintain their n-back level, and they might have to acquire and implement new strategies to keep progressing. From this perspective, it makes sense that motivation explains more variance in performance starting from the fourth training session. Towards the end of intervention, motivation seems to matter less and ceases to explain the variance in performance, maybe because performance reaches a plateau towards the end of the intervention, and even highly motivated individuals might not be able to go beyond this plateau.
As such, our results concur with the general literature on motivation and performance, showing an overall positive relationship between intrinsic motivation and performance. They are inconsistent with the data by Guye et al. (2017) showing no relationship between intrinsic motivation and training performance. The discrepant findings might be due to different approaches to modeling motivation. Including motivation as a time-varying covariate allowed us to examine the association between motivation and performance session by session, providing a more nuanced picture of their relationship over time. Our findings can inform decisions on when it might be most important to support participantsm training motivation in order to maximize training performance. For example, it might be beneficial to take actions to support motivation after the first couple of training sessions, such as supporting participants relationship over time. Deci et al., 1999), or by providing other motivational features, e.g., through a game-like environment (Mohammed et al. 2017; Deveau et al. 2015).
Implicit Theories about Intelligence
In this study, we found no association between ITI and training performance. Based on the broader literature, we were expecting to find a positive relationship between growth mindset and training performance. Some earlier studies have shown a positive correlation between having a growth mindset and subsequent transfer of skills (Jaeggi et al. 2014), although their finding was mostly driven by the active control group. Other studies have found significant negative correlations between ITI and training performance (Guye et al. 2017; Thompson et al. 2013). In the current study, the frequency of training and the total amount of training is lower than in the other studies investigating ITI. Thus, it might be that the restricted training time has prevented a possible effect of mindset.
Sleep Quality
We hypothesized that self-reported sleep quality would affect both initial training performance as well as the rate of change. We did indeed observe that sleep quality predicted initial training performance, but not the rate of change. Sleep boosts performance when two training sessions are separated by a nap (Lau et al. 2015) or a night of sleep (Zinke et al. 2018; Kuriyama et al. 2008). Having the opportunity to sleep between training sessions might be vital to training performance because sleep supports the consolidation of memories (Stickgold 2005). Interestingly, a study by Fenn and Hambrick (2012) showed a correlation between working memory capacity and consolidation of declarative memory during sleep, suggesting that sleep-dependent declarative memory consolidation might itself be dependent on individual differences in working memory capacity. This has not been taken into consideration in the present paper but might be worth investigating further. In our study, as in most working memory training studies, all participants were given ample opportunity to sleep between training sessions; in fact, the time between sessions was significantly longer than most working memory training studies. So, we wanted to know if not only sleep but also self-reported sleep quality affected training performance. Interpreting our results, what is important for boosting performance is having the opportunity to sleep between training sessions, but sleep quality per se does not seem to affect the rate of change in performance. Previous findings show that loss of sleep has a direct negative effect on working memory performance (Lo et al. 2015; Lo et al. 2012; Santisteban et al. 2019). Consequently, having lower sleep quality might affect training performance because it diminishes the working memory resources available when training. In accordance with this view, we observe that initial training performance and all subsequent performances are uniformly and negatively affected by low sleep quality.
Psychological Well-being and Perceived Stress
To our knowledge, psychological well-being and perceived stress are yet unexplored as potential predictors of training performance. Even though psychological health has shown to be associated with job performance, academic achievement, and executive functions more broadly (Ford et al. 2011; Bücker et al. 2018; McDermott and Ebmeier 2009; Sandström et al. 2005; Tsai et al. 2019; Tsai et al. 2020), neither well-being nor perceived stress predicted initial training performance or rate of change. Of note, participants in the analytical sample reported relatively high rates of psychological well-being and low perceived stress, which might have affected our results due to restricted range issues.
Adherence to the Intervention
Interestingly, we found that the participants who adhered to the training intervention performed better on almost all baseline assessments and were generally higher functioning. Specifically, participants, who completed 9 out of 12 training sessions, scored significantly higher on tests of intelligence and verbal and visual working memory as compared with participants completing less than 9 training sessions (Table 1). These findings are consistent with those of Jaeggi et al. (2014), who found that participants who completed a training study also scored higher on tests of intelligence at baseline. Participants who completed 9 out of 12 training sessions also rated their level of perceived stress as significantly lower and their sleep quality as higher as compared with their participants completing less than 9 training sessions. The fact that individuals with relatively lower cognitive abilities are also more likely to drop out of an intervention is an issue, given that those individuals who might need it the most might either not see the value of training, or alternatively, they might have experiences of failure, both of which could result in their lack of adherence to the intervention program. Those with higher perceived stress levels might be even more likely sensitive to experiences/perceptions of failure. In sum, based on our results, pre-existing abilities and person-related characteristics could be used to design personalized interventions, specifically, participants who are likely to struggle with performance and adherence should receive targeted support to maximize motivation and persistence. Moving forward, future research could focus on the identification of the most important specific factor (or combination of factors) for each individual in such targeted designs.
Limitations of the Study
One of the primary limitations of this study is that in addition to the surveys, the training data were self-reported by the participants. Obtaining the actual training data was not possible due to technical reasons; thus, we were not able to check whether the students actually completed the training, and/or if they reported all training activities. Self-reporting is prone to bias (Paulhus 1984), and participants might not have reported their actual training performance or all their training activities, even though they did not have any incentives for false reports. Nonetheless, the cross-validation of the self-reported training data with the softwareeir training activities, even though they did not have any incentives for false reports. gns.aining sessionsthm set by Brain Workshop, which largely supports the validity of self-reports.
Another potential issue is that the total training time and frequency of the intervention were relatively low. According to Soveri et al. (2017), the median total training time in n-back training studies is 6.67 h distributed over a median of 15 training sessions. Our study was below the median with a total training time of approximately 4 h and 12 training sessions. The study was also different from other protocols because the training took place only once a week, while the majority of studies requires participants to train several times a week (Melby-Lervåg and Hulme 2013). Nonetheless, it is unclear whether our training protocol affected the specific training gains. For example, Jaeggi et al. (2019) tested different spacing between training session (twice per day, once per day, or once every other day) and found that it had minimal effect on learning; still, training sessions that happen only once per week might lead to some forgetting, and thus, restricted learning.
Even though we tested several hypotheses in the present paper, our paper is largely exploratory, and thus, we decided not to correct for multiple comparisons, except when using the same predictor multiple times (cf. Tables 5 and 6). But running multiple tests does increase the risk of familywise error inflation and this is clearly a limitation of our study. Thus, the results presented here need to be confirmed by future studies.
It is important to stress that the present study is a correlational study. So, strictly speaking, we cannot infer that baseline cognitive ability is affecting training performance. If possible, future studies should adopt stronger designs that include control groups.
Finally, as discussed further above, the analytical sample used here was different from the original sample. When considering the baseline characteristics, the analytical sample used here was less diverse and relatively higher functioning as compared to the full sample, both in terms of cognitive functioning and mental health. This in turn might have affected the analyses, including limiting the effect of individual differences. Critically, out of the 754 participants who were assigned to dual-n-back training, only 217 completed 9 out of 12 training sessions. Our inclusion criterion required the completion of 9 out of 12 training sessions in order to maximize the overall time on task. Given that this study was completed in classrooms in group settings, and that training and testing were administered by teachers, the fidelity of implementation was certainly not as high as compared with laboratory studies. This applied setting might also have affected the large attrition rate. Nevertheless, research in an applied setting is valuable and provides important knowledge to the field of working memory training on the strengths and limitations of training interventions applied in more ecologically valid settings.
Conclusion
This study adds additional support for the magnification account observed in various intervention studies; specifically, our data indicate that individuals with higher baseline cognitive ability benefit more from a working memory intervention than individuals with lower cognitive ability. The general support for the magnification account has implications for the value of working memory training in cognitive remediation. Individuals with lower cognitive ability might not be able to catch up to individual with higher cognitive abilities when high and low ability and individuals follow the same protocol. Thus, in order to maximize training outcomes, lower ability individuals might benefit from more tailored interventions, for example by providing them with more training time or help with the implementation of appropriate strategies or by implementing motivational features. In addition to adding to the accumulating support for the magnification account, our results indicate that task-relevant cognitive resources might impact performance differentially as the training intervention progresses. The change in cognitive demands might be related to strategy use. Future studies could analyze strategy use and baseline cognitive abilities in relation to performance change. Furthermore, training motivation seems to be predictive of training performance, but not in a uniform way throughout the intervention. Overall, it seems training motivation is most predictive of performance midway through the intervention. This can potentially inform decisions on when to support motivation during a working memory training intervention. Finally, our results suggest that higher-functioning individuals are more likely to adhere to the training intervention. This finding is particularly important given that one of the primary aims of working memory interventions is to alleviate cognitive deficits.
In sum, this study illustrates how certain individual difference factors affect training outcome, informing future intervention research that aims to improve cognitive functions by targeted working memory training.
Supplementary Material
Acknowledgements
The authors want to thank the students, teachers, and schools participating in the Young Brain Project.
Funding
This study was funded by Nordea-fonden, www.nordeafonden.dk, grant number 02-2015-1925. SMJ is supported by the National Institute of Aging (grant number 1K02AG054665).
Footnotes
Supplementary Information The online version contains supplementary material available at https://doi.org/10.1007/s41465-021-00216-5.
Consent to Participate Written consent to participate was obtained.
Conflict of Interest The authors declare no competing interests.
Data Availability
Data sharing is restricted according to the General Data Protection Regulation (GDPR) in European Union (EU). Data cannot be shared, because it contains potentially identifying and sensitive personal information.
References
- Alloway TP, & Alloway RG (2010). Investigating the predictive roles of working memory and IQ in academic attainment. Journal of experimental child psychology, 106(1), 20–29. [DOI] [PubMed] [Google Scholar]
- Au J, Sheehan E, Tsai N, Duncan GJ, Buschkuehl M, & Jaeggi SM (2015). Improving fluid intelligence with training on working memory: A meta-analysis. Psychonomic bulletin & review, 22(2), 366–377. [DOI] [PubMed] [Google Scholar]
- Baddeley A (1992). Working memory. Science, 255(5044), 556–559. [DOI] [PubMed] [Google Scholar]
- Bahník Š, & Vranka MA (2017). Growth mindset is not associated with scholastic aptitude in a large sample of university applicants. Personality and Individual Differences, 117, 139–143. [Google Scholar]
- Bender R, & Lange S (2001). Adjusting for multiple testing—when and how? Journal of clinical epidemiology, 54(4), 343–349. [DOI] [PubMed] [Google Scholar]
- Borella E, Carretti B, Cantarella A, Riboldi F, Zavagnin M, & De Beni R (2014). Benefits of training visuospatial working memory in young–old and old–old. Developmental psychology, 50(3), 714. [DOI] [PubMed] [Google Scholar]
- Borella E, Carbone E, Pastore M, De Beni R, & Carretti B (2017). Working memory training for healthy older adults: the role of individual characteristics in explaining short-and long-term gains. Frontiers in Human Neuroscience, 11, 99. [DOI] [PMC free article] [PubMed] [Google Scholar]
- Brose A, Schmiedek F, Lövdén M, & Lindenberger U (2012). Daily variability in working memory is coupled with negative affect: the role of attention and motivation. Emotion, 12(3), 605. [DOI] [PubMed] [Google Scholar]
- Bücker S, Nuraydin S, Simonsmeier BA, Schneider M, & Luhmann M (2018). Subjective well-being and academic achievement: A meta-analysis. Journal of Research in Personality, 74, 83–94. 10.1016/j.jrp.2018.02.007. [DOI] [Google Scholar]
- Bühner M, König CJ, Pick M, & Krumm S (2006). Working memory dimensions as differential predictors of the speed and error aspect of multitasking performance. Human Performance, 19(3), 253–275. [Google Scholar]
- Bürki CN, Ludwig C, Chicherio C, & de Ribaupierre A (2014). Individual differences in cognitive plasticity: an investigation of training curves in younger and older adults. Psychological Research, 78(6), 821–835. [DOI] [PubMed] [Google Scholar]
- Buysse DJ, Reynolds CF III, Monk TH, Berman SR, & Kupfer DJ (1989). The Pittsburgh Sleep Quality Index: a new instrument for psychiatric practice and research. Psychiatry research, 28(2), 193–213. [DOI] [PubMed] [Google Scholar]
- Cameron J, & Pierce WD (1994). Reinforcement, reward, and intrinsic motivation: A meta-analysis. Review of Educational research, 64(3), 363–423. [Google Scholar]
- Cerasoli CP, Nicklin JM, & Ford MT (2014). Intrinsic motivation and extrinsic incentives jointly predict performance: A 40-year meta-analysis. Psychological bulletin, 140(4), 980. [DOI] [PubMed] [Google Scholar]
- Cohen S, Kamarck T, & Mermelstein R (1983). A global measure of perceived stress. Journal of health and social behavior, 385–396. [PubMed] [Google Scholar]
- Colom R, Román FJ, Abad FJ, Shih PC, Privado J, Froufe M, Escorial S, Martinez K, Burgaleta M, Quiroga MA, Karama S, Haier RJ, Thompson PM, & Jaeggi SM (2013). Adaptive n-back training does not improve fluid intelligence at the construct level: Gains on individual tests suggest training may enhance visuospatial processing. Intelligence, 41(5), 712–727. [Google Scholar]
- Dahlin E, Nyberg L, Bäckman L, & Neely AS (2008). Plasticity of executive functioning in young and older adults: immediate training gains, transfer, and long-term maintenance. Psychology and aging, 23(4), 720. [DOI] [PubMed] [Google Scholar]
- Deci EL, Koestner R, & Ryan RM (1999). A meta-analytic review of experiments examining the effects of extrinsic rewards on intrinsic motivation. Psychological bulletin, 125(6), 627. [DOI] [PubMed] [Google Scholar]
- Deveau J, Jaeggi SM, Zordan V, Phung C, & Seitz AR (2015). How to build better memory training games. Frontiers in Systems Neuroscience, 8, 243–243. 10.3389/fnsys.2014.00243. [DOI] [PMC free article] [PubMed] [Google Scholar]
- Dweck CS (1986). Motivational processes affecting learning. American psychologist, 41(10), 1040. [Google Scholar]
- Dweck CS (2013). Self-theories: Their role in motivation, personality, and development: Psychology press. [PubMed] [Google Scholar]
- Dweck CS, & Chiu C. y., & Hong Y.-y. (1995). Implicit theories and their role in judgments and reactions: A word from two perspectives. Psychological inquiry, 6(4), 267–285. [Google Scholar]
- Engle RW (2002). Working memory capacity as executive attention. Current directions in psychological science, 11(1), 19–23. [Google Scholar]
- Eskildsen A, Dalgaard VL, Nielsen KJ, Andersen JH, Zachariae R, Olsen LR, et al. (2015). Cross-cultural adaptation and validation of the Danish consensus version of the 10-item Perceived Stress Scale. Scandinavian journal of work, environment & health, 486–490. [DOI] [PubMed] [Google Scholar]
- Fellman D, Jylkkä J, Waris O, Soveri A, Ritakallio L, Haga S, et al. (2020). The role of strategy use in working memory training outcomes. Journal of Memory and Language, 110, 104064. [Google Scholar]
- Fenn KM, & Hambrick DZ (2012). Individual differences in working memory capacity predict sleep-dependent memory consolidation. Journal of experimental psychology: General, 141(3), 404–410. 10.1037/a0025268. [DOI] [PubMed] [Google Scholar]
- Flora DB (2008). Specifying piecewise latent trajectory models for longitudinal data. Structural Equation Modeling: A Multidisciplinary Journal, 15(3), 513–533. [Google Scholar]
- Ford MT, Cerasoli CP, Higgins JA, & Decesare AL (2011). Relationships between psychological, physical, and behavioural health and work performance: A review and meta-analysis. Work & Stress, 25(3), 185–204. [Google Scholar]
- Foster JL, Harrison TL, Hicks KL, Draheim C, Redick TS, & Engle RW (2017). Do the effects of working memory training depend on baseline ability level? Journal of Experimental Psychology: Learning, Memory, and Cognition, 43(11), 1677. [DOI] [PubMed] [Google Scholar]
- Gathercole SE, Dunning DL, Holmes J, & Norris D (2019). Working memory training involves learning new skills. Journal of Memory and Language, 105, 19–42. [DOI] [PMC free article] [PubMed] [Google Scholar]
- Guðmundsdóttir HB, Olason DP, Guðmundsdóttir DG, & Sigurðsson JF (2014). A psychometric evaluation of the Icelandic version of the WHO-5. Scand J Psychol, 55(6), 567–572. 10.1111/sjop.12156. [DOI] [PubMed] [Google Scholar]
- Guye S, & Von Bastian CC (2017). Working memory training in older adults: Bayesian evidence supporting the absence of transfer. Psychology and aging, 32(8), 732. [DOI] [PubMed] [Google Scholar]
- Guye S, De Simoni C, & von Bastian CC (2017). Do individual differences predict change in cognitive training performance? A latent growth curve modeling approach. Journal of Cognitive Enhancement, 1(4), 374–393. [Google Scholar]
- Heun R, Burkart M, Maier W, & Bech P (1999). Internal and external validity of the WHO Well-Being Scale in the elderly general population. Acta Psychiatr Scand, 99(3), 171–178. 10.1111/j.1600-0447.1999.tb00973.x. [DOI] [PubMed] [Google Scholar]
- Hu L. t., & Bentler PM (1999). Cutoff criteria for fit indexes in covariance structure analysis: Conventional criteria versus new alternatives. Structural Equation Modeling: A Multidisciplinary Journal, 6(1), 1–55. [Google Scholar]
- Jaeggi SM, Buschkuehl M, Jonides J, & Perrig WJ (2008). Improving fluid intelligence with training on working memory. Proceedings of the National Academy of Sciences, 105(19), 6829–6833. [DOI] [PMC free article] [PubMed] [Google Scholar]
- Jaeggi SM, Buschkuehl M, Perrig WJ, & Meier B (2010). The concurrent validity of the N-back task as a working memory measure. Memory, 18(4), 394–412. [DOI] [PubMed] [Google Scholar]
- Jaeggi SM, Buschkuehl M, Shah P, & Jonides J (2014). The role of individual differences in cognitive training and transfer. Memory & cognition, 42(3), 464–480. [DOI] [PubMed] [Google Scholar]
- Jaeggi SM, Buschkuehl M, Parlett-Pelleriti CM, Moon SM, Evans M, Kritzmacher A, et al. (2019). Investigating the Effects of Spacing on Working Memory Training Outcome: A Randomized, Controlled, Multisite Trial in Older Adults. The Journals of Gerontology: Series B, 75(6), 1181–1192. 10.1093/geronb/gbz090. [DOI] [PMC free article] [PubMed] [Google Scholar]
- Karbach J, & Verhaeghen P (2014). Making working memory work: a meta-analysis of executive-control and working memory training in older adults. Psychological science, 25(11), 2027–2037. [DOI] [PMC free article] [PubMed] [Google Scholar]
- Jenkins GD Jr., Mitra A, Gupta N, & Shaw JD (1998). Are financial incentives related to performance? A meta-analytic review of empirical research. Journal of applied psychology, 83(5), 777. [Google Scholar]
- Karbach J, Könen T, & Spengler M (2017). Who benefits the most? Individual differences in the transfer of executive control training across the lifespan. Journal of Cognitive Enhancement, 1(4), 394–405. [Google Scholar]
- Katz B, Jones MR, Shah P, Buschkuehl M, & Jaeggi SM (2016). Individual differences and motivational effects. In Cognitive training 157–166 Springer. [Google Scholar]
- Katz B, Jaeggi SM, Buschkuehl M, Shah P, & Jonides J (2018). The effect of monetary compensation on cognitive training outcomes. Learning and Motivation, 63, 77–90. [Google Scholar]
- Kliegl R, & Lindenberger U (1993). Modeling Intrusions and Correct Recall in Episodic Memory: Adult Age Differences in Encoding of List Context. Journal of experimental psychology. Learning, memory, and cognition, 19, 617–637. 10.1037/0278-7393.19.3.617. [DOI] [PubMed] [Google Scholar]
- Könen T, & Karbach J (2015). The benefits of looking at intraindividual dynamics in cognitive training data. Frontiers in psychology, 6, 615. [DOI] [PMC free article] [PubMed] [Google Scholar]
- Kuriyama K, Mishima K, Suzuki H, Aritake S, & Uchiyama M (2008). Sleep accelerates the improvement in working memory performance. Journal of Neuroscience, 28(40), 10145–10150. [DOI] [PMC free article] [PubMed] [Google Scholar]
- Laine M, Fellman D, Waris O, & Nyman TJ (2018). The early effects of external and internal strategies on working memory updating training. Scientific Reports, 8(1), 4045. 10.1038/s41598-018-22396-5. [DOI] [PMC free article] [PubMed] [Google Scholar]
- Lau EYY, Wong ML, Lau KNT, Hui FWY, & Tseng C. h. (2015). Rapid-Eye-Movement-Sleep (REM) Associated Enhancement of Working Memory Performance after a Daytime Nap. PLoS One, 10(5), e0125752. 10.1371/journal.pone.0125752. [DOI] [PMC free article] [PubMed] [Google Scholar]
- Lo JC, Groeger JA, Santhi N, Arbon EL, Lazar AS, Hasan S, et al. (2012). Effects of partial and acute total sleep deprivation on performance across cognitive domains, individuals and circadian phase. PLoS One, 7(9), e45987. [DOI] [PMC free article] [PubMed] [Google Scholar]
- Lo J, Ong JL, Leong R, Gooley J, & Chee M (2015). Cognitive Performance, Sleepiness, and Mood in Partially Sleep Deprived Adolescents: The Need for Sleep Study. Sleep, 39. 10.5665/sleep.5552. [DOI] [PMC free article] [PubMed] [Google Scholar]
- Lövdén M, Brehmer Y, Li S-C, & Lindenberger U (2012). Training-induced compensation versus magnification of individual differences in memory performance. [Original Research]. Frontiers in Human Neuroscience, 6, 141. 10.3389/fnhum.2012.00141. [DOI] [PMC free article] [PubMed] [Google Scholar]
- Matysiak O, Kroemeke A, & Brzezicka A (2019). Working Memory Capacity as a Predictor of Cognitive Training Efficacy in the Elderly Population. [Original Research]. Frontiers in aging neuroscience, 11, 126. 10.3389/fnagi.2019.00126. [DOI] [PMC free article] [PubMed] [Google Scholar]
- McDermott LM, & Ebmeier KP (2009). A meta-analysis of depression severity and cognitive function. Journal of Affective Disorders, 119(1), 1–8. 10.1016/j.jad.2009.04.022. [DOI] [PubMed] [Google Scholar]
- Meiran N, Dreisbach G, & von Bastian CC (2019). Mechanisms of working memory training: Insights from individual differences. Intelligence, 73, 78–87. 10.1016/j.intell.2019.01.010. [DOI] [Google Scholar]
- Melby-Lervåg M, & Hulme C (2013). Is working memory training effective? A meta-analytic review. Developmental psychology, 49(2), 270. [DOI] [PubMed] [Google Scholar]
- Melby-Lervåg M, Redick TS, & Hulme C (2016). Working memory training does not improve performance on measures of intelligence or other measures of “far transfer” evidence from a meta-analytic review. Perspectives on Psychological Science, 11(4), 512–534. [DOI] [PMC free article] [PubMed] [Google Scholar]
- Metcalfe A, MacIntosh B, Scavone A, Ou X, Korczak D, & Goldstein B (2016). Effects of acute aerobic exercise on neural correlates of attention and inhibition in adolescents with bipolar disorder. Translational psychiatry, 6(5), e814. [DOI] [PMC free article] [PubMed] [Google Scholar]
- Mohammed S, Flores L, Deveau J, Hoffing RC, Phung C, Parlett CM, et al. (2017). The benefits and challenges of implementing motivational features to boost cognitive training outcome. Journal of Cognitive Enhancement, 1(4), 491–507. [DOI] [PMC free article] [PubMed] [Google Scholar]
- Ørskov PT (2020). Evaluation of the effectiveness og a multifacted brain training intervention applied in an upper secondary shcool Setting. (PhD thesis). University of Southern Denmark. [Google Scholar]
- Ørskov PT, & Beatty EL (2018). Psychometric investigation of the subtest odd item out from reynolds intellectual screening test in a sample of Danish students. In nordic meeting in neuropsychology, Stockholm, 22–24. [Google Scholar]
- Ørskov PT, Norup A, Debrabant B, & Beatty EL (2020). Increasing Working Memory in Young Healthy Adults: A cluster randomized controlled trial of a multifaceted brain training intervention. Journal of Cognitive Enhancement. 10.1007/s41465-020-00191-3. [DOI] [Google Scholar]
- Park I, & Schutz RW (2005). An Introduction to latent growth model: analysis of repeated measures physical performance data. Research quarterly for exercise and sport, 76(2), 176–192. [DOI] [PubMed] [Google Scholar]
- Paulhus DL (1984). Two-component models of socially desirable responding. Journal of personality and social psychology, 46(3), 598. [Google Scholar]
- Pergher V, Shalchy MA, Pahor A, Van Hulle MM, Jaeggi SM, & Seitz AR (2019). Divergent research methods limit understanding of working memory training. Journal of Cognitive Enhancement, 1–21. [DOI] [PMC free article] [PubMed] [Google Scholar]
- Redick TS (2019). The Hype Cycle of Working Memory Training. Current directions in psychological science, 28(5), 423–429. 10.1177/0963721419848668. [DOI] [PMC free article] [PubMed] [Google Scholar]
- Reynolds CR, & Kamphaus RW (2011). RIAS/RIST Reynolds Intellectual Assessment Scales. Reynolds Intellectual Screening Test: Vejledning. : Hogrefe Psykologisk Forlag A/S. [Google Scholar]
- Rhodes RE, & Katz B (2017). Working memory plasticity and aging. Psychology and aging, 32(1), 51. [DOI] [PubMed] [Google Scholar]
- Ryan RM, & Deci EL (2000). Self-determination theory and the facilitation of intrinsic motivation, social development, and well-being. American psychologist, 55(1), 68. [DOI] [PubMed] [Google Scholar]
- Sandström A, Rhodin IN, Lundberg M, Olsson T, & Nyberg L (2005). Impaired cognitive performance in patients with chronic burnout syndrome. Biological psychology, 69(3), 271–279. [DOI] [PubMed] [Google Scholar]
- Santisteban JA, Brown TG, Ouimet MC, & Gruber R (2019). Cumulative mild partial sleep deprivation negatively impacts working memory capacity but not sustained attention, response inhibition, or decision making: a randomized controlled trial. Sleep health, 5(1), 101–108. [DOI] [PubMed] [Google Scholar]
- Schmeichel BJ, Volokhov RN, & Demaree HA (2008). Working memory capacity and the self-regulation of emotional expression and experience. Journal of personality and social psychology, 95(6), 1526. [DOI] [PubMed] [Google Scholar]
- Schougaard LMV, de Thurah A, Bech P, Hjollund NH, & Christiansen DH (2018). Test-retest reliability and measurement error of the Danish WHO-5 Well-being Index in outpatients with epilepsy. Health and quality of life outcomes, 16(1), 175. [DOI] [PMC free article] [PubMed] [Google Scholar]
- Schwaighofer M, Fischer F, & Bühner M (2015). Does working memory training transfer? A meta-analysis including training conditions as moderators. Educational Psychologist, 50(2), 138–166. [Google Scholar]
- Segretin MS, Lipina S, Hermida MJ, Sheffield T, Nelson J, Espy K, et al. (2014). Predictors of cognitive enhancement after training in preschoolers from diverse socioeconomic backgrounds. [Original Research]. Frontiers in psychology, 5, 205. 10.3389/fpsyg.2014.00205. [DOI] [PMC free article] [PubMed] [Google Scholar]
- Sisk VF, Burgoyne AP, Sun J, Butler JL, & Macnamara BN (2018). To what extent and under which circumstances are growth mind-sets important to academic achievement? Two meta-analyses. Psychological science, 29(4), 549–571. [DOI] [PubMed] [Google Scholar]
- Soveri A, Antfolk J, Karlsson L, Salo B, & Laine M (2017). Working memory training revisited: A multi-level meta-analysis of n-back training studies. Psychonomic bulletin & review, 24(4), 1077–1096. [DOI] [PubMed] [Google Scholar]
- Stickgold R (2005). Sleep-dependent memory consolidation. Nature, 437(7063), 1272. [DOI] [PubMed] [Google Scholar]
- Studer-Luethi B, Jaeggi SM, Buschkuehl M, & Perrig WJ (2012). Influence of neuroticism and conscientiousness on working memory training outcome. Personality and Individual Differences, 53(1), 44–49. 10.1016/j.paid.2012.02.012. [DOI] [Google Scholar]
- Studer-Luethi B, Bauer C, & Perrig WJ (2016). Working memory training in children: Effectiveness depends on temperament. Memory & cognition, 44(2), 171–186. [DOI] [PubMed] [Google Scholar]
- Thompson TW, Waskom ML, Garel K-LA, Cardenas-Iniguez C, Reynolds GO, Winter R, et al. (2013). Failure of working memory training to enhance cognition or intelligence. PLoS One, 8(5), e63614. [DOI] [PMC free article] [PubMed] [Google Scholar]
- Topp CW, Østergaard SD, Søndergaard S, & Bech P (2015). The WHO-5 Well-Being Index: a systematic review of the literature. Psychotherapy and psychosomatics, 84(3), 167–176. [DOI] [PubMed] [Google Scholar]
- Tsai N, Eccles JS, & Jaeggi SM (2019). Stress and executive control: mechanisms, moderators, and malleability. Brain and Cognition, 133, 54–59. [DOI] [PubMed] [Google Scholar]
- Tsai N, Jaeggi SM, Eccles JS, Atherton OE, & Robins RW (2020). Predicting Late Adolescent Anxiety From Early Adolescent Environmental Stress Exposure: Cognitive Control as Mediator. [Original Research]. Frontiers in psychology, 11, 1838. 10.3389/fpsyg.2020.01838. [DOI] [PMC free article] [PubMed] [Google Scholar]
- Unsworth N, & Engle RW (2007). On the division of short-term and working memory: an examination of simple and complex span and their relation to higher order abilities. Psychological bulletin, 133(6), 1038. [DOI] [PubMed] [Google Scholar]
- Vartanian O, Coady L, & Blackler K (2016). 3d multiple object tracking boosts working memory span: Implications for cognitive training in military populations. Military Psychology, 28(5), 353–360. [Google Scholar]
- Weicker J, Villringer A, & Thöne-Otto A (2016). Can impaired working memory functioning be improved by training? A meta-analysis with a special focus on brain injured patients. Neuropsychology, 30(2), 190. [DOI] [PubMed] [Google Scholar]
- Wiemers EA, Redick TS, & Morrison AB (2019). The Influence of Individual Differences in Cognitive Ability on Working Memory Training Gains. Journal of Cognitive Enhancement, 3(2), 174–185. 10.1007/s41465-018-0111-2. [DOI] [PMC free article] [PubMed] [Google Scholar]
- Xie W, Berry A, Lustig C, Deldin P, & Zhang W (2019). Poor Sleep Quality and Compromised Visual Working Memory Capacity. Journal of the International Neuropsychological Society, 1–12. [DOI] [PMC free article] [PubMed] [Google Scholar]
- Zinke K, Noack H, & Born J (2018). Sleep augments training-induced improvement in working memory in children and adults. Neurobiology of learning and memory, 147, 46–53. [DOI] [PubMed] [Google Scholar]
Associated Data
This section collects any data citations, data availability statements, or supplementary materials included in this article.
Supplementary Materials
Data Availability Statement
Data sharing is restricted according to the General Data Protection Regulation (GDPR) in European Union (EU). Data cannot be shared, because it contains potentially identifying and sensitive personal information.