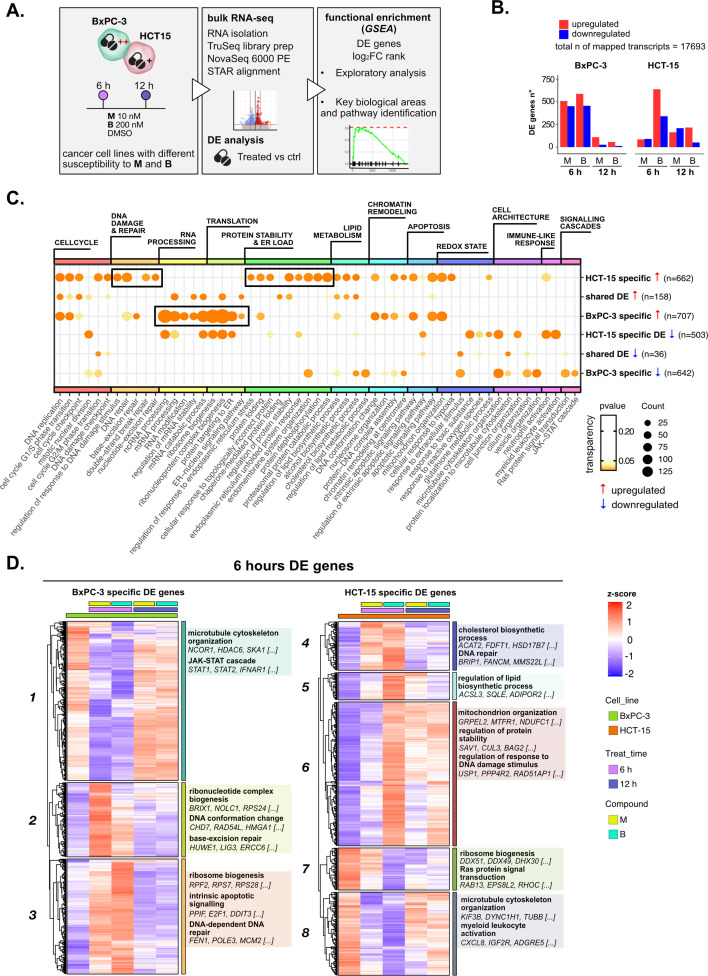
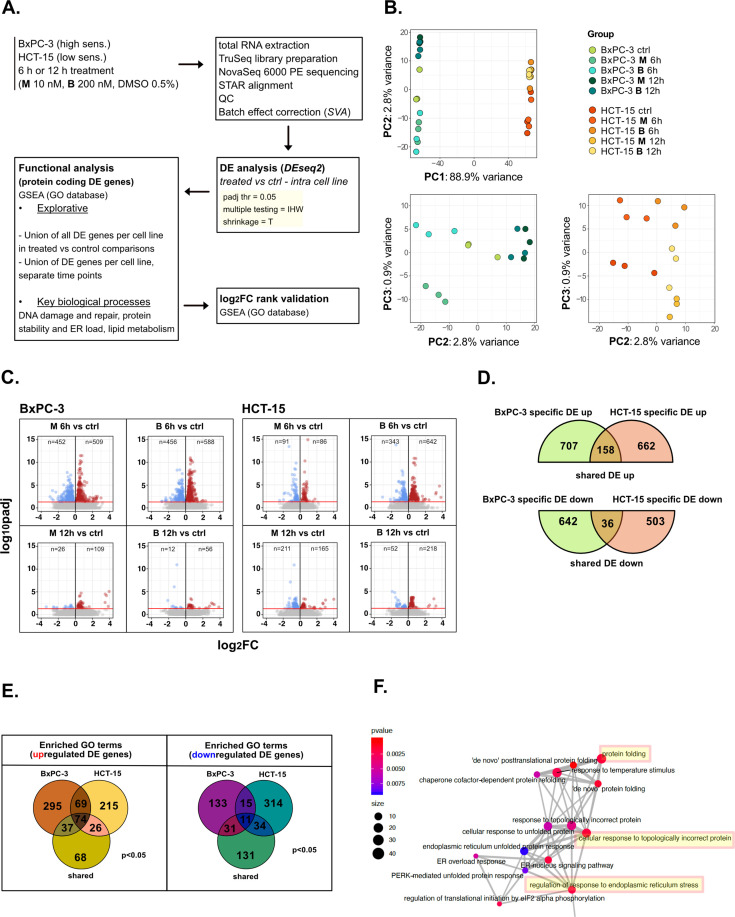
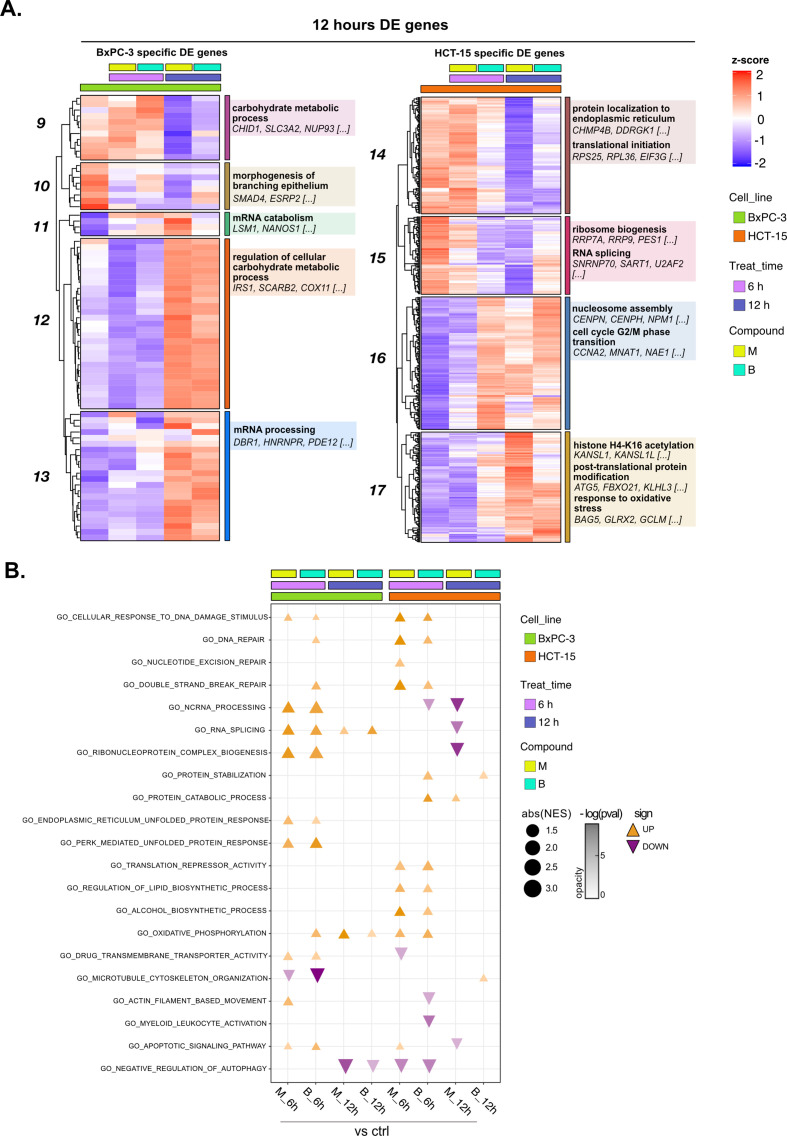
Figure 2. Treatments elicit cell-specific transcriptional changes.
(A) An overview of the applied workflow for the RNA-seq analysis. (B) Number of up- (red) and down-regulated (blue) differential expression (DE) genes in BxPC-3 and HCT-15 cells after treatment with M (10 nM), B (200 nM), or DMSO 0.5% (ctrl) for 6 hr and 12 hr (adjusted p threshold = 0.05, shrinkage = TRUE, and multiple testing method = independent hypothesis weighting [IHW]). (C) Gene ontology (GO) database functional enrichment gene set enrichment analysis (GSEA) on cell-specific and shared up- and down-regulated DE genes. For each identified biological process, enrichments in terms of count and p-value of representative terms are reported (p<0.05). (D) Expression level of cell-specific 6 hr DE genes across test conditions. GSEA was performed on modules with similar regulation identified by hierarchical clustering: for each cluster, representative GO terms and genes of the associated load are reported.


