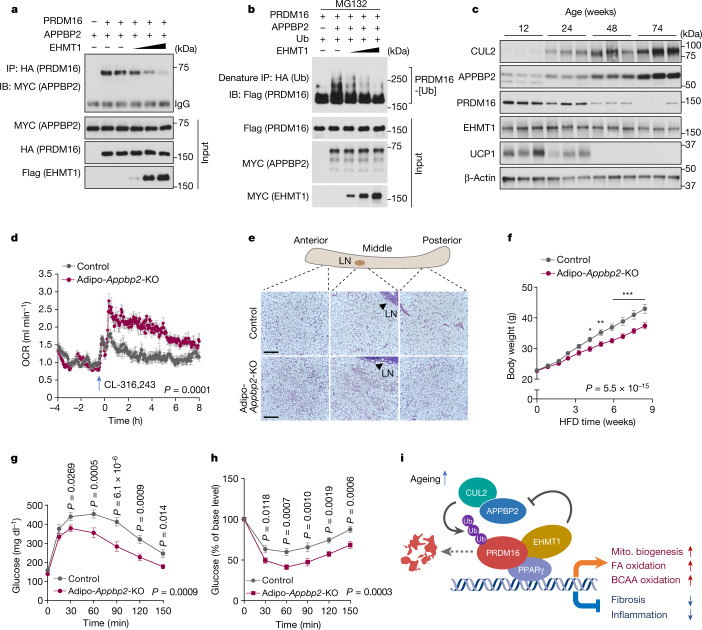
Fig. 5. APPBP2 controls whole-body energy metabolism.
a, Changes in the PRDM16–APPBP2 interaction in the presence of EHMT1. b, Changes in PRDM16 polyubiquitination in the presence of EHMT1. c, Immunoblot analysis of the indicated proteins in the inguinal WAT of mice aged 12, 24, 48 and 74 weeks. β-Actin was used as the loading control. n = 3 per group. d, The whole-body OCR of Adipo-Appbp2-KO and littermate control mice on a regular chow diet at 30 °C in response to treatment with CL-316,243. n = 8 for both groups. e, H&E staining of the inguinal WAT (anterior, middle and posterior regions) in Adipo-Appbp2-KO and control mice in d. Scale bars, 210 μm. Representative images from two biologically independent samples per group. LN, lymph node. f, The body weight of mice on an HFD. n = 10 (Adipo-Appbp2-KO) and n = 11 (control). g, Glucose-tolerance test of mice at 9 weeks of feeding on an HFD. h, Insulin-tolerance test of mice at 10 weeks of feeding on an HFD. i, A model of how CUL2–APPBP2 controls PRDM16 protein stability and beige fat biogenesis. The CUL2–APPBP2 E3 ligase complex catalyses polyubiquitination of PRDM16. Inhibition of CUL2–APPBP2 potently extends the protein half-life of PRDM16, leading to the activation of brown/beige fat genes as well as the repression of pro-inflammatory and pro-fibrosis genes in adipocytes. CUL2–APPBP2 expression in adipose tissues increases with age, showing an inverse correlation with the age-associated decline in PRDM16 protein. EHMT1 stabilizes PRDM16 protein by blocking the PRDM16–APPBP2 interaction. Mito., mitochondrial. For a–c, representative results are shown from two independent experiments. Gel source data are presented in Supplementary Fig. 1. For c, d and f–h, data are from biologically independent samples. For d, f, g and h, data are mean ± s.e.m. Two-sided P values were calculated using two-way repeated-measures ANOVA (d and f–h) followed by Fisher’s least significant difference test (f–h). *P < 0.05, **P < 0.01, ***P < 0.001. Exact P values are shown in Supplementary Table 2.

