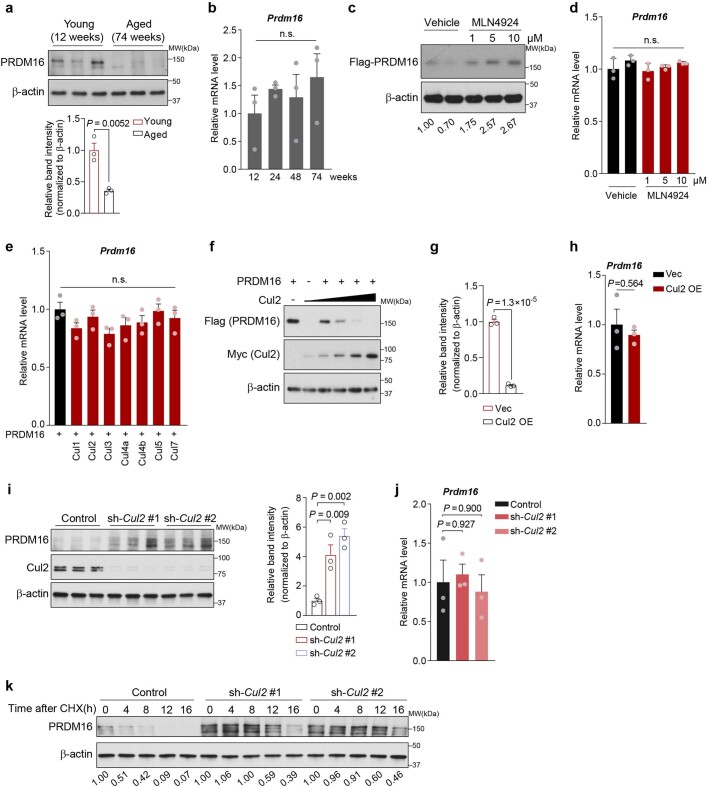
Extended Data Fig. 1. Regulation of PRDM16 protein and mRNA levels.
a, Immunoblotting of indicated proteins in the inguinal WAT of mice at 12 and 74 weeks old. Lower panel: Quantification of PRDM16 protein levels and normalized to β-actin levels. b, Relative mRNA levels of Prdm16 in the inguinal WAT of mice at indicated age. c, d, Immunoblotting of indicated proteins (c) and relative mRNA levels of Prdm16 (d) in inguinal adipocytes expressing Flag-tagged PRDM16 in the presence or absence of MLN4924. e, Relative mRNA levels of Prdm16 in HEK293T cells expressing indicated constructs. f, Immunoblotting of Flag-tagged PRDM16 protein in HEK293T cells expressing indicated constructs. g, Quantification of PRDM16 protein levels in Fig. 1b by Image J software and normalized to β-actin levels. h, Relative mRNA levels of Prdm16 in inguinal adipocytes expressing Flag-tagged Cul2 or an empty vector. i, Left: Immunoblotting of endogenous PRDM16 and Cul2 in inguinal adipocytes expressing a scrambled control shRNA (Control) or two independent shRNAs targeting Cul2 (#1, #2). Right: Quantification of PRDM16 protein levels by Image J software and normalized to β-actin levels. j, Relative mRNA levels of Prdm16 in inguinal adipocytes expressing a scrambled control shRNA (Control) or two independent shRNAs targeting Cul2. k, Changes in endogenous PRDM16 protein stability in inguinal adipocytes expressing a scrambled control shRNA (Control) or shRNA targeting Cul2. PRDM16 protein levels were quantified by Image J software and normalized to β-actin levels. Representative results in a, c, f, i, k from two independent experiments. Gel source data are presented in Supplementary Fig. 1. a, b, d, e, g-j, n = 3 per group, biologically independent samples. Data are mean ± s.e.m.; two-sided P values by one-way ANOVA followed by Dunnett’s test (b, d, e, i, j) or unpaired Student’s t-test (a, g, h). n.s., not significant.

