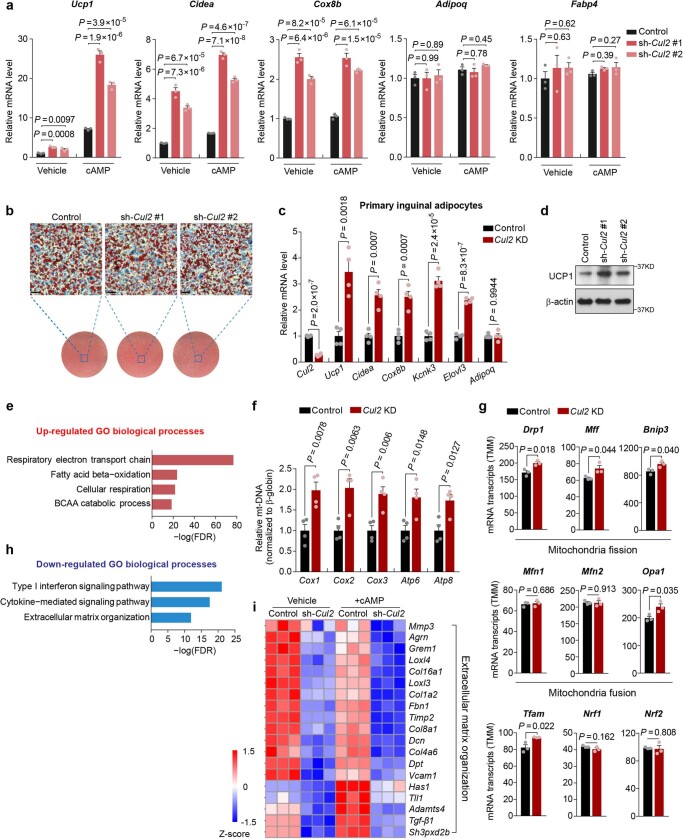
Extended Data Fig. 2. Depletion of Cul2 promotes thermogenesis in white adipocytes.
a, Relative mRNA levels of indicated genes in inguinal adipocytes expressing a scrambled control shRNA (Control) or shRNAs targeting Cul2 with or without forskolin. n = 3 per group. b, Oil-Red-O staining of inguinal adipocytes stably expressing a scrambled control shRNA (Control) or shRNAs targeting Cul2. Scale bar, 100 μm. c, Relative mRNA levels of indicated genes in control and Cul2 KD primary inguinal adipocytes. n = 4 per group. d, Immunoblotting of UCP1 and β-actin in inguinal adipocytes expressing a scrambled control shRNA (Control) or shRNAs targeting Cul2. e, Gene ontology (GO) analysis of RNA-seq data in Fig. 1d showing upregulated biological processes in Cul2-depleted inguinal adipocytes relative to control adipocytes. f, Indicated mitochondrial DNA transcripts in control and Cul2 KD inguinal adipocytes. n = 4 per group. g, Expression levels (Trimmed Mean of M-values, TMM) of indicated genes in the differentiated inguinal adipocytes expressing a scrambled control (Control) or shRNA targeting Cul2 (Cul2 KD). n = 3 per group. h, GO analysis of RNA-seq data in Fig. 1d showing downregulated biological processes in Cul2-depleted inguinal adipocytes relative to control adipocytes. i, Heat-map of transcriptome showing the changes in mRNA levels of indicated genes involving in the extracellular matrix organization in inguinal adipocytes expressing scrambled control (Control) or shRNA targeting Cul2 (sh-Cul2 #1) with or without forskolin (+ cAMP). n = 3 per group. All the listed genes are significantly different (FDR < 0.01) by edgeR. Representative results in b and d from two independent experiments. Gel source data are presented in Supplementary Fig. 1. a, c, f, g, i, biologically independent samples. Data are mean ± s.e.m.; two-sided P values by one-way ANOVA followed by Dunnett’s test (a) or unpaired Student’s t-test (c, f, g).

