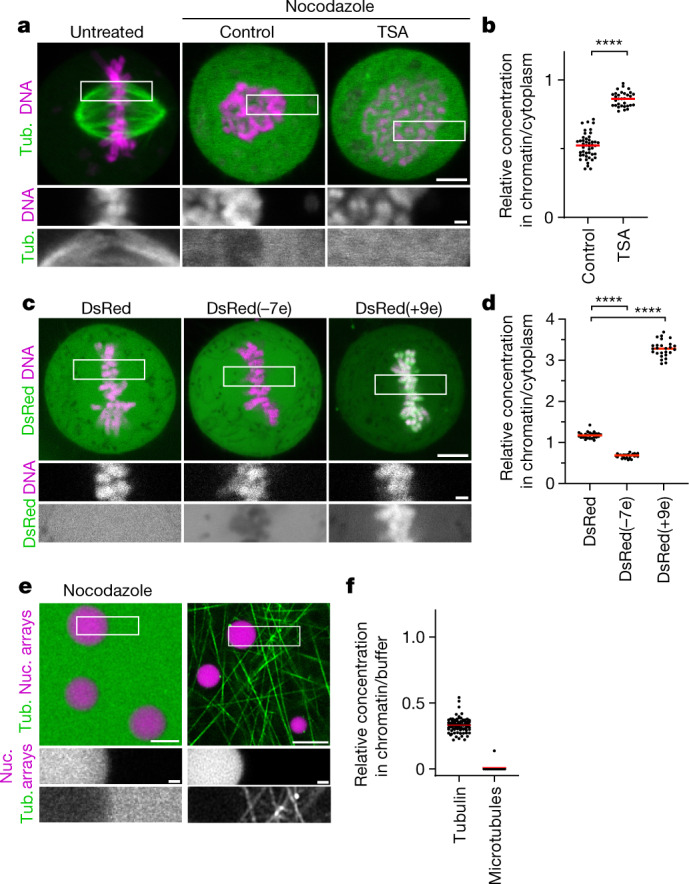
Fig. 3. Chromatin condensates limit access of tubulin and other negatively charged macromolecules.

a, The localization of tubulin (tub.) relative to mitotic chromosomes. Rhodamine-labelled tubulin was injected into live mitotic cells that were untreated, treated with nocodazole alone (control) or in combination with TSA. b, Quantification of the tubulin concentration for the data shown in a. n = 27 cells. The bars indicate the mean. Significance was tested using a two-tailed Mann–Whitney U-test (P < 1 × 10⁻¹⁵; precision limit of floating-point arithmetic). c, Live-cell images of a HeLa cell expressing DsRed or DsRed fused at its N terminus to electrically charged polypeptides. DNA was stained with Hoechst 33342. The numbers in parentheses indicate the predicted elementary charge of the tetramers formed by DsRed fusion constructs. d, Quantification of DsRed concentration for the data shown in c. n = 26 (DsRed), n = 26 (DsRed(−7e)), n = 26 (DsRed(+9e)) cells. The bars indicate the mean. Significance was tested using two-tailed Mann–Whitney U-tests (P = 0.4 × 10⁻¹⁴ (DsRed(−7e)); P = 0.4 × 10⁻¹⁴ (DsRed(+9e)). e, The localization of tubulin relative to reconstituted nucleosome (nuc.) array droplets. Nucleosome array droplets were formed by incubation in phase separation buffer and fluorescently labelled tubulin was then added in the presence of nocodazole, or in the absence of nocodazole with subsequent temperature increase to 20 °C to induce microtubule polymerization. f, Quantification of the tubulin concentration or microtubule density in nucleosome array condensates relative to buffer for the data shown in e. n = 94 droplets, n = 13 fields of polymerized microtubules. The bars indicate the mean. Biological replicates: n = 2 (a–d); n = 3 (e,f). Technical replicates: n = 3 (a,b); n = 2 (c,d); n = 3 (e,f). For a, c and e, scale bars, 5 µm (main images) and 1 µm (insets).
