

Abstract
Background
There are remarkable genetic differences between animal major histocompatibility complex (MHC) systems and the human leukocyte antigen (HLA) system. HLA transgenic humanized mouse model systems offer a much better method to study the HLA‐A‐related principal mechanisms for vaccine development and HLA‐A‐restricted responses against infection in human.
Methods
A recombinant gene encoding the chimeric HLA‐A30 monochain was constructed. This HHD molecule contains the following: α1‐α2 domains of HLA‐A30, α3 and cytoplasmic domains of H‐2Db, linked at its N‐terminus to the C‐terminus of human β2m by a 15‐amino‐acid peptide linker. The recombinant gene encoding the chimeric HLA‐A30 monochain cassette was introduced into bacterial artificial chromosome (BAC) CH502‐67J3 containing the HLA‐A01 gene locus by Red‐mediated homologous recombination. Modified BAC CH502‐67J3 was microinjected into the pronuclei of wild‐type mouse oocytes. This humanized mouse model was further used to assess the immune responses against influenza A virus (H1N1) pdm09 clinically isolated from human patients. Immune cell population, cytokine production, and histopathology in the lung were analyzed.
Results
We describe a novel human β2m‐HLA‐A30 (α1α2)‐H‐2Db (α3 transmembrane cytoplasmic) (HHD) monochain transgenic mouse strain, which contains the intact HLA‐A01 gene locus including 49 kb 5′‐UTR and 74 kb 3′‐UTR of HLA‐A01*01. Five transgenic lines integrated into the large genomic region of HLA‐A gene locus were obtained, and the robust expression of exogenous transgene was detected in various tissues from A30‐18# and A30‐19# lines encompassing the intact flanking sequences. Flow cytometry revealed that the introduction of a large genomic region in HLA‐A gene locus can influence the immune cell constitution in humanized mice. Pdm09 infection caused a similar immune response among HLA‐A30 Tg humanized mice and wild‐type mice, and induced the rapid increase of cytokines, including IFN‐γ, TNF‐α, and IL‐6, in both HLA‐A30 humanized Tg mice and wild‐type mice. The expression of HLA‐A30 transgene was dramatically promoted in tissues from A30‐9# line at 3 days post‐infection (dpi).
Conclusions
We established a promising preclinical research animal model of HLA‐A30 Tg humanized mouse, which could accelerate the identification of novel HLA‐A30‐restricted epitopes and vaccine development, and support the study of HLA‐A‐restricted responses against infection in humans.
Keywords: HLA‐A30, humanized mouse, immunology, major histocompatibility complex (MHC)
In this study, we describe a novel human β2m‐HLA‐A30 (α1α2)‐H‐2Db (α3 transmembrane cytoplasmic) (HHD) monochain transgenic mouse strain, which contains the intact HLA‐A01 gene locus including 49 kb 5’‐UTR and 74 kb 3’‐UTR of HLA‐A01*01. Five transgenic lines integrated into the large genomic region of HLA‐A gene locus were obtained, and the robust expression of exogenous transgene was detected in various tissues from A30‐18# and A30‐19# line encompassing the intact flanking sequences. Flow cytometry analysis revealed that the introduction of large genomic region in HLA‐A gene locus can influence the constitute of immune cells population in humanized mice.
1. INTRODUCTION
Major histocompatibility complex (MHC) has a major role in activating the adaptive immune system. MHC presents antigens to immune cells in a specific context and is involved in the development of T lymphocytes in the thymus. An effective host immune response depends on synergistic effect between MHC class I and II molecules. 1 , 2 , 3 As it is difficult to perform studies on major histocompatibility complex (MHC) molecules in humans owing to the complexity of genetic variants and largely different environmental influences, many studies have pursued MHC‐related study in mouse models. 4 , 5 , 6 , 7 , 8 , 9 Considering the remarkable genetic differences between animal MHC systems and the human leukocyte antigen (HLA) system, HLA transgenic humanized mouse model systems offer a much better method to study the HLA‐A‐related principal mechanisms for vaccine development and HLA‐A‐restricted responses against infection in human. HLA class I participates in both innate (natural killer [NK]+ cells) and cell‐mediated (CD8+ cells) immune response, significantly facilitating viral clearance and reducing the severity of influenza infection. 10 , 11 , 12 Establishing a new preclinical animal model that can reliably duplicate human immune responses is becoming critical because of the rapid occurrence of emerging infectious diseases.
Humanized transgenic mice expressing several modified HLA class I molecules, a human β2m‐HLA‐A2/A11 (α1α2)‐H‐2Db (α3 transmembrane cytoplasmic) (HHD) monochain construct, 13 were generated to provide an appropriate mouse model for studying HLA class I‐restricted CTL responses. 5 , 6 , 14 , 15 This humanized mouse model is capable of mimicking human antigen processing and presentation machinery, and is helpful for evaluating T‐cell‐based vaccines and for investigating differences in antigen processing between mice and humans. 4 , 5 , 6 However, most MHC I transgenic mice, including HLA‐A2, HLA‐A24, and HLA‐A11 humanized mice, are under the control of murine minimal MHC I promoters (~500 bases). Loss of HLA‐A2 expression in a subpopulation of splenocytes in HLA‐A2Kb humanized mice further showed that conventional transgenic vectors lacking some key regulatory sequences might demonstrate position effects when integrated into the mouse genome at random. 15 , 16 Furthermore, the role of pseudogenes, noncoding RNA, and noncoding DNA sequences within HLA‐A locus, which might be involved in gene transcriptional regulation, cannot be assessed in these transgenic mice. 4 , 15 , 17 , 18 , 19 , 20 , 21
Next to HLA‐A2, HLA‐A11, and HLA‐A24, HLA‐A30 is among the most common HLA class I genotypes in China, with a phenotypic frequency of about 10% in the Chinese population. 22 , 23 , 24 To increase the diversity of humanized mouse models, a transgenic mouse model expressing HLA‐A30 molecules is needed. In this study, we describe a novel human β2m‐HLA‐A30 (α1α2)‐H‐2Db (α3 transmembrane cytoplasmic) (HHD) monochain transgenic mouse strain, which contains the intact 5′ and 3′ UTR of HLA‐A01 gene. We further verified the phenotypes and immunological characteristic of this humanized mouse model. To better understand the role of MHC molecule during influenza A virus (H1N1) pdm09 infection, we expanded upon this humanized mouse model for assessing the immune responses against influenza A virus (H1N1) pdm09 clinically isolated from human patients.
2. MATERIALS AND METHODS
2.1. Construction of the HHD chimeric HLA‐A30 transgenic plasmid
Bacterial artificial chromosome (BAC) CH502‐67 J3 containing the HLA‐A01 gene locus was obtained from BACPAC Resources, Oakland, USA. The construction of the recombinant gene encoding the chimeric HLA‐A30 monochain is shown in Figure 1A. A 4‐partner ligation was performed between homologous arm A (Hom A) and homologous arm B (Hom B) to obtain the HHD molecule: α1‐α2 domains of HLA‐A30, α3 and cytoplasmic domains of H‐2Db, linked at its N‐terminus to the C‐terminus of human β2m by a 15‐amino‐acid peptide linker. The KanR selectable marker was also added into the final constructs. MluI and SalI were placed on both sides of HLA‐A30 DNA fragment to facilitate checking the accuracy of the insertion by pulse‐field gel electrophoresis (PFGE). The inserted fragment was verified by sequencing. The recombinant gene encoding the chimeric HLA‐A30 monochain cassette was introduced into the HLA‐A01 gene by a recombineering‐based method described previously, 25 , 26 followed by Cre‐mediated removal of the neomycin (neo) selection marker by l‐arabinose induction from the modified BAC CH502‐67 J3‐HLA‐A30 constructs (Figure 1A). After digestion with restriction endonucleases MluI and XhoI, the integrity of BAC DNA was verified by PFGE. The correct insertion of the HHD molecule into the BAC clone CH502‐67 J3 was further confirmed by sequencing. The primers are listed in Supporting Information Table S1, and all were purchased from Sangon Biotech, Inc., Shanghai, China.
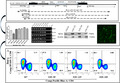
FIGURE 1.
Derivation of HLA‐A30 humanized transgenic mice. (A) Map of HLA‐A30 transgene constructs and strategy for manipulating BAC clone CH502‐67 J3 through Lambda Red‐mediated recombineering. The code sequence of HLA‐A01*01 gene is replaced with the recombinant gene encoding a human β2m‐HLA‐A30 (α1α2)‐H‐2Db (α3 transmembrane cytoplasmic) (HHD) monochains. Several transgenic lines integrated with HLA‐A gene locus are shown on the dotted line. (B) BAC copy number estimated by quantitative PCR in 5 F0 transgenic mice. (C) BAC copy number in several F1 transgenic lines estimated by quantitative PCR. (D) Expression of chimeric gene analyzed in PBMC, kidney, gut, thymus, and spleen by RT‐PCR with the specifically designed primer. WT, wild type. Marker is 5 Kb DNA marker
2.2. Generation of HHD chimeric HLA‐A30 Tg mice
The entire BAC fragment was produced by routine method as previously described. 26 , 27 Briefly, modified BAC fragment was obtained and purified using NucleoBond BAC 100 Kit. Purified circular BAC DNA was diluted to 1–3 ng/μl in microinjection buffer and microinjected into the pronuclei of wild‐type mouse oocytes. F0 generations were genotyped with the specific primers. Positive F0 mice were further crossed with wild‐type mice, and hybridization progenies were genotyped with the specific primers listed in Supporting Information Table S1.
2.3. Genotype identification and copy number estimation
Tail DNA was generated from mice tail biopsies conventionally with tissue DNA extraction kit (Trans, Beijing), as previously reported. 28 Before performing real‐time PCR, DNA samples were quantified and diluted to 10 ng/μl. A standard curve of quantitative PCR data was produced as previously reported. 28 , 29 No‐template controls were included in each experiment, and all PCR reactions were carried out in triplicate. Copy number was calculated using the following equation: estimated copy number = 2e([ΔCt − y intercept]/slope). The primer pairs are listed in Supporting Information Table S1.
2.4. Total RNA isolation, cDNA synthesis, and reverse‐transcription PCR
Total RNA was isolated from PBMC, lung, kidney, gut, thymus, and spleen using Tri‐Reagent, as described in the manufacturer's instructions. Then, 2 μg of isolated RNA was reverse transcribed into complementary DNA (cDNA) with Hifair II 1st Strand cDNA Synthesis Kit (Yeasen). Then, PCR was performed with TransTaq DNA Polymerase High Fidelity (Yeasen). Sequences of primer pairs used in this study and the product sizes are listed in Supporting Information Table S1.
2.5. Quantitative PCR
Quantitative PCR (qPCR) was performed to measure mRNA level of targeted gene, as described previously. 28 Briefly, qPCR was performed with a 20 μl volume including cDNA template, Hieff UNICON Universal Blue qPCR SYBR Green Master Mix, and oligonucleotides listed in Supporting Information Table S1 (Applied Biosystems, ABI 7300). The qPCR was started by incubation at 95°C for 10 min, followed by 40 cycles of 95°C for 10 s, 60°C for 30 s, and 72°C for 10 s. The mRNA fold change of the target gene was computed using the conventional 2−ΔΔCt method relative to the values in mock‐treated samples after normalizing to the expression value of housekeeping gene GAPDH. 30
2.6. Antibodies and flow cytometry analysis
The mice were killed by CO2 inhalation. To acquire single cells, lung was fragmented and digested with collagenase IV, and spleen was fragmented and filtered. Single‐cell suspensions of spleen and lung were incubated with FcR‐specific blocking mAb (eBioscience) and stained with FITC‐anti‐mouse CD3, Pacific blue‐anti‐mouse CD4, Brilliant Violet 605‐anti‐mouse CD8, APC‐anti‐mouse CD19, and Percp‐Cy5.5‐anti‐mouse CD335 (BioLegend, San Diego, CA, USA) and then examined by flow cytometry (LSRFortessa, BD Bioscience). The adhesion cells were excluded by FSC‐H/A and SSC‐H/A, and the lymphocytes were gated by FSC‐A and SSC‐A. The CD3+ cells were gated to determine the percentage of CD4+ and CD8+ cells, the CD3− cells were gated to determine the percentage of CD19+ and CD335+ cells.
2.7. Virus, mice, and infections
Female 4‐week‐old wild‐type mice were obtained from Shanghai Public Health Clinical Center and Shanghai SLAC Laboratory Animal Co., Ltd. (Shanghai, China). The influenza A virus strain A/Shanghai/37 T/2009(H1N1) (pdm09) used in this study was isolated and obtained from our institution. 31 Mice were anesthetized and inoculated intranasally with virus (9.85 × 10⁶ TCID50 in 50 μl) as described in previous report. Live‐mouse experiments and live‐virus experiments were performed in Biosafety Level 2 facilities following governmental and institutional guidelines. At the defined timepoints, the thymus, spleen, and lung were analyzed as described below. All animal experimental protocols were evaluated and approved by the Institute of Animal Use and Care Committee of Shanghai Public Health Clinical Center (GW2020‐A024‐01).
2.8. Cytokine analysis
Mice were killed at the indicated times, and pulmonary homogenates were lysed in RIPA lysis buffer (Beyontime, China). Lysates were stored at −80 °C. Cytokine levels were detected using a mouse ELISA kit (Solarbio, Beijing) and read on a Luminex 100 (Bio‐Rad), as described in the manufacturer’s instructions.
2.9. Immunostaining
For Immunostaining analysis, thymus tissues were fixed in 4% paraformaldehyde for at least 12 h, and placed in 30% sucrose overnight. Then, 10–12 μm sections were prepared using a cryostat microtome. The mouse β2 microglobulin (7D1) monoclonal antibody was used (Bsm‐4182 m, Bioss antibodies). The standard immunofluorescence procedure was used in this study, as previously described. 28 Fluorescent images were captured using a Leica TCS SP2 spectral confocal microscope (Leica Microsystems Inc., Mannheim, Germany).
2.10. Histopathology
For histological analysis, lung tissues were fixed in 4% paraformaldehyde for at least 12 h, dehydrated in a series of graded alcohols, embedded in paraffin, and then cut into 5‐μm‐thick sections. Subsequently, tissue sections were stained with hematoxylin and eosin (H&E) for histopathological examination. H&E‐stained lung sections were evaluated under a light microscope using a histopathologic inflammatory scoring system as described previously. 32 This scoring system has been previously used in other mouse models of respiratory infections. 33 , 34
2.11. Western blotting
Western blotting (protein immunoblot) was carried out as described previously. 28 Briefly, thymus homogenates were resuspended in cell lysis buffer (9803S; Cell Signaling). Purified protein lysates were prepared for gel electrophoresis by loading in 4× LDS Sample Buffer. The mixtures were heat‐denatured at 100°C for 5 min, and were further analyzed by 10% SDS‐PAGE. Proteins were electrotransferred to polyvinylidene fluoride membranes, which were incubated with a monoclonal anti‐hβ2m (7D1) Ab and an anti‐β‐actin Ab. Antibody‐incubated membrane was further analyzed with an HRP‐conjugated anti‐rabbit IgG secondary Ab (ZSGB‐BIO, Beijing, China) and ECL development (Pierce) according to the manufacturer's instructions.
2.12. Statistical analysis
We analyzed differences among experimental groups using SPSS 21.0. First, the experimental data were checked for homogeneity of variance and for normality. If multiple sets of variables were consistent with homogeneity of variance, analysis of variance (ANOVA) was used to compare multigroup variables; least significant difference test was used to compare intergroup variables. If homogeneity of variance is not assumed, Dunnett’s T3 test was used to compare intergroup variables. Values are represented as mean ± standard deviation (SD). p < .05 was considered significant.
3. RESULTS
3.1. Generation of HLA‐A30 humanized transgenic (HLA‐A30 Tg) mice
The construction of the recombinant gene encoding a human β2m‐HLA‐A30 (α1α2)‐H‐2Db (α3 transmembrane cytoplasmic) (HHD) monochain is illustrated in Figure 1A. Targeting vector was verified by sequencing, and was confirmed to contain the first exon of the genomic HLA‐A01*01 gene, hβ2m cDNA, a pair of synthetic oligonucleotides encoding a 15 residue (Gly4Ser3) peptide linker, the HLA‐A30 α1α2 domains, the mouse H‐2Db α3 transmembrane and cytoplasmic domains. We replaced the code sequence of HLA‐A01*01 gene with this targeting vector using the Red recombinase system in BAC clone CH502‐67 J3. 25 Modified BAC fragment was prepared by routine method as previously described, 26 , 27 and then further analyzed by pulsed‐field gel electrophoresis. Results collectively indicated that modified BAC clone CH502‐67 J3 contained the entire HLA‐A01 gene locus, including 49 kb 5′‐UTR and 74 kb 3′‐UTR of HLA‐A01*01 gene, and no rearrangement occurred. The cis‐ and trans‐regulatory elements of HLA‐A01 gene may be retained in the existing flanking regions as much as possible (Figure 1A).
After microinjection of circular modified BAC into wild‐type oocytes, we obtained 5 positive F0 generations. Polymorphic marker analysis was used to analyze integrity of exogenous chimeric gene in humanized mice (Supporting Information Figure S1A,B). All regional markers were detected in 2 lines (A30‐18# and A30‐19#), which may contain the intact BAC DNA molecules (Figure 1A). However, regional markers were partly found in other 3 lines (A30‐7#, A30‐9#, and A30‐12#), indicating that the BAC DNA was integrated into the host genome in fractions (Figure 1A, Supporting Information Figure S1A,B). We estimated BAC copy number by quantitative PCR in all transgenic lines, as previously described. 28 , 29 , 35 As expected, approximately 50% transgenic and 50% non‐transgenic offspring was produced in our BAC founder animals. Five to 10 copies were found in these humanized transgenic mice (Figure 1B,C), as in most published reports. 28 , 29 , 35 Expression of exogenous gene was measured by reverse‐transcription polymerase chain reaction (RT‐PCR) with the specifically designed primer (Figure 1D). The mRNA transcript was detected in these tissues in all humanized mice.
3.2. The expression of foreign gene in HLA‐A30 Tg mice
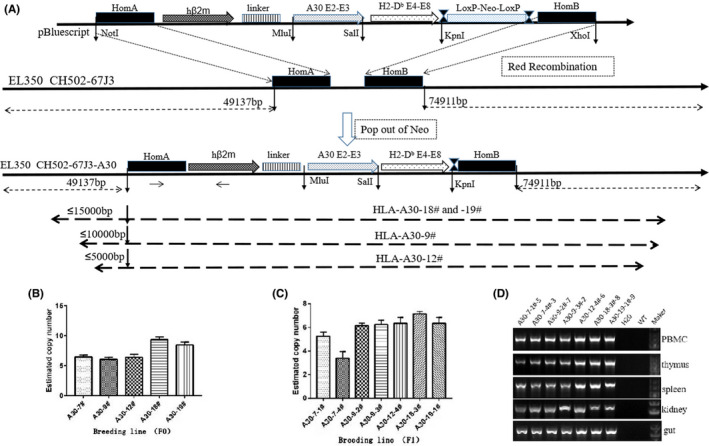
To study the expression of foreign gene in HLA‐A30 Tg mice in detail, the specifically designed primer was used to amplify the whole transcript of exogenous transgene by RT‐PCR (Figure 2A,B). Some amplification fragments extended across the A01 promoter and the hβ2m insertion, while other amplification fragments stretched over the A30 insertion and the mH2Db fragment (Figure 2A,B). Amplification products were further confirmed by DNA sequencing (data not shown). Sequencing results indicated that the full‐length transcript of exogenous chimeric gene was generated in HLA‐A30 Tg mice. Western blot was employed to check the expression of chimeric protein. An ~55 kDa band was found in polyvinylidene fluoride membranes incubated with a monoclonal anti‐hβ2m, indicating the expression of chimeric protein in thymus.
FIGURE 2.
Measurement of HLA‐A30 expression levels in several naive humanized mice lines. The full‐length transcripts of chimeric gene are amplified by RT‐PCR with the specifically designed primer in lung from 7# transgenic lines (A) and 9# transgenic lines (B). (C) Immunoblotting was performed using thymus tissue to measure the expression of the chimeric protein in several humanized mice. A band at ~55 kDa for HLA‐A30 is shown. The annotated tissues were used to investigate the mRNA levels of the HLA‐A30 by qPCR: (D) PBMC, (E) spleen, (F) thymus, (G) kidney, and (H) gut. Data are shown as mean ± SD of 3 individual mice. WT, wild type
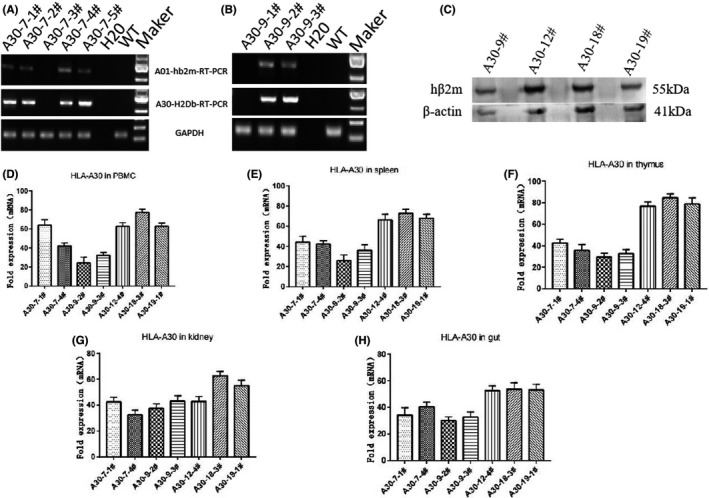
qPCR was further employed to study the tissue‐specific expression of HLA‐A30 chimeric gene (Figure 2D–H). The differential expression of exogenous transgene was found in peripheral blood mononuclear cell (Figure 2D), spleen (Figure 2E), thymus (Figure 2F), kidney (Figure 2G), and gut (Figure 2H) from these transgenic lines. The robust expression of exogenous transgene was observed in various tissues from A30‐18# and A30‐19# lines encompassing the intact flanking sequences (Figure 2D–H). Immunostaining was further employed to study the expression of exogenous transgene. Results showed hβ2m expression in thymus from humanized mice (Figure 3A), but not from WT (Figure 3B). In short, several BAC transgenic mice integrated with HLA‐A gene locus were obtained, and tissue‐specific expression of transgene was detectable in these BAC transgenic mice.
FIGURE 3.
Immunofluorescence staining revealing the expression of hβ2m in HLA‐A30 humanized mice. (A) hβ2m expression in thymus from HLA‐A30‐9#. (B) No hβ2m expression in thymus from WT mice. WT, wild type. Scale bar, 25 μm
3.3. Proportions of immune cells in the lung and spleen of HLA‐A30 Tg mice
To investigate whether the introduction of the large genomic region of HLA‐A01 gene locus and HLA‐A30 chimeric gene affect the immune cell constitution, lymphocytes and monocytes were quantified in splenocytes and lung (Figure 4). In lung, the percentage of CD4+ and CD8+ T cells significantly differed among wild‐type and HLA‐A30 Tg mice (Figure 4A). However, the percentage of CD19+ B cells did not significantly differ among wild‐type and HLA‐A30 Tg mice (Figure 3B). Interestingly, we also observed a higher percentage of CD335+ (NKp46) cell in 18# and 19# HLA‐A30 Tg lines compared with wild‐type mice (Figure 4B). In spleen, we found no significant difference in the percentage of CD4+ T cells (Figure 4C) and CD8+ T cells (Figure 4C). The percentage of CD19+ (Figure 4D) B cells significantly decreased in HLA‐A30 Tg mice compared with wild‐type mice. Interestingly, we also observed a higher percentage of CD335+ (NKp46) cells in 18# HLA‐A30 Tg lines (5.53 ± 0.64%) compared with wild type (3.77 ± 0.49%) (Figure 4D), and a lower percentage of CD335+ (NKp46) cell in 12# HLA‐A30 Tg lines (2.98 ± 0.73%) compared with other transgenic lines (9# 4.55 ± 0.87%, 19# 4.57 ± 0.24%) (Figure 4D). The above results collectively revealed that the introduction of a large genomic region in HLA‐A gene locus can influence the immune cell constitution in humanized mice.
FIGURE 4.
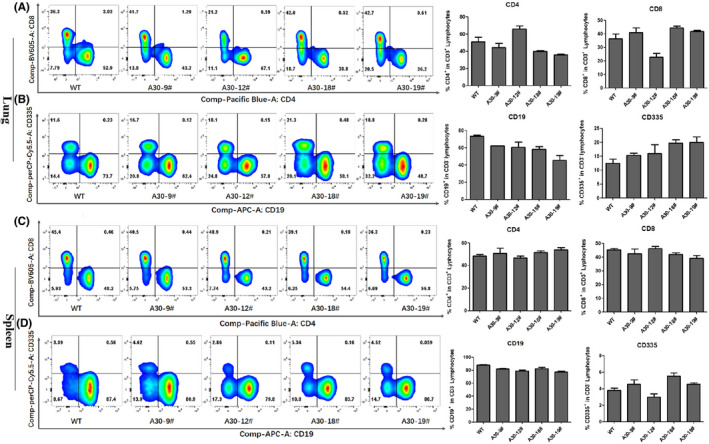
Changes in the ratios of different immune cell subsets analyzed by flow cytometry in lung and spleen from naive HLA‐A30 humanized mice. One representative FACS plot is shown, and the percentages indicate the proportions of CD4+ and CD8+ T cells and CD19+ and CD335+ cells in lung and spleen (n = 4). (A) Percentage of CD4+ and CD8+ T cells in lung. (B) Percentage of CD19+ and CD335+ cells in lung. (C) Percentage of CD4+ and CD8+ T cells in spleen. (D) Percentage of CD19+ and CD335+ cells in spleen. WT, wild type. The data are presented as mean ± SD
3.4. Immune responses in HLA‐A30 humanized Tg mice after pdm09 virus infection
To investigate whether the introduction of a large genomic region in HLA‐A gene locus affects the response to viral infections, 3 HLA‐A30 Tg lines and wild‐type mice were intranasally (i.n.) infected with 9.85 × 10⁶ TCID50 influenza A virus A/Shanghai/37 T/2009(H1N1)(pdm09). Infection of the pdm09 influenza virus did not kill mice, instead only causing transient weight reduction. As shown in Supporting Information Figure S2A, HLA‐A30 Tg mice and C57BL/6 mice lost weight rapidly after pdm09 virus infection, more than 20% of body weight after 7 days infection. The virus titers were also investigated in the lung of these HLA‐A30 Tg mice and wild‐type mice at different times post‐infection. As shown in Supplemental Figure S2B and C, the virus titers were high at 3 dpi, then reduced at 7 dpi in HLA‐A30 Tg humanized mice and wild‐type mice.
Furthermore, we measured the percentage of lymphocytes in lung and spleen after 7 days pdm09 infection. In lung, the percentage of CD4+ and CD8+ T cells did not significantly change among wild‐type and HLA‐A30 Tg mice after infection (Figure 5A). In spleen, we also found no significant difference in the percentage of CD4+ and CD8+ T cells (Figure 5B) among wild‐type and HLA‐A30 Tg mice after pdm09 infection.
FIGURE 5.
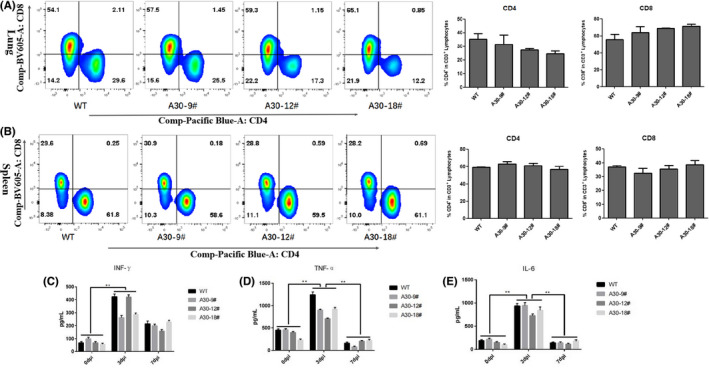
Immune responses in lung and spleen from wild‐type and HLA‐A30 humanized mice at 7 dpi after pdm09 infection. Wild‐type and HLA‐A30 humanized mice were infected intranasally with 9.85 × 10⁶ TCID50 A/Shanghai/37 T/2009(H1N1) (pdm09) virus. One representative FACS plot is shown, and the percentages indicate the proportions of CD4+ and CD8+ T cells in lung (n = 4). (A) Percentage of CD4+ and CD8+ T cells in lung at 7 dpi after pdm09 infection. (B) Percentage of CD4+ and CD8+ T cells in spleen at 7 dpi after pdm09 infection. The pulmonary homogenates were used to measure the levels of inflammatory cytokines by ELISA assay at indicated times after infection (C–E). WT, wild type. Data are shown as mean ± SD of 3 individual mice
The expression level of cytokine was further checked in lung after pdm09 influenza virus infection using ELISA assays. As shown in Figure 5, in lung, at 3 dpi, pdm09 infection led to a significant increase in IFN‐γ (Figure 5C), TNF‐α (Figure 5D), and IL‐6 (Figure 5E). At 7 dpi, TNF‐α and IL‐6 reduced to normal levels, but the IFN‐γ level was still significantly higher compared with that of uninfected mice at 0 dpi. Taken together, these results suggest that pdm09 infection causes a similar immune response among HLA‐A30 Tg humanized mice and wild‐type mice.
3.5. Expression of exogenous HLA‐A30 transgene after pdm09 infection
To investigate whether H1N1 viral infection affects HLA class I expression, we further checked the expression of HLA‐A30 transgene by real‐time PCR. The mRNA level of hβ2m (Figure 6A–F) was significantly increased in lung (Figure 6A), spleen (Figure 6B), and thymus (Figure 6C) from A30‐9# line at 3 dpi. Five‐fold increase of hβ2m expression was also observed in thymus (Figure 6F) from A30‐12# line at 7 dpi.
FIGURE 6.
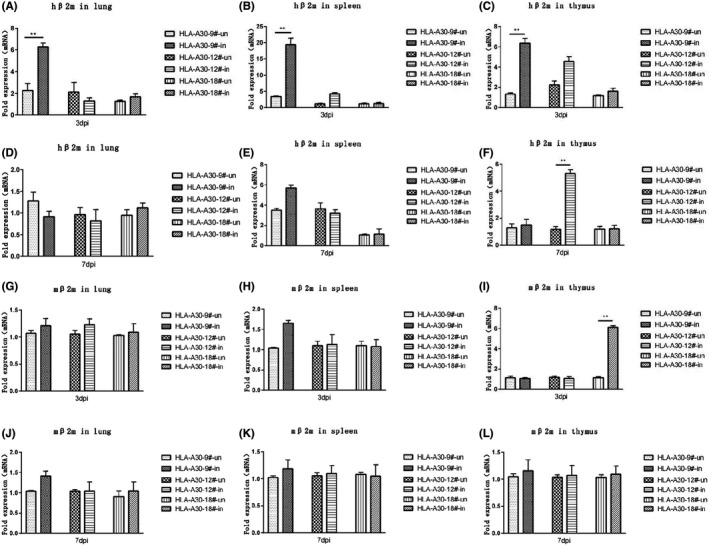
Measurement of hβ2m levels in lung, spleen, and thymus of humanized mice infected with pdm09 virus. HLA‐A30 humanized mice were infected intranasally with 9.85 × 10⁶ TCID50 A/Shanghai/37 T/2009(H1N1) (pdm09) virus. The indicated tissue homogenates were used to measure the expression levels of the hβ2m molecules (A–F) and the mβ2m molecules (G–L) by qPCR at indicated times after infection. WT, wild type. Data are shown as mean ± SD of 3 individual mice. ** p < .01
We further checked the mRNA level of mouse β2m (mβ2m) in HLA‐A30 Tg mice and wild‐type mice (Figure 6G–L). pdm09 infection failed to induce a significant increase of mβ2m expression in lung (Figure 6G,J), spleen (Figure 6H,K), and thymus (Figure 6I,L), with the exception of thymus at 3 dpi. In total, the results indicate that pdm09 infection does not affect expression of mouse mβ2m.
3.6. Pulmonary pathology in HLA‐A30 Tg mice after pdm09 infection
We performed histological analysis of the infected mice at different timepoints to assess lung pathology. In agreement with previous work on 2009 H1N1 viruses, 16 , 36 , 37 the influenza A virus strain A/Shanghai/37T/2009(H1N1) used in this study caused pulmonary pathology including mild‐to‐moderate bronchiolitis and alveolitis in the HLA‐A30 Tg and wild‐type mice. As shown in Figure 7A–E, leukocyte infiltration was clearly seen on 7 dpi. The histology score is shown in Figure 7E, indicating no significant difference among the infected groups of HLA‐A30 Tg and wild‐type mice at 7 dpi.
FIGURE 7.
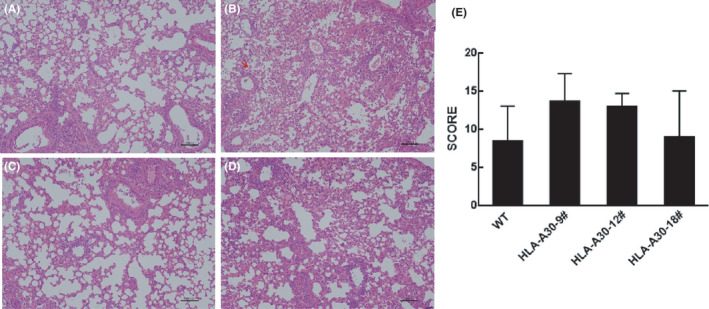
Histopathological examination of lung tissue. (A–D) H&E‐stained slides from HLA‐A30 humanized mice and wild‐type mice infected with 9.85 × 10⁶ TCID50 A/Shanghai/37 T/2009(H1N1) (pdm09) virus and killed at 7 dpi were examined for pathological changes (original magnification ×10; scale bars, 100 μm). (E) The histology scores (see Section 2) for the infected group are shown for day 7 after infection
4. DISCUSSION
Transgenesis technologies enable the development of immunologically humanized mice with an increasing capability to mimic human antigen processing and presentation machinery. Previous study has generated several MHC I transgenic mice, including HLA‐A2, 5 , 15 HLA‐A24, 20 and HLA‐A11 14 humanized mice, which are usually under the control of minimal MHC I promoters (∼500 bases). Moreover, a subpopulation of splenocytes in HLA‐A2Kb mice was deprived of HLA‐A2 expression, 15 indicating that the site of integration may determine the strength and tissue expression of the transgene and impose variegation, and the exogenous HLA class I molecules may not be expressed and regulated similarly to endogenous HLA class I molecules in the current available HLA‐A transgenic mice.
In this study, we generated HLA‐A30‐hβ2m BAC transgenic mice, under the control of HLA‐A01 promoter, and the intact 5′ and 3′ UTR of HLA‐A01 gene was kept in these BAC transgenic mice. The current HLA‐A transgenes are not accurately expressed in the mouse owing to the exclusion of regulatory elements that are essential to reconstruct the native chromatin environment. Theoretically, the inclusion of all regulatory elements in HLA‐A gene locus in this modified BAC transgenic construct would guarantee optimal expression levels in humanized transgenic animals regardless of position of integration. The initial aim of our study was to introduce the HLA‐A gene locus with extensive flanking sequences into the mouse genome and determine whether it could set up an optimal pattern and level of exogenous gene expression. Our analysis of 5 independent lines demonstrated that robust expression of exogenous transgene was detected in various tissues from A30‐18# and A30‐19# lines encompassing the intact flanking sequences. Flow cytometric analysis further demonstrated that the integration of different genomic region can alter the composition of immune cell population in these HLA‐A30 Tg mice.
Previous study has shown that the levels of HLA‐A expression vary considerably, depending on the tissue origin, even in the absence of any pathology upon infection. 38 , 39 , 40 , 41 , 42 , 43 , 44 Previous study with the HLA‐G transgenic mice has shown that a locus control region (LCR) located at least 1.2 kilobases (Kb) upstream of HLA‐G is likely to keep the chromatin in an open state and strengthen HLA‐G expression. 45 A negative regulator is also located at −4 Kb upstream of the HLA‐G, which is overlapped with a fragment of LINE‐1 gene. 46 A single‐nucleotide polymorphism (rs9264942) located 35 Kb upstream of the HLA‐C has shown the most significant association with differences of HLA‐C mRNA levels, which was further directly associated with the magnitude of the cytotoxic CD8+ T‐cell response, indicating that the expression level of HLA‐C gene plays a critical role in regulating virus infection through inducing superior cytotoxic T‐cell activity. 47 , 48 , 49 Our study found that the composition of immune cell population was significantly changed among 5 HLA‐A30 Tg lines and wild‐type mice. The changes were more likely to be caused by the integration of different genomic regions, not by chromosome integration positions. Given that the interaction of numerous trans‐acting factors with cis‐regulatory elements regulates the expression of HLA class I genes, our results collectively indicate that the regulation of HLA‐A30 chimeric genes in our humanized mice is likely to be due to a combination of various interacting factors, varying with the tissue origin. The changes in immune cell population, observed in naive HLA‐A30 Tg humanized mice with different HLA‐A genomic regions, still require further in‐depth investigations.
Highly pathogenic avian influenza viruses (H5N1, H7N9) can result in the dysregulation of cytokines and chemokines and cause serious respiratory diseases in human patients. 50 Increased production of inflammatory cytokines has also been reported in mice infected with the many human 2009 H1N1 viruses compared with a seasonal H1N1 virus. 12 , 16 , 36 , 51 , 52 Currently, there is little information on the proinflammatory response induced by 2009 H1N1 viruses isolated from patients at the early stages of the pandemic. 53 , 54 Our study demonstrated a remarkable elevation of IFN‐γ, TNF‐α, and IL‐6 after pdm09 infection of 3 days. The expression level of TNF‐α and IL‐6 measured by ELISA was drastically decreased 7 days after pdm09 infection, in agreement with previous studies on influenza A virus strain A/California/07/2009 (H1N1v) infection in BALB/c mice. 55 However, substantial differences were not found in mouse cytokine production between HLA‐A30 Tg humanized mice and C57BL/6 mice. The “weaker” cytokine storm may contribute to the lower mortality rates after pdm09 infection in mice. It is no wonder that the 2009 pH1N1 virus was thought to be a less virulent virus than H5N1, as it was shown to induce mild illness in 8%–32% of infected persons. 50 , 53 , 56
We observed altered expression of exogenous hβ2m in humanized mice (HLA‐A30‐9#) after pdm09 infection. A variety of trans‐acting factors interact with cis‐regulatory elements, which can regulate the expression of HLA class I genes. Thus, the regulation of hβ2m gene expression in our humanized mice is likely to be due to a combination of various interacting factors, varying with tissue origin, and the exposure to viruses or secondary (inflammation, cytokines) pathogenic stimuli. The change of hβ2m gene expression, observed in HLA‐A30 Tg humanized mice with different HLA‐A genomic regions after pdm09 infection, still requires further in‐depth investigations.
In conclusion, we generated several HLA‐A30 humanized transgenic mice with modified BAC clone, which contained the recombinant gene encoding a human β2m‐HLA‐A30 (α1α2)‐H‐2Db (α3 transmembrane cytoplasmic) (HHD) monochain. Furthermore, immune response was also observed in these humanized mice after influenza A virus strain A/Shanghai/37 T/2009(H1N1) (pdm09) infection. Our results showed an increasing percentage of peripheral CD4+ T and CD8+ T cells, production of inflammatory cytokines, and occurrence of pathology in the lung (Figures 5 and 7, and Supporting Information Figure S2). However, viral‐epitope‐based specific T‐cell responses were not examined in this manuscript. Indeed, it is very arduous to evaluate human specific T‐cell response to a specific viral epitope, especially in the background of an HLA haplotype that is not well studied. To further study the HLA‐A30 restricted T‐cell response, improvements to our HLA‐A30 Tg humanized mice are being developed, such as expressing HLA‐A30 molecule on an H‐2 class I deficient background and introducing some human genes coding for key proteins of the antigen processing machinery (proteasome subunits and TAP pumps). Establishing the humanized mouse model presented in this study can contribute to a more fundamental understanding of the immunology of emerging infective diseases and the human specific T‐cell immune response.
CONFLICT OF INTEREST
The authors declare that they have no conflicts of interest relevant to this work. We declare that we do not have any commercial or associative interest that represents a conflict of interest in connection with the work submitted.
Xiao‐hui Zhou is an Editorial Board member of AMEM and a co‐author of this article. To minimize bias, he was excluded from all editorial decision‐making related to the acceptance of this article for publication.
AUTHOR CONTRIBUTIONS
Feng Li and Xiao‐hui Zhou conceived and designed the study; Mengmin Zhu constructed the transgenic vector, and performed qPCR and ELISA for cytokine analysis; Bowen Niu completed the microinjection and flow cytometry analysis; Lingling Liu performed immunostaining, histopathology, and western blotting; Hua Yang and Boyin Qing took part in virus infection and sample collection; Xiuhua Peng, Lixiang Chen, and Chun‐hua Xu took part in the transgenic animal breeding; Yang Liu, Chao Wang, and Xiao‐nan Ren completed the virus production and took part in flow cytometry analysis; Mengmin Zhu, Bowen Niu, and Lingling Liu plotted the figures; Feng Li and Xiao‐hui Zhou drafted the manuscript; all authors reviewed and/or edited the paper.
Supporting information
Supplemental Figure S1
Supplemental Figure S2
Supplemental Table S1
ACKNOWLEDGMENTS
We thank Zhigang Song (Shanghai Public Health Clinical Center, Shanghai, China), Di Tian, Xiaonan Zhang et al. for their isolation of influenza A virus strain A/Shanghai/37 T/2009 (H1N1) (pdm09), and Dan Tan (Shanghai Medical College, Fudan University, China) for providing essential help in the preparation of pdm09 virus.
Zhu M‐m, Niu B‐w, Liu L‐l, et al. Development of a humanized HLA‐A30 transgenic mouse model. Anim Models Exp Med. 2022;5:350‐361. doi: 10.1002/ame2.12225
Meng‐min Zhu, Bo‐wen Niu, and Ling‐ling Liu contributed equally to this work.
Funding informationThis work is supported by the followed funds: National Science and Technology Major Project (2017ZX10304402‐001‐006, 2017ZX10304402‐001‐012, 2016YFD0500208); Shanghai Science and Technology Commission “R & D public service platform and institutional capacity improvement project” (21DZ2291300); Shanghai scientific research projects (19140905300), Shanghai Public Health Clinical Center projects (KY‐GW‐2019‐11, KY‐GW‐2019‐19, and KY‐GW‐2021‐39)
Contributor Information
Xiao‐hui Zhou, Email: zhouxiaohui@fudan.edu.cn.
Feng Li, Email: lifeng30286@shphc.org.cn.
REFERENCES
- 1. Cresswell P, Ackerman AL, Giodini A, Peaper DR, Wearsch PA. Mechanisms of MHC class I‐restricted antigen processing and cross‐presentation. Immunol Rev. 2005;207:145‐157. [DOI] [PubMed] [Google Scholar]
- 2. Kelly A, Trowsdale J. Genetics of antigen processing and presentation. Immunogenetics. 2019;71(3):161‐170. [DOI] [PMC free article] [PubMed] [Google Scholar]
- 3. Viret C, Janeway CA Jr. MHC and T cell development. Rev Immunogenet. 1999;1(1):91‐104. [PubMed] [Google Scholar]
- 4. Boucherma R, Kridane‐Miledi H, Bouziat R, et al. HLA‐A*01:03, HLA‐A*24:02, HLA‐B*08:01, HLA‐B*27:05, HLA‐B*35:01, HLA‐B*44:02, and HLA‐C*07:01 monochain transgenic/H‐2 class I null mice: novel versatile preclinical models of human T cell responses. J Immunol. 2013;191(2):583‐593. [DOI] [PMC free article] [PubMed] [Google Scholar]
- 5. Ru Z, Xiao W, Pajot A, et al. Development of a humanized HLA‐A2.1/DP4 transgenic mouse model and the use of this model to map HLA‐DP4‐restricted epitopes of HBV envelope protein. PLoS One. 2012;7(3):e32247. [DOI] [PMC free article] [PubMed] [Google Scholar]
- 6. Pascolo S. HLA class I transgenic mice: development, utilisation and improvement. Expert Opin Biol Ther. 2005;5(7):919‐938. [DOI] [PubMed] [Google Scholar]
- 7. Bill JR, Mack DG, Falta MT, et al. Beryllium presentation to CD4+ T cells is dependent on a single amino acid residue of the MHC class II beta‐chain. J Immunol. 2005;175(10):7029‐7037. [DOI] [PubMed] [Google Scholar]
- 8. Matzaraki V, Kumar V, Wijmenga C, Zhernakova A. The MHC locus and genetic susceptibility to autoimmune and infectious diseases. Genome Biol. 2017;18(1):76. [DOI] [PMC free article] [PubMed] [Google Scholar]
- 9. Taneja V, David CS. Role of HLA class II genes in susceptibility/resistance to inflammatory arthritis: studies with humanized mice. Immunol Rev. 2010;233(1):62‐78. [DOI] [PubMed] [Google Scholar]
- 10. Valkenburg SA, Josephs TM, Clemens EB, et al. Molecular basis for universal HLA‐A*0201‐restricted CD8+ T‐cell immunity against influenza viruses. Proc Natl Acad Sci U S A. 2016;113(16):4440‐4445. [DOI] [PMC free article] [PubMed] [Google Scholar]
- 11. Terajima M, Jameson J, Norman JE, Cruz J, Ennis FA. High‐yield reassortant influenza vaccine production virus has a mutation at an HLA‐A 2.1‐restricted CD8+ CTL epitope on the NS1 protein. Virology. 1999;259(1):135‐140. [DOI] [PubMed] [Google Scholar]
- 12. Zhou K, Wang J, Li A, et al. Swift and strong NK cell responses protect 129 mice against high‐dose influenza virus infection. J Immunol. 2016;196(4):1842‐1854. [DOI] [PubMed] [Google Scholar]
- 13. Mage MG, Lee L, Ribaudo RK, et al. A recombinant, soluble, single‐chain class I major histocompatibility complex molecule with biological activity. Proc Natl Acad Sci U S A. 1992;89(22):10658‐10662. [DOI] [PMC free article] [PubMed] [Google Scholar]
- 14. Zeng Y, Gao T, Zhao G, et al. Generation of human MHC (HLA‐A11/DR1) transgenic mice for vaccine evaluation. Hum Vaccin Immunother. 2016;12(3):829‐836. [DOI] [PMC free article] [PubMed] [Google Scholar]
- 15. Pajot A, Michel ML, Fazilleau N, et al. A mouse model of human adaptive immune functions: HLA‐A2.1‐/HLA‐DR1‐transgenic H‐2 class I−/class II‐knockout mice. Eur J Immunol. 2004;34(11):3060‐3069. [DOI] [PubMed] [Google Scholar]
- 16. Meunier I, Embury‐Hyatt C, Stebner S, et al. Virulence differences of closely related pandemic 2009 H1N1 isolates correlate with increased inflammatory responses in ferrets. Virology. 2012;422(1):125‐131. [DOI] [PubMed] [Google Scholar]
- 17. Dawkins R, Leelayuwat C, Gaudieri S, et al. Genomics of the major histocompatibility complex: haplotypes, duplication, retroviruses and disease. Immunol Rev. 1999;167:275‐304. [DOI] [PubMed] [Google Scholar]
- 18. Gianfrani C, Pisapia L, Picascia S, Strazzullo M, del Pozzo G. Expression level of risk genes of MHC class II is a susceptibility factor for autoimmunity: new insights. J Autoimmun. 2018;89:1‐10. [DOI] [PubMed] [Google Scholar]
- 19. Krawczyk M, Peyraud N, Rybtsova N, et al. Long distance control of MHC class II expression by multiple distal enhancers regulated by regulatory factor X complex and CIITA. J Immunol. 2004;173(10):6200‐6210. [DOI] [PubMed] [Google Scholar]
- 20. Gotoh M, Takasu H, Harada K, Yamaoka T. Development of HLA‐A2402/K(b) transgenic mice. Int J Cancer. 2002;100(5):565‐570. [DOI] [PubMed] [Google Scholar]
- 21. Epstein H, Hardy R, May JS, Johnson MH, Holmes N. Expression and function of HLA‐A2.1 in transgenic mice. Eur J Immunol. 1989;19(9):1575‐1583. [DOI] [PubMed] [Google Scholar]
- 22. Wu QJ, Liu ML, Qi J, Liu S, Zhang Y, Wei XQ. Gene and haplotype frequencies for the loci HLA‐A, B and DRB1 in 11755 north Chinese Han bone marrow registry donors. Zhongguo Shi Yan Xue Ye Xue Za Zhi. 2007;15(2):357‐363. [PubMed] [Google Scholar]
- 23. Pan Q, Fan S, Wang X, et al. The distribution of HLA‐A, ‐B, and ‐DRB1 alleles and haplotypes in inhabitants of Guizhou Province of China. J Biomed Res. 2011;25(5):328‐334. [DOI] [PMC free article] [PubMed] [Google Scholar]
- 24. Li XF, Zhang X, Chen Y, Zhang KL, Liu XJ, Li JP. An analysis of HLA‐A, ‐B, and ‐DRB1 allele and haplotype frequencies of 21,918 residents living in Liaoning, China. PLoS One. 2014;9(4):e93082. [DOI] [PMC free article] [PubMed] [Google Scholar]
- 25. Lee EC, Yu D, Martinez de Velasco J, et al. A highly efficient Escherichia coli‐based chromosome engineering system adapted for recombinogenic targeting and subcloning of BAC DNA. Genomics. 2001;73(1):56‐65. [DOI] [PubMed] [Google Scholar]
- 26. Li F, Cao J, Zhou M. NTPDase2+ cells generate lingual epithelia and papillae. Front Genet. 2012;3:255. [DOI] [PMC free article] [PubMed] [Google Scholar]
- 27. Li F, Zhou M. Depletion of bitter taste transduction leads to massive spermatid loss in transgenic mice. Mol Hum Reprod. 2012;18:289‐297. [DOI] [PMC free article] [PubMed] [Google Scholar]
- 28. Li F, Zhu MM, Niu BW, et al. Generation and expression analysis of BAC humanized mice carrying HLA‐DP401 haplotype. Anim Model Exp Med. 2021;4(2):116‐128. [DOI] [PMC free article] [PubMed] [Google Scholar]
- 29. Chandler KJ, Chandler RL, Broeckelmann EM, Hou Y, Southard‐Smith EM, Mortlock DP. Relevance of BAC transgene copy number in mice: transgene copy number variation across multiple transgenic lines and correlations with transgene integrity and expression. Mamm Genome. 2007;18(10):693‐708. [DOI] [PMC free article] [PubMed] [Google Scholar]
- 30. Livak KJ, Schmittgen TD. Analysis of relative gene expression data using real‐time quantitative PCR and the 2−ΔΔCT method. Methods. 2001;25(4):402‐408. 10.1006/meth.2001.1262 [DOI] [PubMed] [Google Scholar]
- 31. Tian D, Zhang W, He J, et al. Novel, real‐time cell analysis for measuring viral cytopathogenesis and the efficacy of neutralizing antibodies to the 2009 influenza a (H1N1) virus. PLoS One. 2012;7(2):e31965. [DOI] [PMC free article] [PubMed] [Google Scholar]
- 32. Cimolai N, Taylor GP, Mah D, Morrison BJ. Definition and application of a histopathological scoring scheme for an animal model of acute mycoplasma pneumoniae pulmonary infection. Microbiol Immunol. 1992;36(5):465‐478. [DOI] [PubMed] [Google Scholar]
- 33. Casalino‐Matsuda SM, Chen F, Gonzalez‐Gonzalez FJ, et al. Hypercapnia suppresses macrophage antiviral activity and increases mortality of influenza a infection via Akt1. J Immunol. 2020;205(2):489‐501. [DOI] [PMC free article] [PubMed] [Google Scholar]
- 34. Alsuwaidi AR, George JA, Almarzooqi S, Hartwig SM, Varga SM, Souid AK. Sirolimus alters lung pathology and viral load following influenza a virus infection. Respir Res. 2017;18(1):136. [DOI] [PMC free article] [PubMed] [Google Scholar]
- 35. Deal KK, Cantrell VA, Chandler RL, Saunders TL, Mortlock DP, Southard‐Smith EM. Distant regulatory elements in a Sox10‐beta GEO BAC transgene are required for expression of Sox10 in the enteric nervous system and other neural crest‐derived tissues. Dev Dyn. 2006;235(5):1413‐1432. [DOI] [PubMed] [Google Scholar]
- 36. Maines TR, Jayaraman A, Belser JA, et al. Transmission and pathogenesis of swine‐origin 2009 a(H1N1) influenza viruses in ferrets and mice. Science. 2009;325(5939):484‐487. [DOI] [PMC free article] [PubMed] [Google Scholar]
- 37. Itoh Y, Shinya K, Kiso M, et al. In vitro and in vivo characterization of new swine‐origin H1N1 influenza viruses. Nature. 2009;460(7258):1021‐1025. [DOI] [PMC free article] [PubMed] [Google Scholar]
- 38. Zhang A, Yu H, Shen Y, et al. The expression patterns of MHC class I molecules in the developmental human visual system. Neurochem Res. 2013;38(2):273‐281. [DOI] [PubMed] [Google Scholar]
- 39. Lv D, Shi Q, Liu J, et al. The similar expression pattern of MHC class I molecules in human and mouse cerebellar cortex. Neurochem Res. 2014;39(1):180‐186. [DOI] [PubMed] [Google Scholar]
- 40. Zhang A, Yu H, He Y, et al. The spatio‐temporal expression of MHC class I molecules during human hippocampal formation development. Brain Res. 2013;1529:26‐38. [DOI] [PubMed] [Google Scholar]
- 41. Blaschitz A, Hutter H, Dohr G. HLA class I protein expression in the human placenta. Early Pregnancy. 2001;5(1):67‐69. [PubMed] [Google Scholar]
- 42. Le Blanc K, Tammik C, Rosendahl K, Zetterberg E, Ringdén O. HLA expression and immunologic properties of differentiated and undifferentiated mesenchymal stem cells. Exp Hematol. 2003;31(10):890‐896. [DOI] [PubMed] [Google Scholar]
- 43. Fernandez N, Cooper J, Sprinks M, et al. A critical review of the role of the major histocompatibility complex in fertilization, preimplantation development and feto‐maternal interactions. Hum Reprod Update. 1999;5(3):234‐248. [DOI] [PubMed] [Google Scholar]
- 44. Fiszer D, Kurpisz M. Major histocompatibility complex expression on human, male germ cells: a review. Am J Reprod Immunol. 1998;40(3):172‐176. [DOI] [PubMed] [Google Scholar]
- 45. Schmidt CM, Ehlenfeldt RG, Athanasiou MC, et al. Extraembryonic expression of the human MHC class I gene HLA‐G in transgenic mice. Evidence for a positive regulatory region located 1 kilobase 5′ to the start site of transcription. J Immunol. 1993;151(5):2633‐2645. [PubMed] [Google Scholar]
- 46. Ikeno M, Suzuki N, Kamiya M, Takahashi Y, Kudoh J, Okazaki T. LINE1 family member is negative regulator of HLA‐G expression. Nucleic Acids Res. 2012;40(21):10742‐10752. [DOI] [PMC free article] [PubMed] [Google Scholar]
- 47. Petersdorf EW, Gooley TA, Malkki M, et al. HLA‐C expression levels define permissible mismatches in hematopoietic cell transplantation. Blood. 2014;124(26):3996‐4003. [DOI] [PMC free article] [PubMed] [Google Scholar]
- 48. Sips M, Liu Q, Draghi M, et al. HLA‐C levels impact natural killer cell subset distribution and function. Hum Immunol. 2016;77(12):1147‐1153. [DOI] [PMC free article] [PubMed] [Google Scholar]
- 49. Apps R, Qi Y, Carlson JM, et al. Influence of HLA‐C expression level on HIV control. Science. 2013;340(6128):87‐91. 10.1126/science.1232685 [DOI] [PMC free article] [PubMed] [Google Scholar]
- 50. Subbarao K, Klimov A, Katz J, et al. Characterization of an avian influenza a (H5N1) virus isolated from a child with a fatal respiratory illness. Science. 1998;279(5349):393‐396. [DOI] [PubMed] [Google Scholar]
- 51. Belser JA, Wadford DA, Pappas C, et al. Pathogenesis of pandemic influenza a (H1N1) and triple‐reassortant swine influenza a (H1) viruses in mice. J Virol. 2010;84(9):4194‐4203. [DOI] [PMC free article] [PubMed] [Google Scholar]
- 52. Munster VJ, de Wit E, van den Brand JMA, et al. Pathogenesis and transmission of swine‐origin 2009 a(H1N1) influenza virus in ferrets. Science. 2009;325(5939):481‐483. [DOI] [PMC free article] [PubMed] [Google Scholar]
- 53. Gao R, Bhatnagar J, Blau DM, et al. Cytokine and chemokine profiles in lung tissues from fatal cases of 2009 pandemic influenza a (H1N1): role of the host immune response in pathogenesis. Am J Pathol. 2013;183(4):1258‐1268. [DOI] [PMC free article] [PubMed] [Google Scholar]
- 54. Cao B, Li XW, Mao Y, et al. Clinical features of the initial cases of 2009 pandemic influenza a (H1N1) virus infection in China. N Engl J Med. 2009;361(26):2507‐2517. [DOI] [PubMed] [Google Scholar]
- 55. Liu B, Zhang X, Deng W, et al. Severe influenza a(H1N1)pdm09 infection induces thymic atrophy through activating innate CD8(+)CD44(hi) T cells by upregulating IFN‐gamma. Cell Death Dis. 2014;5:e1440. [DOI] [PMC free article] [PubMed] [Google Scholar]
- 56. Chowell G, Bertozzi SM, Colchero MA, et al. Severe respiratory disease concurrent with the circulation of H1N1 influenza. N Engl J Med. 2009;361(7):674‐679. [DOI] [PubMed] [Google Scholar]
Associated Data
This section collects any data citations, data availability statements, or supplementary materials included in this article.
Supplementary Materials
Supplemental Figure S1
Supplemental Figure S2
Supplemental Table S1