Abstract
Recently, the Ramprasad group reported a quantitative structure–property relationship (QSPR) model for predicting the Egap values of 4209 polymers, which yielded a test set R2 score of 0.90 and a test set root-mean-square error (RMSE) score of 0.44 at a train/test split ratio of 80/20. In this paper, we present a new QSPR model named LGB-Stack, which performs a two-level stacked generalization using the light gradient boosting machine. At level 1, multiple weak models are trained, and at level 2, they are combined into a strong final model. Four molecular fingerprints were generated from the simplified molecular input line entry system notations of the polymers. They were trimmed using recursive feature elimination and used as the initial input features for training the weak models. The output predictions of the weak models were used as the new input features for training the final model, which completes the LGB-Stack model training process. Our results show that the best test set R2 and the RMSE scores of LGB-Stack at the train/test split ratio of 80/20 were 0.92 and 0.41, respectively. The accuracy scores further improved to 0.94 and 0.34, respectively, when the train/test split ratio of 95/5 was used.
1. Introduction
1.1. Bandgap and Polymers
Bandgap (Egap) is a highly important electrical property, which plays a crucial role in the rational design of functional materials.1Egap is defined as the energy difference between the highest occupied molecular orbital (HOMO) and the lowest unoccupied molecular orbital (LUMO).2 The idea is that mobile electrons are essential for electrical conductivity, and a smaller Egap allows the electrons to transit more easily between the HOMO and LUMO.3Figure 1 illustrates the differences in Egap of conductors, semiconductors, and insulators. Materials with Egap approaching or equal to 0 eV are conductors, while those with Egap between 1.5 and 3.0 eV are semiconductors. Materials with Egap above 4.0 eV are insulators.4,5
Figure 1.
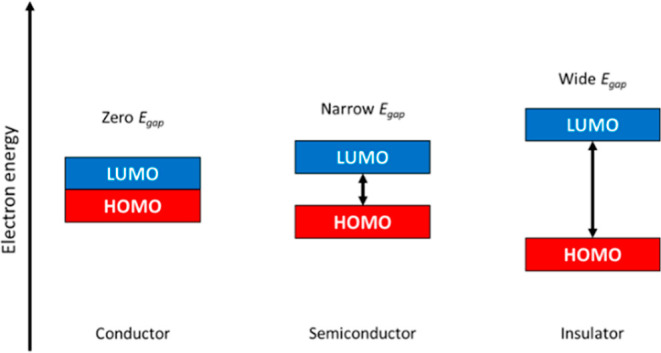
Different Egap of conductors, semiconductors, and insulators.
In recent decades, polymers are becoming increasingly significant in materials science,6,7 and their applications have grown exponentially.8−10 Polymers can either insulative or conductive. Examples of polymeric insulators are polyethylene and polypropylene, which are widely used in electrical insulations, packaging, household items, and automotive parts. They are highly valued for their chemical resistance, rigidity, stiffness, and thermal stability.11 Examples of polymeric conductors and semiconductors are polyacetylene and its derivatives, which are used for modeling mechanisms of electrical conduction for conjugated organic polymers. Conductive polymers are appealing for simultaneously exhibiting the electrical and optical properties of metals or semiconductors and retaining the mechanical properties and processing advantages of regular polymers.12−16
1.2. Machine Learning and Polymers
Machine learning has grown significantly over the recent years, and its ability to process and learn massive amounts of data has been demonstrated across various fields.17,18 The standard approach for discovering new materials involve potentially dangerous experiments in laboratories and also lengthy computations that are performed for one molecule at a time. Furthermore, the chemical space of synthetic materials is still far from being fully covered and there are still many new materials to be discovered. Hence, there is a growing interest in using machine learning to map suitable representations of materials to their physical properties with known experimental data to facilitate discovery, which can save substantial time and cost.19,20
One important machine learning technique is supervised learning, which learns from the inputs and outputs in a train dataset in order to make predictions on a test dataset.21 In computational chemistry, supervised learning manifests itself in the form of the quantitative structure–property relationship (QSPR) modeling. A QSPR model quantifies and relates the determining factors for a particular measured property with molecular features of a given system of chemical compounds. QSPR is essentially a mathematical model that connects experimental property values with a set of features derived from the molecular structures.22 As a result, machine learning has been applied to the design and prediction of the structure of many polymers and their properties.23 As an example of polymer design using machine learning, Wu et al. (2019) trained a molecular design algorithm that can recognize the relationship between thermal conductivity and other target properties to identify thousands of hypothetical polymers, out of which three were comparable to those of the state-of-the-art polymers in non-composite thermoplastics.19 As an example of prediction of polymer properties, an online platform named Polymer Genome was developed by the Ramprasad group, which hosts their own machine learning models for rapid and accurate predictions of polymer properties.24 Those models are trained on carefully curated database of polymers with properties obtained from first-principles computations and experimental measurements.25
2. Aims and Objectives
Over the years, many studies had been conducted regarding the prediction of Egap values of various materials using machine learning methods.26−28 Recently, the Ramprasad group (Kamal et al., 2021) reported a highly accurate QSPR model for predicting the Egap of polymers using the Gaussian process algorithm.29 In this paper, this model will be referred to as the Ramprasad model, and its results will be set as the benchmark. Based on this foundation, the aim was to develop an alternative QSPR model that surpasses the accuracy of the Ramprasad model. Our results were directly compared with the benchmark as presented in the benchmark paper without any reimplementation of the Ramprasad model.
3. Methodology
3.1. Dataset
The dataset in this project contains 4209 polymers, which was the same as that used in the benchmark paper.29 The authors shared the dataset publicly through the KHAZANA data repository.30 Each data point includes the Egap values, where, according to the authors, the range of values cover the expected range for polymeric materials. Also, there is reportedly a decent level of diversity in terms of the property range and chemistry of the polymers.29 The distribution of Egap values of the 4209 polymers is shown in Figure 2. Each polymer is also represented by a simplified molecular input line entry system (SMILES) string, in which atoms are represented by the chemical symbols of the elements; single bonds and bonded hydrogens are implied without the use of any symbols; double bonds and triple bonds are represented by “=” and “#”, respectively; branching is denoted by a substring in parentheses; cyclic structures are represented by an enclosure within two chemical symbols tagged with the same number; and aromatic structures are similar to cyclic structures except the chemical symbols are in lowercase.31
Figure 2.
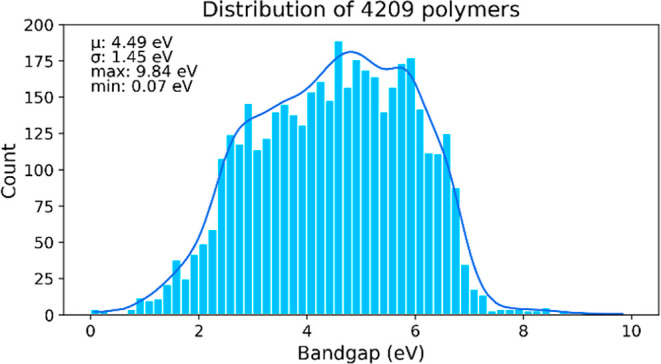
Distribution of Egap values of the 4209 polymers.
3.2. Featurization
In order for the ML algorithms to process the polymer structures, the polymers had to be represented in numerical or categorical formats, which are machine-readable. This process is known as featurization. In this project, molecular fingerprints were calculated based on the molecular objects of the polymers. Molecular fingerprints are high-dimensional vectors populated with bits or integers, which are derived from the transformations of the corresponding molecular graphs.32,33 Most of the pre-processing and the featurization of polymer molecular structures were achieved using the RDKit cheminformatics software.34
First, the SMILES strings were converted into 2D molecular objects. Second, four 2D molecular fingerprints were calculated, namely, Avalon fingerprint (A-FP) and Avalon count fingerprint (AC-FP),35,36 layered fingerprint (L-FP), and RDKit fingerprint (R-FP).37,38 A-FP and R-FP are two different types of bit vector substructure fingerprints based on hashing molecular subgraphs, which are influenced by the types of atoms and bonds present in the molecule. AC-FP is the count vector version of A-FP. L-FP is a variant of R-FP that uses a set of pre-defined generic substructure patterns. A-FP, L-FP, and R-FP are bit vector fingerprints that record the presence of a structural feature. The calculated features in a bit vector fingerprint are a series of binary bits, indicating the absence and presence of substructures within the molecule. On the other hand, a count vector fingerprint that records the number of times the same structural feature appears. The calculated features in a count vector fingerprint are a collection of integers, indicating the frequency of the presence of substructures within the molecule. These four were chosen because they were reported to yield reliable accuracy.33,35−38
The number of features in these fingerprints can be customized, and the most common settings in RDKit are in multiples of 256 bits (i.e., 512, 1024, 2048, and 4096).34 In the benchmark paper, recursive feature elimination (RFE) was performed, and the number of features was reduced from 800 to 600. RFE is a backward feature elimination algorithm that relies on feature importance ranking.39 RFE was reported to be a very popular and highly effective algorithm for feature reduction in numerous studies, which was employed in the pipelines of many highly accurate prediction models.40−44 In this project, the four fingerprints were customized to 4096 bits each to capture as many relevant features as possible and were labeled group (A) fingerprints. These 4096-bit fingerprints were subsequently reduced to 256 and 512 bits using RFE with the help of the scikit-learn(45) package and were labeled groups (B) and (C) fingerprints, respectively.
3.3. Model Training
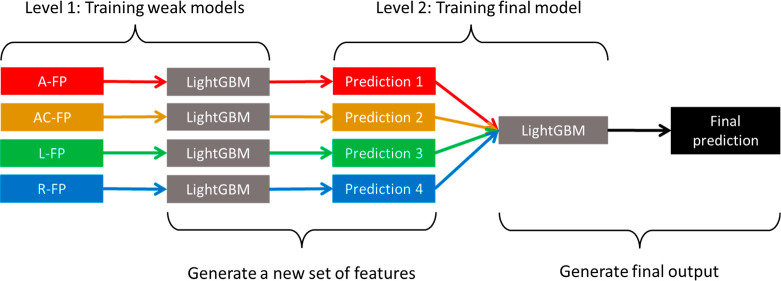
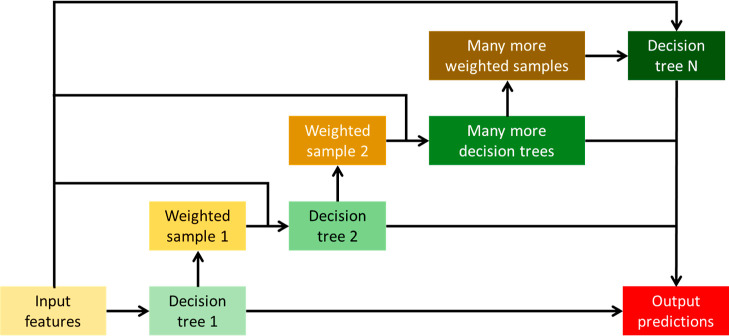
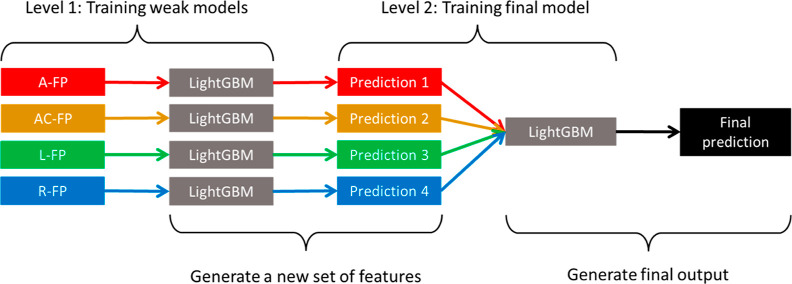
Two ensemble algorithms were involved in the model training process. Ensemble algorithms construct multiple weak models with relatively low accuracies and poorer generalizations and subsequently combine their individual strengths to create a single stronger model with higher accuracy and much better generalization.46 The first ensemble algorithm was LightGBM (light gradient boosting machine), which is a type of gradient boosting machine (GBM). GBM works by consecutively fitting new decision trees to provide a more accurate estimate of the outputs.47 A general outline of a GBM is illustrated in Figure 3. LightGBM was chosen because it was reported to have extremely high scalability and fast computation, outperforming most GBMs.48 It was also reported that LightGBM can achieve high prediction accuracies.49,50 The second ensemble algorithm was stacked generalization. At the first level, multiple weak models are trained by fitting a few base learners on the original training data. These weak models will each compute a set of output predictions, which are later concatenated to form a new set of input features. At the second level, a final model is trained by fitting a final estimator on the new input features, which will yield the final predictions.51 Here, a stacked generalization model was developed using LightGBM as both the base learner and the final estimator. This model was named LGB-Stack, and its architecture can be visualized using Figure 4.
Figure 3.
General outline of a gradient boosting machine.
Figure 4.
Outline of LGB-Stack, a stacked generalization model.
For the model training, the dataset was split into the train and test sets. In the preliminary evaluation at LGB-Stack level 1, the group (A) fingerprints were compared against the groups (B) and (C) fingerprints. The train/test split ratio was set to 80/20 because the authors of the benchmark paper deemed that this ratio produced the best results.29 As for the final evaluation at LGB-Stack level 2, the same range of train/test split ratios as the benchmark was investigated, which were 10/90, 20/80, 30/70, 40/60, 50/50, 60/40, 70/30, 80/20, and 90/10.29 During the model training, there is a possibility of overfitting, whereby a model fits accurately on the train data but performs very poor predictions on the test data.52 In the benchmark paper, k-fold cross-validation (CV) was used for the minimization of overfitting.29 However, it was reported that Monte Carlo CV (MCCV) produces more accurate results than k-fold CV.53,54 Hence, MCCV was the choice of CV in this paper. Following the benchmark, each model had 50 pseudo-random instances of CV.29 Using the scikit-learn package, the train/test splits were performed and the trained models were evaluated for their accuracies.45 To ensure consistency, the random state within one full LGB-Stack training instance was set to the same number throughout the training process, from 0 to 49. This means that the four-weak models at level 1 would share the same random state as the final model at the level 2.
The scikit-learn package was also used for computing the scoring metrics of model accuracy.45 The scoring metrics chosen were R2 (coefficient of determination) and root-mean-square error (RMSE). R2 explains the amount of variance accounted for in the relationship between two variables, with values between 0 and 1. When R2 = 1, the model accounts for all the variance. When R2 = 0, no variance is accounted for. Hence, the performance of a model improves as its R2 approaches 1.55 On the other hand, RMSE is an indicator of the fit between the predictions and the actual values. The RMSE scores range between 0 and ∞ and follow the unit of measurements of the properties being predicted. A model with a smaller RMSE score has a greater accuracy.56
4. Results and Discussion
4.1. LGB-Stack Level 1
With reference to “level 1” in the outline of LGB-Stack in Figure 4, the weak models trained at the first level of LGB-Stack were evaluated. Table 1 shows the best accuracy scores of the preliminary weak models training at train/test split ratios 80/20. Comparisons were made between the Ramprasad model and those trained on the (A), (B), and (C) fingerprints. More detailed tables containing the best and mean accuracy scores for the 50 runs for each of the weak models can be found in part A of the Supporting Information, where the values are expressed to four decimal places.
Table 1. Best Accuracy Scores for the Weak Models Compared with the Ramprasad Model at Train/Test Split Ratio 80/20.
|
R2 |
RMSE
(eV) |
||||
|---|---|---|---|---|---|
| model | train | test | train | test | number of bits |
| Ramprasad29 | 0.96 | 0.90 | 0.28 | 0.44 | 600 |
| A-FP (A) | 0.94 | 0.90 | 0.35 | 0.46 | 4096 |
| AC-FP (A) | 0.95 | 0.90 | 0.33 | 0.45 | |
| L-FP (A) | 0.96 | 0.91 | 0.29 | 0.44 | |
| R-FP (A) | 0.97 | 0.90 | 0.27 | 0.45 | |
| A-FP (B) | 0.94 | 0.90 | 0.36 | 0.45 | 256 |
| AC-FP (B) | 0.95 | 0.90 | 0.33 | 0.45 | |
| L-FP (C) | 0.96 | 0.91 | 0.30 | 0.42 | 512 |
| R-FP (C) | 0.96 | 0.91 | 0.28 | 0.43 | |
From Table 1, it is shown that the accuracy scores for the weak models trained on the fingerprints in groups (B) and (C) are similar to their counterparts in group (A). These results suggest that there was no serious overfitting when using the 4096-bit group (A) fingerprints, given the similarity of the accuracy scores and the similarity in the differences between the train and test accuracy scores. Moreover, the results also show that majority of the features in 4096 bits are redundant and can be removed to allow shorter computation time. This also means that RFE is effective at selecting the important features to retain out of the 4096 bits.
In this preliminary evaluation, it was found that the A-FP and AC-FP of group (B) performed slightly better than those of group (C). On the contrary, for L-FP and R-FP, it was group (C) that surpassed their counterparts in group (B). Hence, A-FP and AC-FP of group (B), together with L-FP and R-FP of group (C), were selected for the full LGB-Stack model training due to their relatively better accuracy scores.
4.2. LGB-Stack Level 2
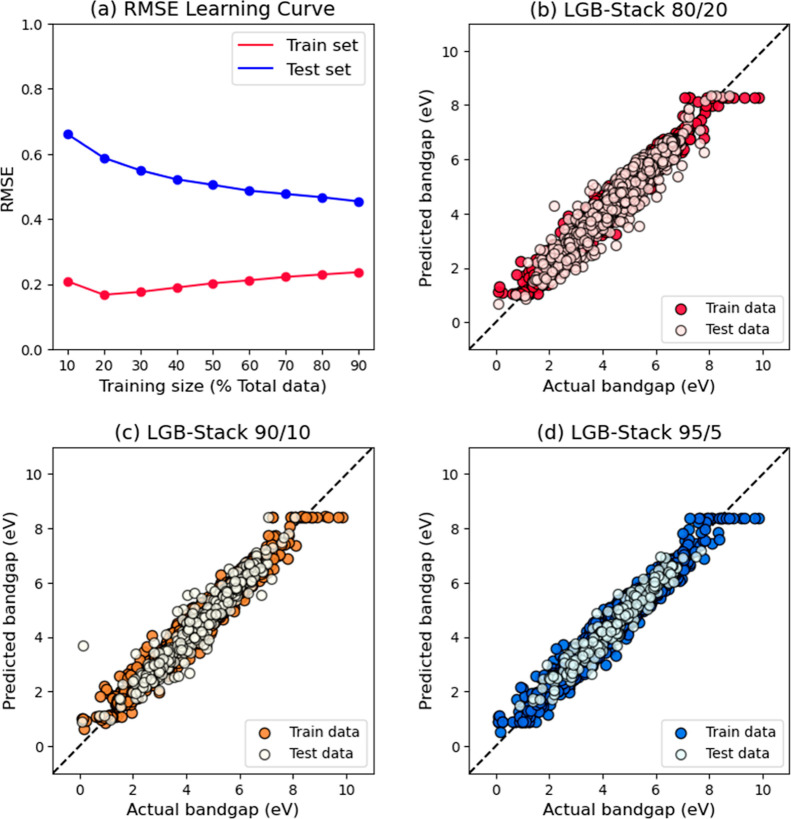
With reference to “level 2” in the outline of LGB-Stack in Figure 4, the final model trained at the second level of LGB-Stack was evaluated. The output predictions of the four chosen weak models based on group B fingerprints in Table 1 were concatenated to form a new set of input variables. Figure 5a shows the learning curve for LGB-Stack, which plots the mean train and test RMSE scores against the percentage share of train data in the data split, similar to that in the benchmark paper. Figure 5b,c shows the scatter plots of predicted Egap values against the actual Egap values for LGB-Stack. Table 2 shows the comparison of accuracy scores between the Ramprasad model and LGB-Stack. The full set of best and mean accuracy scores for LGB-Stack can be found in part B of the Supporting Information, where the values are expressed to four decimal places.
Figure 5.
Graph (a) is the learning curve of LGB-Stack based on RMSE; graphs (b–d) are scatter plots of the predicted Egap values against the actual Egap values for LGB-Stack. The train/test split ratios here are 80/20, 90/10, and 95/5, respectively.
Table 2. Best Accuracy Scores for LGB-Stack Trained on Trimmed Fingerprints Compared With the Ramprasad Model.
|
R2 |
RMSE
(eV) |
||||
|---|---|---|---|---|---|
| model | train | test | train | test | train/test split ratio |
| Ramprasad29 | 0.96 | 0.90 | 0.28 | 0.44 | 80/20 |
| LGB-Stack | 0.98 | 0.92 | 0.22 | 0.41 | |
| 0.97 | 0.92 | 0.23 | 0.40 | 90/10 | |
| 0.97 | 0.94 | 0.24 | 0.34 | 95/5 | |
In the learning curve of the benchmark paper, the Ramprasad model was reported to saturate at the 80/20 train/test split, which indicated that the inherent data in the dataset are sufficiently representative of polymers in the chemical space defined by the authors.29 However, in the case of LGB-Stack, Figure 5a shows that there are still a little more convergence of train and test RMSE scores even at the split ratio of 90/10, which indicated that this dataset might be even more representative of the polymers than what the authors previously thought. This prompted us to go one step further to train the model at train/test ratio of 95/5.
Table 2 shows that LGB-Stack has achieved better accuracy scores for both train and test set at split ratio 80/20. The accuracy scores further improved at split ratios 90/10 and 95/5. These results were expected based on the trend observed in Figure 5a. The three scatter plots in Figure 5b,c share similar scattering patterns for both train and test sets, which suggests that there was no serious overfitting. Most importantly, the scatter pattern became increasingly more compact as the train/test split ratio went from 80/20 to 95/5. This agrees with the trend observed in Figure 5a. The results suggest that the four weak models are accurate and diverse enough for their strengths to be combined to obtain a good final model, which is important for a successful stacked generalization.46,51 Therefore, it can be concluded that LGB-Stack is indeed a better QSPR model for the prediction of the Egap values of polymers than the Ramprasad model, and the primary aim of this paper has been achieved.
5. Conclusions
In summary, the objective defined in this paper has been successfully achieved. A two-level QSPR model called LGB-Stack with a very high accuracy was developed. Four 4096-bit 2D molecular fingerprints (A-FP, AC-FP, L-FP, and R-FP) were calculated and trimmed using RFE. At level 1 of LGB-Stack, LightGBM was trained on the four molecular fingerprints, which resulted in four weak models with four sets of outputs. At level 2 of LGB-Stack, LightGBM was trained on the four sets of outputs to obtain the final output of LGB-Stack. The final results show that LGB-Stack has surpassed the benchmark model.
In the future, we hope to increase the number of data points in the dataset that we use, so as to allow the machine learning algorithm to perform better supervised learning at split ratios higher than 80/20, such as 90/10 and 95/5. We also wish to explore the other similar physical properties, which might give rise to the possibility of transfer learning, in which the predictions made on a certain physical property can be used for making predictions on related physical properties.
Acknowledgments
This research was supported by the Ministry of Education, Singapore, under its Academic Research Fund Tier 1 RG83/20. The authors appreciate the reviewers’ helpful comments.
Supporting Information Available
The Supporting Information is available free of charge at https://pubs.acs.org/doi/10.1021/acsomega.2c02554.
Accuracy scores for the weak models and LGB-Stack; best accuracy scores; and mean accuracy scores (PDF)
Author Contributions
K.L.G. is the first author. A.G. and Y.L. conceived, designed, and supervised the study. K.L.G. processed the data of the dataset used. K.L.G. wrote the Python codes for LGB-Stack and most of the manuscript. Y.L. revised the manuscript. All authors have given approval to the final version of the manuscript.
The authors declare no competing financial interest.
Supplementary Material
References
- Xu P.; Lu T.; Ju L.; Tian L.; Li M.; Lu W. Machine Learning Aided Design of Polymer with Targeted Band Gap Based on DFT Computation. J. Phys. Chem. B 2021, 125, 601–611. 10.1021/acs.jpcb.0c08674. [DOI] [PubMed] [Google Scholar]
- Bundgaard E.; Krebs F. C. Low band gap polymers for organic photovoltaics. Sol. Energy Mater. Sol. Cells 2007, 91, 954–985. 10.1016/j.solmat.2007.01.015. [DOI] [Google Scholar]
- Florsch N.; Muhlach F.. Direct Current Electrical Methods. Everyday Applied Geophysics 1: Electrical Methods; ISTE Press: London, 2018; pp 27–103. [Google Scholar]
- Scharber M. C.; Sariciftci N. S. Low Band Gap Conjugated Semiconducting Polymers. Adv. Mater. Technol. 2021, 6, 2000857. 10.1002/admt.202000857. [DOI] [Google Scholar]
- Khalifeh S.Optimization of Electrical, Electronic and Optical Properties of Organic Electronic Structures. Polymers in Organic Electronics: Polymer Selection for Electronic, Mechatronic & Optoelectronic Systems; ChemTec Publishing: Toronto, 2020; pp 185–202. [Google Scholar]
- Wang Y.; Feng L.; Wang S. Conjugated Polymer Nanoparticles for Imaging, Cell Activity Regulation, and Therapy. Adv. Funct. Mater. 2019, 29, 1806818. 10.1002/adfm.201806818. [DOI] [Google Scholar]
- White B. T.; Long T. E. Advances in Polymeric Materials forElectromechanical Devices. Macromol. Rapid Commun. 2019, 40, 1800521. 10.1002/marc.201800521. [DOI] [PubMed] [Google Scholar]
- Katunin A.; Krukiewicz K.; Catalanotti G. Modeling andsynthesis of all-polymeric conducting composite material for aircraft lightning strike protection applications. Mater. Today Proc. 2017, 4, 8010–8015. 10.1016/j.matpr.2017.07.138. [DOI] [Google Scholar]
- Ma Z.; Chen P.; Cheng W.; Yan K.; Pan L.; Shi Y.; Yu G. Highly Sensitive, Printable Nanostructured Conductive Polymer Wireless Sensor for Food Spoilage Detection. Nano Lett. 2018, 18, 4570–4575. 10.1021/acs.nanolett.8b01825. [DOI] [PubMed] [Google Scholar]
- Palza H.; Zapata P. A.; Angulo-Pineda C. Electroactive Smart Polymers for Biomedical Applications. Materials 2019, 12, 277. 10.3390/ma12020277. [DOI] [PMC free article] [PubMed] [Google Scholar]
- Manirul Haque S. K.; Ardila-Rey J. A.; Umar Y.; Mas’ud A. A.; Muhammad-Sukki F.; Jume B. H.; Rahman H.; Bani N. A. Application and Suitability of Polymeric Materials as Insulators in Electrical Equipment. Energies 2021, 14, 2758. 10.3390/en14102758. [DOI] [Google Scholar]
- de Boer B.; Facchetti A. Semiconducting Polymeric Materials. Polym. Rev. 2008, 48, 423–431. 10.1080/15583720802231718. [DOI] [Google Scholar]
- Swager T. M. 50th Anniversary Perspective: Conducting/Semiconducting Conjugated Polymers. A Personal Perspective on the Past and the Future. Macromolecules 2017, 50, 4867–4886. 10.1021/acs.macromol.7b00582. [DOI] [Google Scholar]
- K K.; Rout C. S. Conducting polymers: a comprehensive review on recent advances in synthesis, properties and applications. RSC Adv. 2021, 11, 5659–5697. 10.1039/d0ra07800j. [DOI] [PMC free article] [PubMed] [Google Scholar]
- Shirakawa H.; Louis E. J.; MacDiarmid A. G.; Chiang C. K.; Heeger A. J. Synthesis of electrically conducting organic polymers: halogen derivatives of polyacetylene, (CH)x. J. Chem. Soc., Chem. Commun. 1977, 16, 578–580. 10.1039/c39770000578. [DOI] [Google Scholar]
- Spain E.; Venkatanarayanan A.. Review of Physical Principles of Sensing and Types of Sensing Materials. Comprehensive Materials Processing; Elsevier, 2014; Vol. 13, pp 5–46 [Google Scholar]
- Silver D.; Schrittwieser J.; Simonyan K.; Antonoglou I.; Huang A.; Guez A.; Hubert T.; Baker L.; Lai M.; Bolton A.; Chen Y.; Lillicrap T.; Hui F.; Sifre L.; van den Driessche G.; Graepel T.; Hassabis D. Mastering the game of Go without human knowledge. Nature 2017, 550, 354–359. 10.1038/nature24270. [DOI] [PubMed] [Google Scholar]
- Brown N.; Sandholm T. Superhuman AI for heads-up no-limit poker: Libratus beats top professionals. Science 2018, 359, 418–424. 10.1126/science.aao1733. [DOI] [PubMed] [Google Scholar]
- Wu S.; Kondo Y.; Kakimoto M.; Yang B.; Yamada H.; Kuwajima I.; Lambard G.; Hongo K.; Xu Y. J.; Shiomi C.; Schick J.; Morikawa R.; Yoshida R. Machine-learning-assisted discovery of polymers with high thermal conductivity using a molecular design algorithm. npj Comput. Mater. 2019, 5, 66. 10.1038/s41524-019-0203-2. [DOI] [Google Scholar]
- Pilania G.; Wang C.; Jiang X.; Rajasekaran S.; Ramprasad R. Accelerating materials property predictions using machine learning. Sci. Rep. 2013, 3, 2810. 10.1038/srep02810. [DOI] [PMC free article] [PubMed] [Google Scholar]
- Prezhdo O. V. Advancing Physical Chemistry with Machine Learning. J. Phys. Chem. Lett. 2020, 11, 9656–9658. 10.1021/acs.jpclett.0c03130. [DOI] [PubMed] [Google Scholar]
- Katritzky A. R.; Kuanar M.; Slavov S.; Hall C. D.; Karelson M.; Kahn I.; Dobchev D. A. Quantitative Correlation of Physical and Chemical Properties with Chemical Structure: Utility for Prediction. Chem. Rev. 2010, 110, 5714–5789. 10.1021/cr900238d. [DOI] [PubMed] [Google Scholar]
- Gianti E.; Percec S. Machine Learning at the Interface of Polymer Science and Biology: How Far Can We Go?. Biomacromolecules 2022, 23, 576–591. 10.1021/acs.biomac.1c01436. [DOI] [PubMed] [Google Scholar]
- Kim C.; Chandrasekaran A.; Huan T. D.; Das D.; Ramprasad R. Polymer Genome: A Data-Powered Polymer Informatics Platform for Property Predictions. J. Phys. Chem. C 2018, 122, 17575–17585. 10.1021/acs.jpcc.8b02913. [DOI] [Google Scholar]
- Tran H. D.; Kim C.; Chen L.; Chandrasekaran A.; Batra R.; Venkatram S.; Kamal D.; Lightstone J. P.; Gurnani R.; Shetty P.; Ramprasad M.; Laws J.; Shelton M.; Ramprasad R. Machine-learning predictions of polymer properties with Polymer Genome. J. Appl. Phys. 2020, 128, 171104. 10.1063/5.0023759. [DOI] [Google Scholar]
- Zhuo Y.; Mansouri Tehrani A. M.; Brgoch J. Predicting the Band Gaps of Inorganic Solids by Machine Learning. J. Phys. Chem. Lett. 2018, 9, 1668–1673. 10.1021/acs.jpclett.8b00124. [DOI] [PubMed] [Google Scholar]
- Dong Y.; Wu C.; Zhang C.; Liu Y.; Cheng J.; Lin J. Bandgap prediction by deep learning in configurationally hybridized graphene and boron nitride. npj Comput. Mater. 2019, 5, 26. 10.1038/s41524-019-0165-4. [DOI] [Google Scholar]
- Gladikh V.; Kim D. Y.; Hajibabaei A.; Jana A.; Myung C. W.; Kim K. S. Machine Learning for Predicting the Band Gaps of ABX3 Perovskites from Elemental Properties. J. Phys. Chem. C 2020, 124, 8905–8918. 10.1021/acs.jpcc.9b11768. [DOI] [Google Scholar]
- Kamal D.; Tran H.; Kim C.; Wang Y.; Chen L.; Cao Y.; Joseph V. R.; Ramprasad R. Novel high voltage polymer insulators using computational and data-driven techniques. J. Chem. Phys. 2021, 154, 174906. 10.1063/5.0044306. [DOI] [PubMed] [Google Scholar]
- KHAZANA: A Computational Materials Knowledgebase. https://khazana.gatech.edu (accessed Jan 11, 2022)
- Weininger D. SMILES, a Chemical Language and Information System. 1. Intro to Methodology and Encoding Rules. J. Chem. Inf. Comput. Sci. 1988, 28, 31–36. 10.1021/ci00057a005. [DOI] [Google Scholar]
- Lo Y.; Rensi S. E.; Torng W.; Altman R. B. Machine learning in chemoinformatics and drug discovery. Drug Discov. Today 2018, 23, 1538–1546. 10.1016/j.drudis.2018.05.010. [DOI] [PMC free article] [PubMed] [Google Scholar]
- Elton D. C.; Boukouvalas Z.; Butrico M. S.; Fuge M. D.; Chung P. W. Applying machine learning techniques to predict the properties of energetic materials. Sci. Rep. 2018, 8, 9059. 10.1038/s41598-018-27344-x. [DOI] [PMC free article] [PubMed] [Google Scholar]
- Landrum G.RDKit: Open-Source Cheminformatics Software. https://www.rdkit.org (accessed Jan 11, 2022).
- Gedeck P.; Rohde B.; Bartels C. QSAR—How Good Is It in Practice? Comparison of Descriptor Sets on an Unbiased Cross Section of Corporate Data Sets. J. Chem. Inf. Model. 2006, 46, 1924–1936. 10.1021/ci050413p. [DOI] [PubMed] [Google Scholar]
- Riniker S.; Landrum G. A. Open-source platform to benchmark fingerprints for ligand-based virtual screening. J. Cheminf. 2013, 5, 26. 10.1186/1758-2946-5-26. [DOI] [PMC free article] [PubMed] [Google Scholar]
- Landrum G.Fingerprints in the RDKit. RDKit: Open-Source Cheminformatics Software. https://rdkit.org/UGM/2012/Landrum_RDKit_UGM.Fingerprints.Final.pptx.pdf (accessed Mar 10, 2022).
- O’Boyle N. M.; Sayle R. A. Comparing structural fingerprints using a literature-based similarity benchmark. J Cheminform. 2016, 8, 36. 10.1186/s13321-016-0148-0. [DOI] [PMC free article] [PubMed] [Google Scholar]
- Guyon I.; Weston J.; Barnhill S.; Vapnik V. Gene Selection for Cancer Classification using Support Vector Machines. Mach. Learn. 2002, 46, 389–422. 10.1023/a:1012487302797. [DOI] [Google Scholar]
- Goldberg E.; Scheringer M.; Bucheli T. D.; Hungerbühler K. Prediction of nanoparticle transport behavior from physicochemical properties: machine learning provides insights to guide the next generation of transport models. Environ. Sci.: Nano 2015, 2, 352–360. 10.1039/c5en00050e. [DOI] [Google Scholar]
- Findlay M. R.; Freitas D. N.; Mobed-Miremadi M.; Wheeler K. E. Machine learning provides predictive analysis into silver nanoparticle protein corona formation from physicochemical properties. Environ. Sci.: Nano 2018, 5, 64–71. 10.1039/c7en00466d. [DOI] [PMC free article] [PubMed] [Google Scholar]
- Chen Q.; Meng Z.; Liu X.; Jin Q.; Su R. Decision Variants for the Automatic Determination of Optimal Feature Subset in RF-RFE. Genes 2018, 9, 301. 10.3390/genes9060301. [DOI] [PMC free article] [PubMed] [Google Scholar]
- Darst B. F.; Malecki K. C.; Engelman C. D. Using recursive feature elimination in random forest to account for correlated variables in high dimensional data. BMC Genom. 2018, 19, 65. 10.1186/s12863-018-0633-8. [DOI] [PMC free article] [PubMed] [Google Scholar]
- Bahl A.; Hellack B.; Balas M.; Dinischiotu A.; Wiemann M.; Brinkmann J.; Luch A.; Renard B. Y.; Haase A. Recursive feature elimination in random forest classification supports nanomaterial grouping. NanoImpact 2019, 15, 100179. 10.1016/j.impact.2019.100179. [DOI] [Google Scholar]
- Pedregosa F.; Varoquaux G.; Gramfort A.; Michel V.; Thirion B.; Grisel O.; Blondel M.; Prettenhofer P.; Weiss R.; Dubourg V.; Vanderplas J.; Passos A.; Cournapeau D.; Brucher M.; Perrot M.; Duchesnay E. Scikit-learn: Machine Learning in Python. J. Mach. Learn. Res. 2011, 12, 2825–2830. [Google Scholar]
- Zhou Z.1.4 Ensemble Methods. Ensemble Methods: Foundations and Algorithms; Chapman & Hall/CRC: Cambridge, 2012; pp 15–17. [Google Scholar]
- Natekin A.; Knoll A. Gradient boosting machines, a tutorial. Front. Neurorob. 2013, 7, 21. 10.3389/fnbot.2013.00021. [DOI] [PMC free article] [PubMed] [Google Scholar]
- Ke G.; Meng Q.; Finley T.; Wang T.; Chen W.; Ma W.; Ye Q.; Liu T.. LightGBM: a highly efficient gradient boosting decision tree. NIPS’17: Proceedings of the 31st International Conference on Neural Information Processing Systems; Curran Associates Inc.: California, USA, New York, Dec 4–9, 2017; pp 3149–3157.
- Zafari M.; Kumar D.; Umer M.; Kim K. S. Machine learning-based high throughput screening for nitrogen fixation on boron-doped single atom catalysts. J. Mater. Chem. A 2020, 8, 5209–5216. 10.1039/c9ta12608b. [DOI] [Google Scholar]
- Zafari M.; Nissimagoudar A. S.; Umer M.; Lee G.; Kim K. S. First principles and machine learning based superior catalytic activities and selectivities for N2 reduction in MBenes, defective 2D materials and 2D π-conjugated polymer-supported single atom catalysts. J. Mater. Chem. A 2021, 9, 9203–9213. 10.1039/d1ta00751c. [DOI] [Google Scholar]
- Zhou Z.4.4.1 Stacking. Ensemble Methods: Foundations and Algorithms; Chapman & Hall/CRC: Cambridge, 2012; pp 83–86. [Google Scholar]
- Ying X. An Overview of Overfitting and its Solutions. J. Phys.: Conf. Ser. 2019, 1168, 022022. 10.1088/1742-6596/1168/2/022022. [DOI] [Google Scholar]
- Fonseca-Delgado R.; Gómez-Gil P.. An assessment of ten-fold and Monte Carlo cross validations for time series forecasting. Proceedings of the 2013 10th International Conference on Electrical Engineering, Computing Science and Automatic Control (CCE): Mexico City, Mexico, Sep 30–Oct 04, 2013; Curran Associates Inc.: New York, 2014; pp 215–220.
- Barrow D. K.; Crone S. F. Cross-validation aggregation for combining autoregressive neural network forecasts. Int. J. Forecast. 2016, 32, 1120–1137. 10.1016/j.ijforecast.2015.12.011. [DOI] [Google Scholar]
- Salkind N. J.R2. In Encyclopedia of Research Design; Salkind N. J., Ed.; SAGE Publications: Thousand Oaks, 2012. http://dx.doi.org/10.4135/9781412961288.n357 (accessed 7 Feb 2022). [Google Scholar]
- Salkind N. J.Root Mean Square Error. In Encyclopedia of Research Design; Salkind N. J., Ed.; SAGE Publications: Thousand Oaks, 2012. http://dx.doi.org/10.4135/9781412961288 (accessed 7 Feb 2022). [Google Scholar]
Associated Data
This section collects any data citations, data availability statements, or supplementary materials included in this article.


