

Summary:
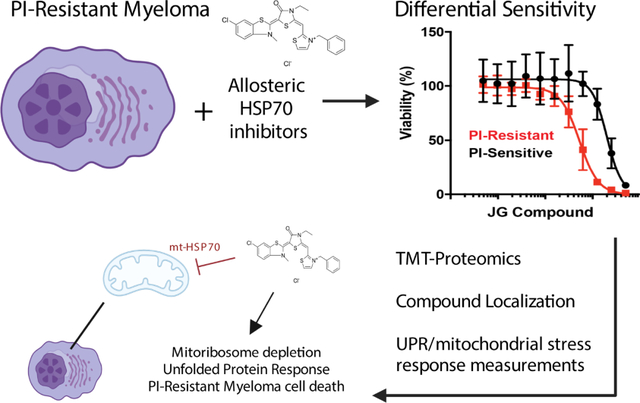
Proteasome inhibitor (PI) resistance remains a central challenge in multiple myeloma. To identify pathways mediating resistance, we first mapped proteasome-associated genetic co-dependencies. We identified heat shock protein 70 (HSP70) chaperones as potential targets, consistent with proposed mechanisms of myeloma cells overcoming PI-induced stress. We therefore explored allosteric HSP70 inhibitors (JG compounds) as myeloma therapeutics. JG compounds exhibited increased efficacy against acquired and intrinsic PI-resistant myeloma models, unlike HSP90 inhibition. Shotgun and pulsed-SILAC mass spectrometry demonstrated that JGs unexpectedly impact myeloma proteostasis by destabilizing the 55S mitoribosome. Our data suggest JGs have the most pronounced anti-myeloma effect not through inhibiting cytosolic HSP70s but instead through mitochondrial-localized HSP70, HSPA9/mortalin. Analysis of myeloma patient data further supports strong effects of global proteostasis capacity, and particularly HSPA9 expression, on PI response. Our results characterize myeloma proteostasis networks under therapeutic pressure while motivating further investigation of HSPA9 as a specific vulnerability in PI-resistant disease.
Graphical Abstract
eTOC
Ferguson et al find that a class of HSP70 inhibitors (JG compounds), have increased potency against myeloma cells resistant to proteasome inhibitors. JGs localize to mitochondria, inhibit the mitochondrial HSP70, and deplete mitochondrial ribosome proteins. Patient data analysis further links mitochondrial protein homeostasis to proteasome inhibitor resistance in myeloma.
Introduction:
Nearly all multiple myeloma (MM) patients receive a proteasome inhibitor (PI) as part of their therapeutic regimen (Manasanch and Orlowski, 2017). Malignant plasma cells that comprise this disease appear preferentially sensitive to PIs because of their extremely high levels of immunoglobulin synthesis (Obeng et al., 2006; Vincenz et al., 2013). Specifically, misfolded immunoglobulins cannot be efficiently degraded when proteasomes are inhibited, leading to their accumulation within the endoplasmic reticulum (ER) and activation of apoptosis via the unfolded protein response (UPR) (Kambhampati and Wiita, 2020). However, while the majority of MM patients will initially respond to PI therapy, none will be cured.
There are many proposed modes of resistance to PIs, including changes in the immune microenvironment and/or mutations in PSMB5, the proteasome subunit bound by PIs (Barrio et al., 2019; Farrell and Reagan, 2018; Nikesitch and Ling, 2016). However, the leading model of PI resistance is that MM cells rewire protein homeostasis (proteostasis) to decrease unfolded protein stress, by decreasing immunoglobulin synthesis (Leung-Hagesteijn et al., 2013) or increasing their ability to degrade or fold proteins through upregulation of proteasome subunits and protein-folding chaperones (Soriano et al., 2016). In addition, downregulation of 19S proteasomal regulatory “cap” subunits may relate to PI resistance, possibly by altering which proteins are degraded (Acosta-Alvear et al., 2015; Tsvetkov et al., 2015). Together, these observations suggest that an important mechanism of PI resistance is the compensatory tuning of proteostasis.
There are hundreds of proteins associated with proteostasis. Which of these might be targeted to overcome PI resistance? Previous studies (Wiita et al., 2013, Mitsiades et al., 2002) found that acute PI treatment induces a heat shock response, which upregulates inducible cytosolic HSP70 (HSPA1A gene) and BAG co-chaperones, which are required for HSP70’s activities. These observations suggest that targeting the HSP70 axis may partially eliminate a mechanism for acquiring PI resistance. In addition, PI-resistant cells might become selectively vulnerable to inhibitors of this chaperone.
While several small molecule HSP70 inhibitors have been developed, we focused on a class of “JG” compounds, including JG98, that allosterically inhibit HSP70. JGs function by stabilizing the ADP-bound HSP70 conformation, preventing ATP cycling, enhancing affinity for client proteins, and disrupting interaction with BAG co-chaperones (Li et al., 2015; Li et al., 2013; Shao et al., 2018,; Rousaki et al., 2011; Taylor et al., 2020; Young et al., 2016). Here, we investigate the potential of these “JG” series compounds to overcome PI resistance in MM. The results of in vitro screening support the therapeutic potential of these agents to specifically target PI-resistant disease. Shotgun and pulsed-SILAC proteomics further uncovered an unexpected role for mitochondrial proteostasis in the mechanism of this interaction. Overall, these results suggest a new approach to overcome PI-resistance in MM, while also revealing broader interactions between sub-cellular proteostasis networks in this disease.
Results:
Cytosolic HSP70 shows strongest genetic co-dependency with proteasome subunits in genome-wide CRISPR screen data
To reveal potential mechanisms of PI resistance, we performed bioinformatic analysis of previously-obtained genome-wide CRISPR-knockout screening data in the Cancer Dependency Map (DepMap) (Tsherniak et al., 2017). This dataset reflects genetic dependencies in cancer cells, focusing on decreases in survival as a function of gene knockout. We specifically asked: if cancer cell lines are highly dependent on the proteasome for survival, what other proteostasis-related genes are they also dependent on? We reasoned that this “co-dependency” approach could allow us to identify genes that could either be favorable targets for PI combinations or to overcome PI resistance. We first manually curated a list of 441 proteostasis genes based on prior literature (Dataset S1). We then evaluated the pairwise Pearson correlation of the survival dependency score for the 406 of these genes included in CRISPR screens across 558 cell lines in DepMap (Release 19Q1). We developed an overall landscape illustrating positive (cells are sensitive to genetic depletion of both genes) and negative (cells sensitive to depletion of one gene tend not to be sensitive to depletion of the other) correlations (Fig. 1A–B, Fig. S1A).
Figure 1. Cytosolic HSP70 shows strongest genetic co-dependency with proteasome subunits in genome-wide CRISPR screen data.

A. 406 genes involved in protein homeostasis were used in a Pearson Correlation clustering analysis of genome-wide pan-cancer CRISPR knockout dependency screen dataset downloaded from the DepMap portal (19Q1 release). Remaining 35 genes from curated list (Dataset S1) not present in DepMap CRISPR screen data. B. The most prominent co-dependency cluster includes cytosolic HSP70s (red) and proteasome subunits. Additional clusters highlighted in white squares in A. analyzed in Fig. S1.
Notably, subunits of the proteasome anchored the strongest cluster of positively correlated genes (Fig. 1B). However, the next most prominent genes in this cluster were those encoding several cytosolic HSP70 homologs: HSPA1A (HSP72 protein), HSPA6 (HSP70B), HSPA2 (HSP70-2), HSPA1L (HSP70-1L). This result supports previous analyses in MM (Eugenio et al., 2017; Wiita et al., 2013) underscoring that simultaneous blockade of both the proteasome and the cytosolic heat shock response might be advantageous. A smaller cluster of proteasome subunits also included the ER-localized HSP70, HSPA5 (BiP/GRP78) (Fig. S1B), suggesting this homolog as another promising target. Notably, the mitochondria-localized HSP70, HSPA9 (MtHSP70/GRP75/mortalin), was anti-correlated with the proteasome clusters. Interestingly, few other proteostasis pathways were linked to the proteasome. We did observe a co-dependency network involving two proteasome subunits (PSMD9 and PSME4), several ER-resident protein disulfide isomerases (P4HB, P4HA1, P4HA2, P4HA3), a BiP-interacting co-chaperone (DNAJC1), and several other genes (Fig. S1C). While investigating these additional associations is beyond the scope of our work here, we have developed an interactive web-based tool (https://tony-lin.shinyapps.io/proteostasis-map/) for use by others in the proteostasis field.
PI-resistant MM models show increased sensitivity to allosteric HSP70 inhibitors
Based on prior data and our analysis above, we thus investigated the “JG” series of allosteric HSP70 inhibitors in MM models. The parent compound in this series, JG98, has been found to have anti-tumor efficacy in breast and prostate cancer models (Gabai et al., 2016; Moses et al., 2018; Srinivasan et al., 2018; Yaglom et al., 2018). Recently, a medicinal chemistry campaign was used to improve the potency, stability and safety of this molecule (Shao et al., 2018). To obtain an overview of the structure-activity relationships (SAR) in MM models, we chose a representative set of 16 analogs from this series (Table S1, Fig. S2A). We evaluated the sensitivity of a well-characterized AMO-1 MM cell line evolved to be PI-resistant (AMO1-BtzR) and compared it to the parental counterpart (AMO1-WT) (Besse et al., 2018; Soriano et al., 2016) (Fig. 2A). 15 of 16 compounds demonstrated lower LC50’s in AMO1-BtzR vs. WT cells (Fig. 2B–C). We found this result encouraging as prior molecules described to overcome PI resistance in MM show approximately equal sensitivity between WT and PI-resistant cells (for example (Chitta et al., 2015; Das et al., 2017; Le Moigne et al., 2017; Tian et al., 2014)). We expanded our analysis to a panel of PI-resistant and PI-sensitive MM cell lines recently defined in a large-scale screen (Mitra et al., 2017) (Fig. 2D). PI-resistant lines again showed increased sensitivity to JGs compared to their sensitive counterparts (Fig. 2E, Fig. S2B). However, the HSP90 inhibitor, 17-DMAG (Egorin et al., 2002), did not exhibit differential efficacy vs. PI-sensitive or resistant cells (Fig. 2F, Fig. S2C). Thus, the relationship between HSP70 and proteasome inhibition was not a general property of other proteostasis targets. To test whether the activity in PI-resistant cells is dependent on HSP70 targeting, we used JG258, a truncated benzothiazole derivative predicted to not bind HSP70 and found to be inactive in previous studies (Shao et al., 2018; Eftekharzadeh et al. 2019). Encouragingly, JG342 and JG98 are 28.1 and 4.5 times more potent than JG258 against AMO1-BtzR cells, respectively (Fig. S2D).
Figure 2. PI-resistant MM models show increased sensitivity to allosteric HSP70 inhibitors.

A-B. AMO-1 bortezomib resistant (BtzR) cells are more sensitive than WT cells to an example JG compound, JG194. C. A larger panel of JG compounds (n =16) also show increased potency against AMO-1 BtzR MM model than WT. D-F. JG342 exhibits increased potency against MM cell lines resistant to Bortezomib. HSP90 inhibitor 17-DMAG does not show the same phenotype. Bortezomib sensitive cell lines - KMM1, MM1144, KMS18. Bortezomib resistant cell lines – ANBL6-BtzR, LP-1, MMM1, JIM-3, U226-BtzR, RPMI-8226 BtzR, KMS12BM. G. JG342 exhibits LC50’s in the nM range against a panel of MM cell lines (AMO1, AMO1-BtzR, AMO1-CfzR JJN3, KMS11, KMS34, L363, MM.1S, RPMI8226) and exhibits a therapeutic index against both immortalized (HS5, HS27A) and patient-derived bone marrow stromal lines. All measurements in A-G. performed as n = 4 in 384 well plates, with viability measured using CellTiterGlo at 48 hours. H-I. NSG mice (n = 3 per arm) were implanted with luciferase labeled RPMI-8226 MM cell line and dosed for two weeks with 3 mg/kg JG342 three times per week starting at day 14. JG342 exhibits in-vivo anti-MM activity, quantified in (I.). All error bars indicate +/− S.D. p-value by two-sided t-test.
We further tested whether JG compounds are synergistic with bortezomib or other proteostasis inhibitors, as previous work in myeloma suggested that simultaneously targeting other parts of the proteostasis network can be synergistic with PIs (Le Moigne et al., 2017; Tian et al., 2014). Synergistic and antagonistic interactions between JG98, bortezomib, 17-DMAG, and the p97 inhibitor CB-5083 (Anderson et al., 2015) varied across three MM cell lines and one acute myeloid leukemia cell line comparator (Fig. S2E–F, Table S2). Interestingly, JG98 and bortezomib was the only synergistic combination in two out of three MM lines. This observation was consistent with prior findings combining an older non-allosteric HSP70 inhibitor, VER-155088, with bortezomib, which also resulted in modest synergy in MM models (Eugenio et al., 2017; Huang et al., 2020b; Schlecht et al., 2013).
Of the JG compounds tested, JG342 showed the lowest LC50 (122.6 nM) vs. AMO1-BtzR cells (Fig. 2C), leading us to focus on this molecule as a chemical probe for further preclinical studies. Using our standard preclinical screening approaches for MM therapeutics (Huang et al., 2020a; Lam et al., 2018), we tested JG342 for activity against another panel of MM cell lines and non-malignant bone marrow stromal cells (Fig. 2G). MM cell lines were routinely more sensitive to JG342, suggesting a potential therapeutic index. JG342 also had activity against primary MM plasma cells derived from a PI-refractory patient bone marrow aspirate, although the broad emission spectra of this compound, derived from rhodamine dyes (Shao and Gestwicki, 2020), made it challenging to measure off-target toxicity in a two-color flow-cytometry assay (Fig. S2G–I) (Huang et al., 2020a). We also performed an initial evaluation of the activity of JG342 in vivo, starting with pharmacokinetics (PK) in NOD scid gamma (NSG) mice. After a single i.v. injection (3 mg/kg), the plasma concentrations decreased below the predicted therapeutic range (<150 nM) after ~6 hr (Fig. S2J). This rate of clearance might be sufficient to give an anti-tumor effect if cell death is rapidly induced. To test this idea, we implanted luciferase-labeled RPMI-8226 cells intravenously into NSG mice, leading to disseminated disease primarily in murine bone marrow (Rossi et al., 2018). After 14 days of tumor growth, we treated mice 3x/week for 2 weeks at 3 mg/kg IV JG342; by bioluminescent imaging we noted a trend toward decreased tumor burden in treated mice vs. vehicle control (p = 0.09) (Fig. 2H–I). Notably, other JG compounds have also shown in vivo efficacy in subcutaneous solid tumor models in other mouse backgrounds (Moses et al., 2018; Wu et al., 2020). However, in further studies in MM NSG models we had difficulty improving the balance between toxicity at Cmax, immediately after administration, and efficacy, for either JG98 or JG342. NSG mice are known to be more sensitive to cytotoxic stress than other mouse strains (Wunderlich et al., 2019). These findings suggest that optimization of JG pharmacokinetics may be necessary for further preclinical development in these standard murine MM models.
JG98 selectively destabilizes the mitochondrial ribosome
To inform future compound optimization, we sought to understand the drivers of this differential sensitivity. We hypothesized that this increased potency of JG compounds versus PI-resistant MM cells may relate to how the cellular proteome is remodeled after HSP70 inhibition. We therefore performed multiplexed tandem mass tag (TMT) proteomics on three MM cell lines treated with the four compounds above, with each perturbation in biological duplicate (Fig. 3A). Surprisingly, we found that JG98, but none of the other compounds, led to depletion of 55S mitochondrial ribosome subunits (Fig. 3B–C, Fig. S3A–C). TMT proteomics confirmed that mitochondrial ribosomes are also selectively depleted after JG98 and JG342 treatment in AMO1-BtzR cells (Fig. S3D). Western blot confirmed marked depletion of the mitoribosome subunit MRPL11 after JG98 in MM.1S and JG342 in AMO1 BtzR cells (Fig. S3E–F). Additionally, the enzyme SOD2 (Superoxide Dismutase 2) was the most increased protein under JG98 (Fig. S3B), further supporting a mitochondrial stress response (Candas and Li, 2014; Valera-Alberni and Canto, 2018).
Figure 3. JG98 destabilizes the mitochondrial ribosome.

A. Experimental schematic. KMS34, MM1.S, and RPMI-8226 MM lines were treated for 22 hr with Bortezomib (Proteasome), 17-DMAG (HSP90), CB-5083 (p97/VCP), JG98 (HSP70), or DMSO. Two biological replicates combined into TMT-10plex for each cell line. B. JG98 leads to selective depletion of 55S mitochondrial ribosome subunits; data aggregated across three cell lines. C. Log2-fold changes for mitochondrial ribosome subunits vs. all other mitochondrial proteins; data aggregated across three cell lines. D. AMO-1 WT and BtzR cells were treated with 1μM JG342, JG98, or JG258 prior to mitochondrial isolation and flow cytometry of isolated mitochondria. JG compounds were visualized by FITC fluorescence (see Fig. S2G). Data is representative of two biological replicates. E. AMO1 WT, AMO1 BtzR, and HS-5 cells were treated with Bortezomib, JG98, JG342, or JG258 and Oxidative Consumption Rate (OCR) was measured by seahorse respirometry (n = 4 wells per treatment, performed 3 times). Asterisks represent two-sided t-test p-values vs. DMSO, NS = not significant, * = <0.05, ** = <0.01,*** = <0.001; **** = <0.0001. F. RPMI-8226 MM cells with stable integration of the CRISPR interference dCas9-KRAB construct (Ramkumar et al., 2020b) were transduced with a non-targeting guide RNA or two independent guide RNAs targeting HSPA9. Western blotting was performed for HSPA9, MRPL11, and RPS6. G. Quantification of results in (F.) versus beta-actin loading control and with relative fold-change of two HSPA9 sgRNAs vs. scramble sgRNA, in two independent replicates, demonstrates significant depletion of MRPL11 but not RPS6. p-value by two-sided t-test. H. Increased HSPA9 gene expression by qPCR in AMO1 BtzR cells transduced with HSPA9 expressing lentivirus vs empty vector (EV) lentivirus control. I. Overexpression of HSPA9 increases LC50 of JG342 in AMO1 BtzR cells using same assay conditions as in Fig. 2A–G. All error bars indicate +/− S.D.
Given these impacts on the mitochondrial proteome, we thus hypothesized that JGs might overcome PI resistance by inhibiting the mitochondrial HSP70 isoform, mtHsp70/HSPA9/mortalin. Prior work on the precursor molecule MKT-077 suggested that it partitioned into mitochondria but could interact with both mtHsp70 and cytosolic HSPA8 (Modica-Napolitano and Aprille, 2001; Wadhwa et al., 2000). To estimate the subcellular localization of these compounds, we took advantage of their intrinsic fluorescence (Fig. S2G) (Shao and Gestwicki, 2020). We found that isolated mitochondria from AMO-1 WT and BtzR cells treated with JG98, JG342, and JG258 contained high levels of compound (Fig. 3D). Higher mitochondrial accumulation of all compounds was noted in PI-resistant cells (Fig. S3G–J), including JG258 and the control mitochondrial probe DiIC1(5) (Shapiro et al., 1979), suggesting a possible general alteration in mitochondrial import or permeability. Live-cell imaging using a far-red MitoTracker dye to avoid spectral interference from JG compounds illustrated that both compounds were almost entirely localized to mitochondria (Fig. S3K). This localization is consistent with other data (Wu et al., 2020) and might be expected because of the cationic property of JG98 and JG342, as positively charged molecules often localize to this compartment.
To evaluate functional impacts, we performed seahorse respirometry and found that JG98 and JG342 led to decreases in oxygen consumption rate (OCR) in AMO1 WT, AMO1 BtzR, and HS-5 stromal cells, underscoring a selective mitochondrial perturbation of these agents (Fig. 3E). Interestingly, JG258 depleted OCR in AMO1 BtzR but not AMO1 WT cells, potentially indicating that BtzR cells are more susceptible to mitochondrial perturbation independent of HSP70 interaction. However, neither JG98 nor JG342 substantially disrupted mitochondrial morphology or caused mitochondrial depolarization (Fig. S3M–N). CRISPR interference-mediated partial knockdown of HSPA9 in RPMI-8226 myeloma cells stably expressing dCas9-KRAB (Ramkumar et al., 2020a) decreased levels of MRPL11 but not the cytosolic ribosome subunit RPS6 (Fig. 3F–G), illustrating that HSPA9 knockdown can phenocopy the mitoribosome depletion induced by JG treatment. In parallel, HSPA9 overexpression in AMO1-BtzR decreased sensitivity to JG342 (Fig. 3H–I), providing evidence that HSPA9 is a target of this agent.
Notably, a recent study convincingly showed that treatment with JG compounds strongly phenocopied the genetic dependency on HSPA9/mortalin of BRAF-mutant tumors (Wu et al., 2020). In addition, CRISPR interference screening to find genetic determinants of resistance to JG treatment showed that knockdown of HSPA9 reduced efficacy of these agents (Shao et al., 2018). Furthermore, recent results using two different in vitro-generated models of PI resistance also showed that targeting mitochondrial homeostasis may be a selective vulnerability in PI-resistant disease (Besse et al., 2019; Tsvetkov et al., 2019). Taken together, these results support the notion that JG compounds may function via mitochondrial perturbation to drive enhanced efficacy vs. PI-resistant MM.
Pulsed SILAC illustrates that JG342 leads to loss of nascent mitoribosome subunits
HSP70 family chaperones are primarily thought to function in stabilizing newly-synthesized proteins, though they also may have an array of functions maintaining folded proteins and complexes (Rosenzweig et al., 2019). We therefore investigated whether the depletion of mitoribosome subunits after JG342 was primarily due to loss of nascent polypeptides, or, alternatively, destabilization of pre-existing, “mature” proteins. We employed a modified version of multiplexed pulsed-SILAC-TMT (Stable Isotope Labeling of Amino acids in Cell culture) proteomics (Savitski et al., 2018; Welle et al., 2016). (Fig. 4A, Dataset S3). The large majority of nascent proteins were decreased in abundance after JG342 treatment compared to DMSO control (Fig. 4B, E). This finding was potentially consistent with induction of the Integrated Stress Response (ISR), a conserved response to diverse cellular stresses, where a major outcome is a global decrease in mRNA translation (Pakos-Zebrucka et al., 2016). Puromycin incorporation assays also biochemically confirmed a global shutdown of protein synthesis (Fig. 5D).
Figure 4. JG342 destabilizes nascent and mature mitochondrial ribosome subunits in the context of global translational slowdown.
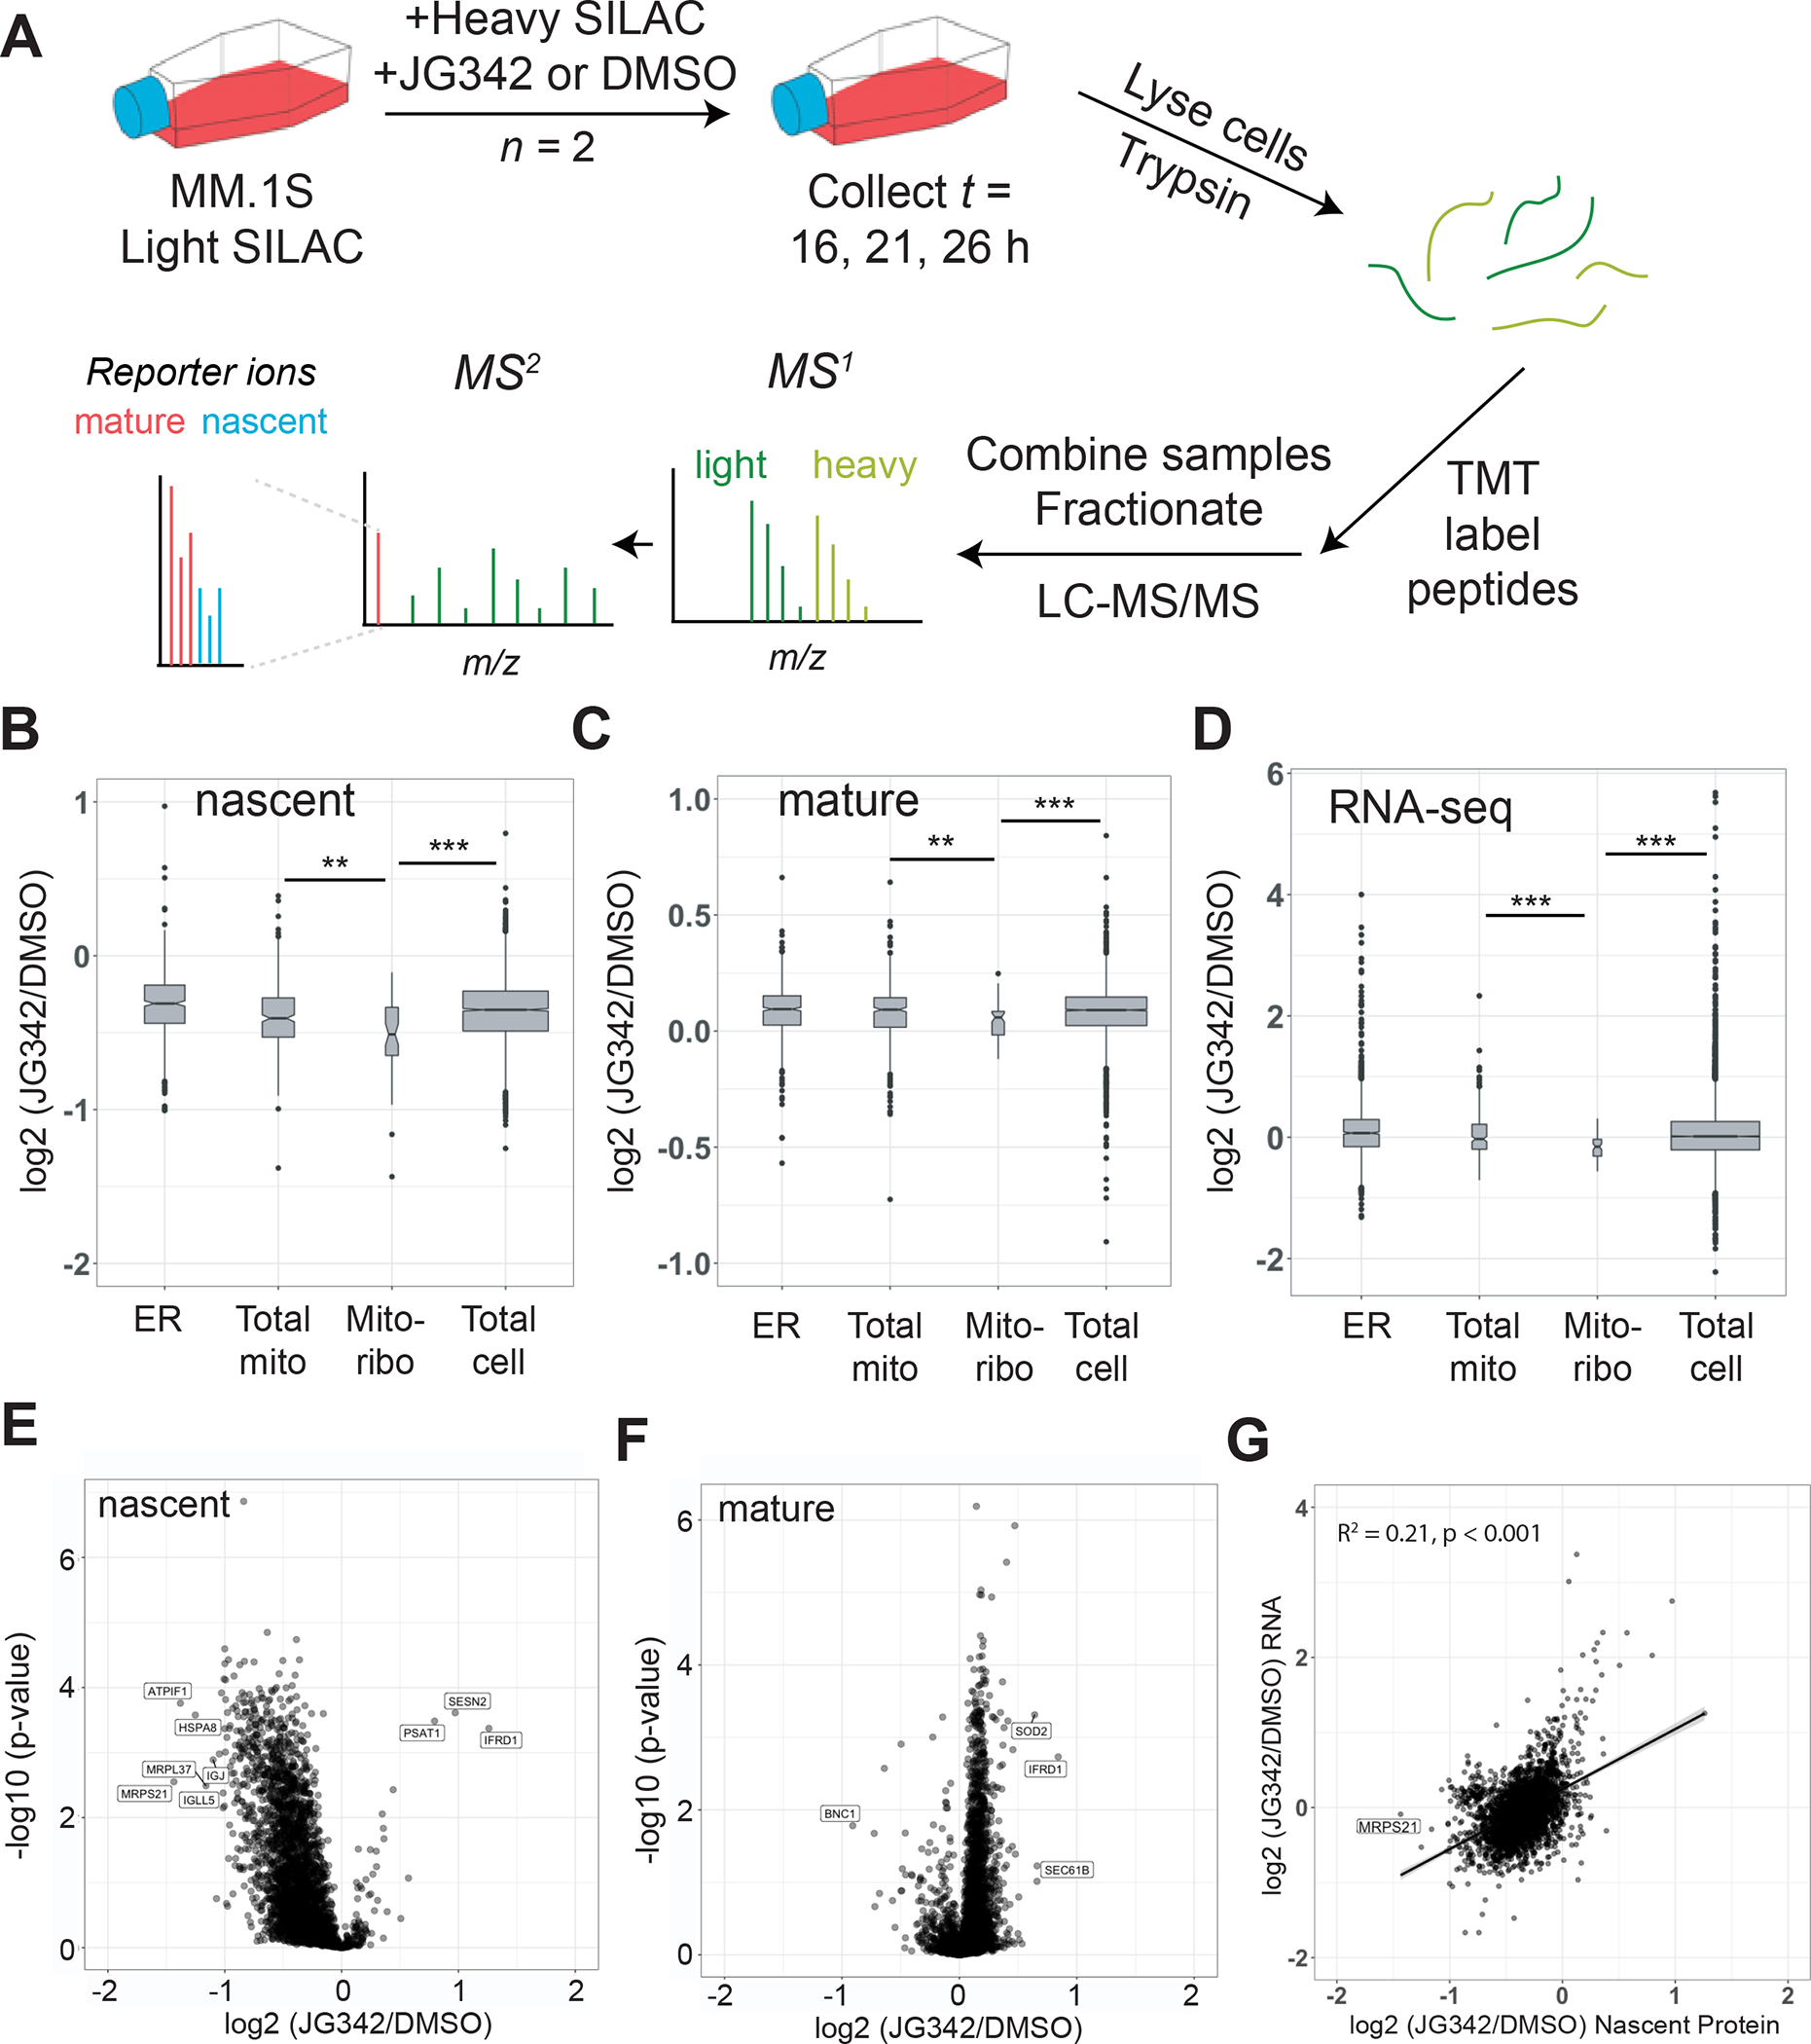
A. Pulsed-SILAC experimental schematic. Briefly, MM1.S cells grown in Light SILAC media are switched to Heavy SILAC media containing 350 nM JG342 or DMSO at t = 0 hr. Cells are collected at 16, 21, 26 hours, lysed, and proteins digested with trypsin, followed by TMT labeling. Samples are combined in 7-plex experiments, fractionated by HPLC and analyzed by MS/MS on Orbitrap Fusion Lumos. B-C. Log2-fold changes across timepoints for JG342 treated vs. DMSO for nascent (B) and mature (C) proteins in endoplasmic reticulum (ER), mitochondria (Total mito), mitochondrial ribosome (Mito-ribo), and rest of the proteome (Total cell category excludes proteins included in previous three categories). D. RNA-seq TPM log2-fold changes between JG342 and DMSO treated samples from 26 hr timepoint. E-F. Log2-fold changes under 350 nM JG342 vs. DMSO across timepoints separating heavy-labeled nascent (E) and light-labeled mature (F) protein indicate MRPS21 and MRPL37 are among most prominently depleted nascent proteins after JG342. G. Log2-fold changes for RNA at 26 hr time point and nascent protein across 16, 21, and 26 hr timepoints. ** = two-sided t-test p-value < 0.01, *** < 0.001.
Figure 5. JG compounds activate a non-canonical UPR without compensatory chaperone upregulation in myeloma cells.

A. RNA-seq log2-fold changes for JG342 vs. DMSO treated MM.1S cells from 26-hour timepoint (as in Fig. 4D). B-C. JG98 (B) and JG342 (C) activate some canonical markers of the UPR in MM.1S cells. Cells were treated with 3 μM compound and UPR marker proteins were analyzed by Western blot. D. JG342 (2 μM) leads to translational slowdown without upregulation of major HSP70 isoforms HSPA5 (BiP, endoplasmic reticulum), HSPA9 (mitochondria), or HSPA8 (cytosolic). Puromycin incorporation performed by 1 hr incubation of 1μM puromycin at each designated time point, and protein levels analyzed by western blot. E. TMT-proteomics (data from experiment outlined in Fig 3A) identifies relative lack of compensatory chaperone upregulation in JG98-treated cells. Analysis here shows 244 proteins out of 441 curated proteostasis genes quantified in TMT mass spectrometry experiments across three cell lines. F. Translational slowdown via puromycin incorporation and total HSP70 levels analyzed by western blot in KMS34 cells treated with 2μM JG98, 7.5nM Bortezomib, 1μM CB-5083, 500nM 17-DMAG, or DMSO for 22 hours and 1 μM Puromycin for 1 hour. Consistent with proteomic data, only Btz and 17-DMAG show an increase in total HSP70, while all drugs lead to translational slowdown, potentially due to the Integrated Stress Response.
However, even among this overall decrease in nascent proteins, two of the most-depleted proteins were subunits of the mitoribosome (MRPS21 and MRPL37) (Fig. 4B,E). Furthermore, mitoribosome subunits were overall significantly depleted from the nascent proteome fraction compared to either the general pool of cellular proteins or other mitochondrial proteins (Fig. 4B). Decreases, albeit less prominent, in mature mitoribosome subunits (Fig. 4C) and mitoribosome mRNA (Fig. 4D) suggested possible effects on the mitoribosome at both the transcriptional and post-transcriptional levels (Fig. 4F–G). Furthermore, SOD2 was among the most enriched mature proteins under JG342, indicative of a mitochondrial stress response (Candas and Li, 2014; Valera-Alberni and Canto, 2018) (Fig 4F, Fig. S4A). Taken together, these results are consistent with the notion that JG compounds perturb mitochondrial proteostasis in MM cells.
JG compounds perturb proteostasis without compensatory heat shock response or chaperone upregulation
It was previously observed that bortezomib treatment in myeloma cells led to an increase in cytosolic heat shock chaperone expression and induction of the UPR, potentially serving as a compensatory response (Wiita et al., 2013, Obeng et al., 2006). Our transcriptomic and proteomic results suggested that JG compounds may also activate the UPR in MM cells (Fig. 5A, Fig. S5A–B), in concordance with previous work on allosteric HSP70 inhibitors in other cancers (Sabnis et al., 2016; Yaglom et al., 2018). In MM cells, we confirmed by Western blotting that both JG98 and JG342 induced some canonical markers of the UPR (Fig. 5B–C), including spliced XBP1, phosphorylated PERK, and induction of CHOP (Walter and Ron, 2011). However, we did not observe upregulation of the ER-localized HSP70 isoform HSPA5/BiP, one of the most common markers of downstream UPR signaling (Fig. 5D), nor in transcriptional regulators of the heat shock response (HSF1/2/4) (Fig. 5A) commonly triggered by PI treatment (Wiita et al., 2013). CHOP is a transcription factor directly linked to induction of apoptosis not only by the UPR (Marciniak et al., 2004) but also by the broader ISR with stress originating in the ER, cytosol, or mitochondria (Guo et al., 2020; Pakos-Zebrucka et al., 2016). Surprisingly, however, we found that known efficacious doses of ISRIB (200 nM) (Sidrauski et al., 2015), an inhibitor of the broader ISR, only led to marginal impacts on the mRNA- and protein-level response to JG98 or JG342 for canonical ISR markers (Fig. S5C–D). Taken together, these findings indicate that JG compounds induce a cellular stress response in MM cells that is distinct from the canonical UPR.
Consistent with these results from Western blotting, our broader proteomic and transcriptomic results confirmed that JG treatment did not induce upregulation of presumed stabilizing components of the MM proteostasis network in PI-sensitive or PI-resistant cells (Fig. 5E, Fig. S5E). This finding was in direct contrast to effects of bortezomib, 17-DMAG, and CB-5083, despite similar levels of stress-induced reduction in global translation (Fig. 5F). Bortezomib and 17-DMAG had partially overlapping response profiles among several chaperones, including increases in HSP70 and HSP90 isoforms and associated co-chaperones, while, in contrast, p97 inhibition with CB-5083 led to an increase in the ER-resident HSP70 isoform BiP/HSPA5 (Fig. 5E, Fig. S5E). Our findings suggest that allosterically inhibiting HSP70 may be an advantageous strategy to target proteostasis, as it does not induce compensatory chaperone upregulation to buffer unfolded protein stress.
Increased proteostasis capacity broadly drives poorer outcomes in myeloma and HSPA9 expression is among the strongest predictors of outcome
Our results thus far raise the hypothesis that increased mitochondrial proteostasis capacity, and particularly expression of HSPA9, may also be a feature of PI resistance in MM patients. To investigate this hypothesis, we examined CD138+ tumor cell transcriptomic data from 773 newly-diagnosed patients in the Multiple Myeloma Research Foundation CoMMpass database (IA14 Release) (compass.themmrf.org). The large majority (94.5%) of these patients received a PI as part of their upfront induction therapy.
We first evaluated the possible correlation between overall survival (OS) of patients and the levels of HSP70 isoforms. Indeed, we found that HSPA9 expression was by far the strongest predictor of outcome among these genes, where patients in the upper quintile of HSPA9 expression had a median OS of 58 months, while those in the lowest quintile did not reach median OS (p = 2.51e-5) (Fig. 6A). In contrast, expression of cytosolic HSP70 isoforms as well as the ER-resident HSP70 HSPA5 (BiP), led to less pronounced differences in OS (Fig. 6B–C and Fig. S6A–B). Given that our results suggest a link between HSPA9 inhibition and mitoribosome depletion, we further built an aggregate expression score across 60 genes comprising the mitoribosome expressed in CoMMpass patients. Patients in the upper quintile of mitoribosome expression showed markedly poorer outcomes (p = 3.32e-5) (Fig. 6D), with a Kaplan-Meier plot closely mimicking that of HSPA9.
Figure 6. High baseline expression of proteostasis genes, especially HSPA9 and mitoribosome subunits, lead to poorer outcomes in MM patients treated with PIs.

A-D. Kaplan-Meier curves for overall survival stratified by top and bottom 20 percent of patients for RNA-expression of HSPA9 (mitochondrial HSP70), HSPA8 (cytosolic HSP70), HSPA5 (ER HSP70), and an aggregate 60 gene score of mitoribosome subunits. All RNA-seq (in TPM, from CD138+ enriched tumor cells at MM diagnosis) and overall survival data from 773 patients in the Multiple Myeloma Research Foundation CoMMpass study release IA14. E. Volcano plot of proteostasis genes using p-values for predictions of relative progression-free survival (PFS) for top and bottom 20% of patients by gene expression (in TPM). 241 genes from 441 from curated proteostasis gene list are included. Genes were included if expressed at TPM >1 across all MM samples and had reached median PFS value in both the top- and bottom-quintiles of expression. Difference in median PFS in days shown along x-axis. HSPA9 is one of the strongest predictors of poor PFS when highly expressed. HSP70 isoforms are colored in blue, 20S proteasome beta subunits colored in green, 20S proteasome alpha subunits colored in red, and 19S proteasome cap subunits colored in purple. F. Kaplan-Meier curves for RNA-expression of PSMD2 shows decreased overall survival in patients with high PSMD2 at baseline. All p-values by log-rank test.
While HSPA9 had the strongest correlation, expression of other HSP70 isoforms all showed a similar trend: increased chaperone expression led to shorter survival. This finding raised a general hypothesis: we speculated that broad increases in tumor proteostasis capacity, potentially through multiple different mechanisms, could decrease sensitivity to PIs, ultimately driving poorer outcomes for patients. To test this hypothesis, we evaluated the difference in median CoMMpass patient Progression-Free Survival (PFS) for the upper and lower expression quintiles across our curated proteostasis gene list in Fig. 1A (here we used PFS instead of OS since this led to more genes with a calculable median survival difference). Of these 441 genes, 241 had detectable expression across patients (TPM >1) and were included in our analysis. For the large majority of these genes (160 of 241), increased expression (top quintile) of the proteostasis-related gene led to significantly (p < 0.05) poorer survival when compared to low expression (bottom quintile) (Fig. 6E). Remarkably, we found no cases where the opposite was true, with bottom quintile gene expression leading to significantly worse outcomes than top quintile.
Notably, differential HSPA9 expression was one of the strongest indicators of patient PFS (Fig. 6E), and, in fact, HSPA9 was more highly ranked than almost all the 20S core subunits of the proteasome. Taken together, these data underscore the broad ability of MM plasma cells to resist PI treatment if they have greater global capacity to decrease unfolded protein load, potentially mitigating the apoptotic response to unfolded protein stress. Furthermore, these findings also suggest a possible leading role of HSPA9 and the mitoribosome in maintaining proteostasis in the PI-resistant state, thereby establishing a selective therapeutic vulnerability in these tumors that can be exploited by JG compounds.
Low 19S cap expression and HSP70 network adaptation do not play a clear role in MM patient PI resistance
Prior analyses using unbiased genetic knockdowns in cell line models (Acosta-Alvear et al., 2015; Tsvetkov et al., 2015) have suggested that low expression of subunits of the 19S proteasome cap may lead to PI resistance. Studies based on this hypothesis have specifically focused on PSMC2 and PSMD2, supported by gene expression data in an older monotherapy clinical trial of bortezomib in myeloma (Mulligan et al., 2007). In our analysis of CoMMpass data, we therefore expected to see decreased expression of 19S cap subunits leading to poorer PFS. However, we found the opposite: increased expression of 19S cap subunits led to poorer outcomes, running in parallel with findings from the 20S proteasomal core (Fig. 6E–F; Fig. S6C). Consistent with this unexpected result, a recent clinical study used intracellular flow cytometry to evaluate protein levels of three 19S proteasome subunits in MM tumor cells at diagnosis (Misiewicz-Krzeminska et al., 2020). In this independent cohort, receiving the same bortezomib, lenalidomide, and dexamethasone induction therapy as most patients in CoMMpass, the authors also found that increased levels of PSMD1, PSMD4, and PSMD10 protein negatively correlated with MM patient survival. Our CoMMpass transcriptome analysis suggests this negative correlation extends to all subunits of the 19S cap. The reason for the discrepancy between prior cell line models, suggesting decreased 19S abundance leads to PI resistance, and the clinical data from these two independent cohorts is unclear, though it may relate to effects of therapies administered in combination with PI. Regardless, in this real-world clinical data it is apparent that increased proteostasis capacity, including the 19S cap, globally impacts myeloma outcomes under current PI-containing therapeutic regimens.
Finally, PI resistance has been linked in cell line models to increased expression of HSP70 family chaperones (Mitra et al., 2017; Nikesitch and Ling, 2016). We therefore obtained data for 50 CoMMpass patients (release IA14) with paired tumor RNA-seq at first relapse and initial diagnoses, all of whom received a PI as part of first-line therapy. Surprisingly, we did not observe any shift toward increased gene expression of any HSP70 isoform, including HSPA9, in the relapsed setting (Fig. S6D). Notably, no increase in expression of proteasomal subunits was observed either (Fig. S6E). Combined with our survival analysis above, these findings indicate that baseline chaperone expression levels between patients may be more relevant to governing intrinsic resistance to upfront PI therapy, rather than acquired resistance after initial response to PI.
Discussion:
Here we aimed to characterize a new approach to address PI resistance, a long-standing issue in MM clinical care. We found that the JG series of allosteric HSP70 inhibitors preferentially eliminated both intrinsic and acquired models of PI resistance. Importantly, this phenotype has not been shown for any other classes of HSP70 inhibitors (Eugenio et al., 2017; Huang et al., 2020b). Emerging methods of quantitative proteomics, not previously applied to any other HSP70 inhibitors, combined with cellular validation further suggested that these JG compounds strongly engage the mitochondrial-localized HSPA9, rather than exerting their primary effects on the cytosolic HSP70s as initially expected.
Overall, our findings fall in line with two recent studies suggesting that mitochondrial homeostasis is a selective vulnerability in PI-resistant disease. In one study, this conclusion was drawn based on bioinformatic analysis of patient tumors and functional analysis of cell lines expressing a low level of the 19S proteasomal cap gene PSMD2, demonstrating a strong dependency of PI sensitivity on mitochondrial metabolism (Tsvetkov et al., 2019). In parallel, a second study involved characterizing in vitro-evolved PI-resistant AMO-1 MM cell lines (including the same one we employed here for our initial drug screens (Fig. 2A–C)) and demonstrated specific alterations in mitochondrial homeostasis (Besse et al., 2019). Targeting these cells with mitochondrial perturbagens, such as Bcl-2 and AMPK inhibitors, led to increased cell death versus their sensitive counterparts (Besse et al., 2019). JG compounds led to this same remarkable, yet uncommon, phenotype of increased potency in PI-resistant models (Fig. 2A–E).
Further underscoring potential mitochondrial-centered effects of JGs in MM, we found that JGs robustly localize to mitochondria, lead to mitoribosome depletion, this effect is pheno-copied by HSPA9 genetic depletion, and HSPA9 overexpression reduces sensitivity to JG treatment (Fig. 3B–D, F–G, Fig. S3D, Fig. 3I). Supporting the importance of HSPA9/mortalin targeting for JG mechanism of action, a recent study also confirmed that JG treatment strongly pheno-copied effects of HSPA9 knockdown in another cancer model (Wu et al., 2020). However, we do note that in other disease models, JG analogs and the precursor MKT-077 have been shown to act through cytoplasmic HSP70s (Fontaine et al., 2015; Taguwa et al., 2015) or to bind both cytoplasmic and mitochondrial HSP70s (Wadhwa et al., 2000). Prior studies indicate that cytosolic HSP70s, or perhaps the ER-resident HSP70 HSPA5/BiP, still remain as potential targets in PI-resistant disease (Shah et al., 2015; Shah et al., 2016; Wiita et al., 2013) (Shao et al., 2018). In addition, a prior study using a different HSP70 inhibitor that does not interact with HSPA9/mortalin, PET-16, suggested that mitochondrial disruption could occur through binding to heat shock-inducible HSP72 (HSPA1A) (Leu et al., 2017). Together, this work has revealed the exciting potential for JG compounds to selectively target PI-resistant myeloma and uncovered initial evidence of their mechanism of action.
Limitations of the study
We note that our study has several limitations. First, we cannot rule out the possibility that JG’s exert part of their effects in MM through also inhibiting other HSP70 isoforms, for example canonically cytosolic HSP70’s localized to mitochondria. However, the reported dependence on mitochondrial proteostasis in PI-resistant tumors (Besse et al., 2019; Tsvetkov et al., 2019) supports the notion that mitochondrial targeting underpins the increased sensitivity of PI-resistant MM cells to JG compounds. Additionally, we are unable to resolve the mechanism by which HSP70 inhibition leads to specific depletion of mitochondrial ribosome subunits. For example, it is possible that depletion occurs downstream of a mitochondrial stress response or that HSP70 is involved in the import, assembly, or maintenance of mitochondrial ribosomes. Therefore, future work is needed to address the mechanisms by which JG compounds lead to depletion of mitoribosome subunits, perturb mitochondrial proteostasis, and drive a potentially non-canonical stress response in myeloma cells. Finally, we acknowledge that the rapid clearance of JG compounds (Fig. S2J) may lead to hurdles in clinical development of these agents for MM treatment. Despite this limitation, our findings suggest that agents preferentially targeting HSPA9, whether of the JG class or different, more pharmacokinetically stable molecules, will be an exciting approach to overcome PI resistance. These conclusions are supported by our survival analysis of CoMMpass patients, revealing a potentially prominent role for HSPA9 in determining patient outcomes under current therapeutic regimens. Furthermore, targeting HSPA9 may confer advantages over other known proteostasis inhibitors in MM, given the lack of compensatory chaperone upregulation after treatment (Fig. 5E, Fig. S5E).
In conclusion, our results support allosterically targeting mitochondrial-localized HSP70 as a promising therapeutic strategy in MM. Our study also reveals global roles of proteostasis networks in the cancer most characterized as highly dependent on this biological process.
STAR METHODS
Lead contact
Further information and requests for resources and reagents should be directed to and will be fulfilled by the lead contact, Arun P. Wiita (arun.wiita@ucsf.edu).
Materials availability
Correspondence and requests for materials should be addressed to the Lead Contact.
Data and code availability
The mass spectrometry proteomics data have been deposited to the ProteomeXchange Consortium via the PRIDE (Perez-Riverol et al., 2019) partner repository with dataset identifiers PXD018617, PXD018387, and PXD032030. RNA sequencing data has been deposited at the Gene Expression Omnibus (GEO) (accession number GSE148659).
Code used for co-dependency and survival analyses is available at https://github.com/YHTLin/MM-proteostasis.
Any additional information required to reanalyze the data reported in this work paper is available from the Lead Contact upon request.
EXPERIMENTAL MODEL AND SUBJECT DETAILS
Cell culture conditions
AMO1 WT, AMO1-BtzR, AMO1-CfzR were kind gifts from Christophe Driessen. U266, JIM-3, KMS12BM, MMM1, LP-1, ANBL6-BtzR, U266-BtzR, RPMI-8226 BtzR, KMM1, KMS18, MM1144 were kind gifts from Brian Van Ness. KMS11 and KMS34 were obtained from the Japanese Collection of Research Bioresources Cell Bank. JJN3, CMK, L363, RPMI-8226, MM.1S, HS27a, and HS5 cells were obtained from ATCC. Cell lines were maintained in RPMI-1640 medium with 10% FBS (Gemini Benchmark). IL-6 dependent cell lines were cultured in the presence of 50 ng/mL recombinant human IL-6 (ProSpec). Proteasome inhibitor resistant cell lines were cultured in 90nM Bortezomib or Carfilzomib as previously described (Mitra et al., 2017; Mitra et al., 2016; Soriano et al., 2016). Cell lines were authenticated by DNA short tandem repeat profiling at ATCC.
Xenograft Mouse Model
In-house NSG mice were obtained from the UCSF preclinical core facility. 1e6 RPMI-8826-mC/Luc myeloma cells stably expressing luciferase were implanted into each mouse via tail vein injection. Mice were randomized into groups and dosed with 3 mg/kg JG342 three times per week starting on day 18. Tumor burden was assessed by bioluminescence imaging. JG342 was delivered by IV injection at a final concentration of 0.5 mg/mL in 5% DMSO, 10% Cremophor RH40 and Saline. All mouse studies were performed according to UCSF Institutional Animal Care and Use Committee-approved protocols.
METHOD DETAILS
DepMap Correlation Analysis
Genetic sensitivity data from genome-wide CRISPR knockout screens for 17,634 genes in 558 cell lines were downloaded from the Cancer Dependency Map (19Q1 Release). Of the 441 manually curated proteostasis genes (see Dataset S1 for gene names and references), 406 were identified in the CRISPR dataset. The list of proteostasis-related genes was manually curated to capture components of major proteostasis pathways we hypothesized to be particularly relevant in multiple myeloma biology and drug response. Using annotated genes, presented in the references of Dataset S1, we have aimed to build a list comprising: 1) major intracellular protein folding chaperones; 2) nucleotide exchange factors and other accessory proteins known to interact with chaperones; 3) VCP/p97 and associated interacting proteins; 4) the ubiquitin-proteasome system. Pearson correlation of the sensitivity scores across all cancer cell lines was computed for every pairwise combination of proteostasis genes. The results were displayed as a 406-by-406 heatmap clustered using the complete-linkage method with Euclidean distances. Interactive heatmaps and additional analyses of gene expression and hybrid CRISPR-vs-expression correlations are accessible through a web-based application built using the Shiny package (version 1.4.0.2) in R (https://tony-lin.shinyapps.io/proteostasis-map/).
Expression-Based Survival Analysis
Survival and gene expression data on CD138+ tumors from myeloma patients were downloaded from the CoMMpass database (Build IA14). The expression dataset in transcripts per million (TPM) for 57,996 genes on 908 patient tumors was filtered to retain only newly-diagnosed patient samples (783 total from 773 unique patients identifiers) and genes with TPM > 1 across all samples. Sample duplicates (10 total) were averaged. Next, the overall and progression-free survival data were stratified by expressions in genes of interest, separating the samples by the top and bottom 20% of TPM levels. Kaplan-Meier curves and log-rank p-values indicating statistical difference in survival between the quintiles were generated using the survival and survminer (version 0.4.6) packages in R. For multiple genes (i.e. mitoribosome analysis), a rank order is first assigned on a per-gene basis followed by averaging the ranks across all genes to obtain an aggregate expression score for sample stratification. To summarize the survival differences based on expression levels for many genes, a volcano plot displaying p-value versus median difference in survival was generated.
Differential Expression Analysis
Expression data for 57,996 genes on 908 CD138+-enriched myeloma patient samples were downloaded from the CoMMpass database (Build IA14). Using the DESeq2 (Love et al., 2014) package in R, differential expression analysis was performed on 50 paired tumors with sample collection at initial diagnosis and upon first relapse. The expression data in counts were submitted as input, and sample pairing was indicated in the design formula. The statistical significance of the difference in gene expression between the newly-diagnosed and relapse samples was plotted against expression fold changes in a volcano plot.
CCLE RNA-sequencing data analysis
Cancer Cell Line Encyclopedia RNA-sequencing data (Barretina et al., 2012) was downloaded from Cancer Dependency Map (file used was CCLE_depMap_19Q1_TPM.csv). Data from cell lines of interest was extracted for analysis in R.
Chemical Synthesis
For the JG compounds used, the same stocks of compounds that have been synthesized and characterized previously (Shao et al., 2018). This paper includes all of the relevant NMR and mass spec characterization data and details on the synthesis. We did not repeat these studies for our experiments here since they were already performed on the same stocks, and did not perform any new synthesis.
Monotherapy and combination dose-response viability assays
For monotherapy dose response assays, cells were seeded in 384 well plates using the Multidrop Combi (Thermo Scientific), with 1000 cells seeded in 45 uL media. Drugs were added 24 hours after seeding and viability was measured using Cell-Titer Glo (Promega) 48 hours after the addition of drugs. Combination assays were conducted similarly to monotherapy, with both drugs added 24 hours after seeding and Cell-Titer Glo assay performed 72 hours after addition of drug. Monotherapy dose response assay measurements were performed in quadruplicate and combination assay measurements were performed in triplicate. ZIP synergy scores were processed using SynergyFinder software (Yadav et al., 2015).
Mitochondria isolation
Mitochondria were isolated with the Mitochondria Isolation Kit for Cultured Cells (Thermo, 89874). Briefly, 20e6 MM1.S or AMO1 myeloma cells were treated with 1 uM JG compound or vehicle for 45 minutes prior to addition of MitoTracker Deep Red (Thermo, M22426) or 50 nM DiIC1(5) (Thermo M34151). After another 45 minutes, cells were harvested, washed with PBS, and 18e6 cells were collected for mitochondria isolation following kit instructions, while 2e6 cells were resuspended in PBS + 5% FBS for flow cytometry. Flow cytometry was performed on BD Cytoflex (Beckman Coulter). Data was analyzed in FlowJo v8.8.6 or FlowJo v10.
Mitochondrial membrane potential
Mitochondrial membrane potential was measured by carbocyanine dye DiIC1(5) ((1,1′,3,3,3′,3′-hexamethylindodicarbo- cyanine iodide) staining and flow cytometry as similarly described ((Perelman et al., 2012), which employs the use of an analogous molecule, the cyanine dye JC-1). Briefly, cells were treated with inhibitors for 24 hours in 96-well plates prior to addition of 50 nM DiIC1(5) (Invitrogen M34151) and 100 uM CCCP (carbonyl cyanide 3-chlorophenylhydrazone, which disrupts mitochondrial membrane potential) to control wells for 30 minutes. Media was removed and cells were resuspended in 5% FBS in D-PBS prior to flow cytometry analysis on BD Cytoflex. Data was analyzed in FlowJo 8.8.6, with a gating strategy including debris and doublet exclusion.
MitoTracker Staining
MitoTracker deep red FM (Invitrogen, M22426) was solubilized in DMSO to yield 100 μM frozen aliquots which were diluted into media to yield a 10 μM stock which was added directly to cell culture media already in the culture yielding a final concentration of 100 nM (to prevent media change derived fluid flow shear stress) 30 min before 4% PFA (MitoTracker red FM was used for PFA fixed samples). Samples were imaged with a Nikon Eclipse Ti spinning disc microscope, Yokogawa CSU-X, Andor Zyla sCMOS, Andor Multi-Port Laser unit, and analyzed with Molecular Devices MetaMorph imaging suite, ImageJ, and ilastik (Gaussian filter).
Cellular Respirometry
Mitochondrial stress tests were performed with a Seahorse XF24e cellular respirometer on non-permeablized cells at ~80% confluence (50k cells/well) in V7 microplates, with XF assay medium supplemented with 1 mM pyruvate (Gibco), 2 mM glutamine (Gibco), and 5 or 25 mM glucose (Sigma) at pH 7.4 and sequential additions via injection ports of Oligomycin (1 μM final), FCCP (1 μM final), and Antimycin A/Rotenone (1 μM final) during respirometry (concentrated stock solutions solubilized in 100% ethanol (2.5 mM) for mitochondrial stress test compounds). OCR values presented with non-mitochondrial oxygen consumption deducted normalized to DMSO control for clarity.
Microscopy
Live cell imaging was performed with Nikon Ti-E Microscope equipped with Yokagawa CSU22 spinning disk using the 100X oil objective. Briefly, HS-5 immortalized bone marrow stromal cells were grown overnight in Ibidi 8-well dishes (80826) or MatTek 35 mm dishes (P35G-1.5-7-C). Cells were treated with 500 or 1000 nM JG98 or JG342 and 500 nM Mitotracker Deep Red (Thermo, M22426) for 30 minutes prior to compound washout and imaging. Image processing was performed in ImageJ and Coloc2 was used for co-localization analysis.
Primary Myeloma patient sample analysis
The myeloma patient bone marrow sample was obtained via a protocol approved by the UCSF Institutional Review Board and with patient informed consent according to principles in the Declaration of Helsinki. Bone marrow mononuclear cells were isolated by Histopaque-1077 (Sigma Aldrich), washed with D-PBS three times and resuspended in RPMI-1640 media supplemented with 10% FBS, 1% penicillin/streptomycin, 2 mM glutamine, and 50 ng/mL recombinant human Il-6 (ProSpec), as previously described (Huang et al, 2020a). Cells were plated at 2E+5 per well in a 96-well plate and treated with DMSO, Bortezomib, or JG342 for 20 hours. Cells were stained with 10 uL Alexa-Fluor 647 mouse anti-human CD138 antibody (BD Pharmingen, catalog# 562097) or Alexa-Fluor 647 IgG κ isotype control (BD Pharmingen, cat# 557714) and 2uL Sytox Green (Thermo, S34860) per mL of FACS buffer (5% FBS in D-PBS). Flow cytometry analysis was performed with a CytoFLEX (Beckman Coulter).
Animal Pharmacokinetics
The animal experiments were carried out in accordance with guidelines of the UCSF Animal Care and Use Committee. Two groups of NSG mice (three each group) were dosed with JG-342 (formulation: 5% DMSO, 10% Cremophor RH 40 and Saline, 0.5 mg/ml) intravenously at 3 mg/kg. Blood samples were collected through tail vein at 5mins, 15 mins, 30 mins, 60 mins, 2h, 6h, 24h, and 48 h time points (4 time points each group). Compound concentrations in plasma were determined by LC-MS/MS, using a previously published protocol (Miyata et al., 2013).
HSPA9 knockdown by CRISPRi
Using previously published approaches (Tian et al., 2019) we first generated two independent sgRNA’s upstream of the HSPA9 transcriptional start site, designed to repress transcription by the CRISPR intereference dCas9-KRAB fusion protein:
g261l (2162 HSPA9_i1 HSPA9_-_137911022.23-P1P2): GTATCATGGCGGATAAATGG
g314l (2163 HSPA9_i2 HSPA9_-_137911079.23-P1P2): GGAGCTGCGCGATGCGGTGG
Lentiviruses encasing g2611, g3141, and scramble guide RNA were generated using LentiX cells. Breifly, 9e5 LentiX cells were seeded into 6-well plates and incubated overnight prior to transfection with pCMV, pMD, and one of g2611, g3141, or scramble using Transfection 5 reagent. Lentivirus supernatants were collected at 72 hours and filtered through 0.45um filters. For knockdown we utilized an RPMI-8226 multiple myeloma cell line (RPMI-8226 JTC) engineered to stably express the dCas9-KRAB CRISPRi construct (Ramkumar et al., 2020b). 1.5e6 RPMI8226 JTC cells were infected with g2611, g3141, and scramble encasing lentiviruses. After two cycles of puromycin selection, 1e6 cells were prepared for Western blotting as described above.
pLEX-HSPA9 cloning
HSPA9 was cloned into lentiviral pLEX donor vector using In-Fusion Snap Assembly Master Mix (Takara) as per manufacturer recommendations. HSPA9 insert was PCR amplified from HSPA9 cDNA (Human ORFeome library v8.1 (Access provided by UCSF Recombinant Antibody Network) and pLEX donor vector was digested using BAMHI-HF (NEB). Insert and vector were gel purified prior to In-Fusion cloning reaction and transformation into Stellar Competent Cells (Takara). For cloning primers see Table S3.
RT-qPCR
MMM1 myeloma cells were treated with 200nm ISRIB, 1uM JG98, and 330nM JG342 or combinations of two drugs for 22 hours. RNA was isolated by TRIzol (Thermo) as per manufacturer recommendations. 1 ug of RNA was used for cDNA construction using iScript™ Reverse Transcription Supermix (Bio-Rad). qPCR was performed using SsoAdvanced™ Universal SYBR® Green Supermix (Bio-Rad) on a StepOnePlus Real-Time PCR system (Applied Biosystems). 18S Ribosomal RNA was used as housekeeping gene. Data analysis was performed using Python. qPCR primer sequences are in Table S3.
RNA-sequencing and data analysis
RNA extraction, library preparation, and sequencing were performed at BGI (Shenzhen, China). Samples were sequenced using the BGISEQ-500 platform, with an average of 25.75 million reads per sample. For genome mapping, clean reads were mapped to reference genome using HISAT (Kim et al., 2015) with an average of 94.2% mapping across samples. For gene expression analysis, clean reads were mapped to reference transcripts using Bowtie2 (Langmead and Salzberg, 2012) and expression levels calculated using RSEM (Li and Dewey, 2011). Transcripts per million (TPM) were used for data analysis performed in R.
Western blot sample preparation and analysis
For unfolded protein response and chaperone regulation blots, MM1.S cells were seeded at a density of 1e6/mL and treated with 2 or 3 μM JG342 or 3 μM JG98 for 2, 4, 8, 16, or 24 hours as indicated in figure legends. Puromycin treatment at 1 μM was performed at 37 C for 1 hour prior to collection. Cells were collected and washed with PBS, flash frozen, and stored at −80C prior to lysis and western blot analysis. For Puromycin incorporation western blot, 5e6 KMS34 cells were plated in 5mLs of media in 6-well plates and treated for 22 hours with 2μM JG98, 7.5nM Bortezomib, 1μM CB-5083, 500nM DMAG, or DMSO. At 21 hours, cells were treated with 1μM Puromycin (Thermo A1113803) for 1 hour prior to harvest, PBS wash, and storage at −80C. Cells pellets were lysed in 1X RIPA lysis buffer (Millipore) with HALT protease and phosphatase inhibitors (Thermo 78430), incubated on ice for 15 minutes, sonicated for 15 seconds at 1 Hz cycles on ice, and cleared by centrifugation at 17000xg for 10 minutes at 4C. Western blots were performed as previously described (Huang et al., 2020a). Primary antibodies for immunoblotting were obtained from Cell Signaling (α-PERK 5683S, α-CHOP 2895S, α-Cleaved Caspase 3 9644T, α-B-actin 3700S, α-HSPA5 3183S, α-HSPA9 3593S, α-HSPA8 8444S, α-MRPL11 2066S, α-SOD2 13141T, α-RPS6 5G10), Kerafast (α-Puromycin EQ001), and Biolegend (α-XBP1-S 143F) and used at manufacturer recommended dilutions. Ponceau-S (Thermo BP10310) and total protein stain or anti-β-actin were used as loading controls for immunoblots as indicated in figure legends.
Drug treatments for mass spectrometry samples
For experiments outlined in Figure 4A, 5e6 cells were seeded in 5 mL media in 6-well plates and treated with compounds for 22 hours at the following concentrations: MM1.S cells were treated with 1.75 μM JG98, 2.5 nM bortezomib, 1 μM CB-5083, 150 nM DMAG, or DMSO. RPMI-8226 cells were treated with 1.5 μM JG98, 7.5 nM bortezomib, 1 μM CB-5083, 200 nM DMAG, or DMSO. KMS34 cells were treated with 2 μM JG98, 7.5 nM Bortezomib, 1 μM CB-5083, 500 nM DMAG, or DMSO. Cells were harvested and washed with PBS, snap frozen in liquid nitrogen, and stored at −80C. For pulsed-SILAC experiments, MM1.S cells were grown in Light SILAC media for at least six passages to allow complete labeling and adaptation to dialyzed FBS. At time = 0, cells were exchanged to Heavy SILAC media with 350nM JG342 or DMSO. Cells were collected at 16, 21, and 26 time points, washed with PBS, snap frozen, and stored at −80C. Light and Heavy SILAC media were composed as follows: Thermo RPMI media for SILAC (88365) supplemented with 10% dialyzed FBS, 70 mg/L Lysine (Sigma) or L-Lysine-13C6,15N2 (Cambridge Isotope), 40mg/L Arginine (Sigma) or L-Arginine-13C6,15N4 (Cambridge Isotope), 200mg/L Proline (Sigma), and 1% PenStrep. AMO1-BtzR cells were treated with 800nM JG98, 400nM JG342, 200nM DMAG, 800nM CB-5083, or DMSO for 22 hours.
Mass Spectrometry sample preparation
Cell pellets were lysed in 6M GdnHCL, 0.1M Tris pH 8.5, with 5mM TCEP and 10mM 2-chloro acetamide. Lysates were sonicated for 45 seconds at 1 Hz cycles on ice and cleared by centrifugation at 16000g for 10 minutes at 4C. Protein concentration was measured with 660 assay (Pierce 22660) and 100 μg protein was digested with 2 μg Trypsin (Pierce 90057) for 18–22 hours with digestion halted by addition of TFA to 1% vol/vol. Acidified samples were centrifuged at 17,200g for 5 minutes at RT to remove precipitate. Cleared samples were desalted on SOLA columns (Thermo 60109001) according to manufacturer instructions and eluted in 50% Acetonitrile with 0.1% FA and vacuum dried prior to storage at −80C. Miniaturized TMT labeling was performed based on modified protocol (Zecha et al., 2019). Briefly, peptide concentrations were measured using the Pierce Peptide Colormetric Assay (Pierce 23275). 20 ug peptides were resuspended in 17.5 uL 50 mM HEPES pH 8.5 and labeled with 50 μg TMT reagent dissolved in 2.5 μL Acetonitrile for 1 hour at 25C and 500 rpm. Reactions were quenched by adding hydroxylamine to final concentration of 0.4% and incubation for 15 min at 500 rpm. TMT labeled samples were combined, acidified by addition of 0.1% TFA, vacuum dried, and stored at −80C.
High pH fractionations
For 7-plex pSILAC-TMT, peptides were subjected to high pH fractionation using an XBridge C18 column (1.0×100mm, 3.5um, Waters) on a Waters 2796 Bioseparations Module HPLC machine with non-linear gradient designed as follows: start at 90% Buffer A (5% Acetonitrile, 10mM TEAB) and 10% Buffer B (90% Acetonitrile, 10mM TEAB), ramp to 15% B over 8 minutes, ramp to 27.7% B over 22 minutes, ramp to 46.6%B over 14 minutes, ramp to 55% B over 4 minutes, ramp 90% B over 6 minutes for column wash prior to re-equilibration. Fractions were collected every 30 seconds and every 10th fraction was combined for a final 10 fractions for mass spectrometry analysis. For 10-plex TMT shotgun experiments, peptides were fractionated using a High pH Reversed-Phase Fractionation kit (Pierce, 84868). Briefly, columns were prepared with two acetonitrile washes, followed by two 0.1% TFA washes. Samples were loaded onto the column and washed with HPLC grade water. Peptides were eluted in 8 fractions – 10%, 12.5%, 17.5%, 20%, 22.5%, 25%, and 50% acetonitrile, 0.1% triethylamine. Samples were then vacuum dried and resuspended in 2% Acetonitrile, 0.1% formic acid for mass spec analysis.
LC-MS/MS operation
For 7-plex pulsed SILAC-TMT LC-MS/MS, 500 ng of peptides were injected into Easy-Spray reversed phase column (Thermo ES800) on a nanoACQUITY UPLC (Waters) coupled to a Fusion Lumos Mass Spectrometer (Thermo) with the following non-linear gradient in which A is 0.1% Formic Acid and B is Acetonitrile plus 0.1% Formic Acid: 8% B to 30% B for 110 minutes, 30% B to 50% B for 20 minutes, 50% B to 70% B for 5 minutes, 70% B to 80% B for 1 minute, and 8% B for 7 minutes to re-equilibrate. For MS1 data acquisition, scan range was set to 375–1500 m/z, AGC target was set to 4e5, and maximum injection time (IT) was set to 50ms. For MS2 data acquisition, isolation window was set to 0.7 m/z, with HCD energy set to 38 percent, orbitrap resolution was set to 50000, and AGC target was set to 1.0e5. For 10-plex TMT shotgun experiments, 1 μg of peptides were injected into a Dionex Ultimate 3000 NanoRSLC instrument with 15-cm Acclaim PEPMAP C18 (Thermo, 164534) reverse phase column coupled to a Thermo Q Exactive Plus mass spectrometer. HPLC non-linear gradient was as follows with buffer A 0.1% FA and buffer B 0.1% FA in 80% Acetonitrile: 3–8% B for 11 minutes, 8–34% B for 80 minutes, 34–50% B for 15 minutes, 50–70% B for 5 minutes with hold at 70% for 3 minutes, and 99% B column wash for 4 minutes prior to re-equilibration for 13 minutes. For MS1 acquisition, spectra were collected in data dependent top 15 method with full MS scan resolution of 70,000, AGC target was set to 3e6, and maximum IT set to 50ms. For MS2 acquisition, resolution was set to 35,000, AGC set to 1e5, and maximum IT to 100ms with Normalized Collison energy of 32.
Proteomic data analysis and quantification
Mass spectrometry data was processed in Maxquant (Tyanova et al., 2016a) version 1.6.2.1 with the following settings: PSM/Protein FDR were set to 0.01, Carbidomethylation was set as fixed modification and methionine oxidation and N-terminal acetylation were set as variable modifications, minimum peptide length = 7, matching time window set to 0.7 min, alignment time window set to 20 min, and match between runs was used, along with other default settings. Data was searched against the Uniprot Swiss-Prot human proteome (ID:9606, downloaded from Uniprot in 2018). For TMT-pSILAC multiplexing analysis, separate parameter groups were used for heavy and light labeled protein analysis run in the same MS2 experiment using the isobaric labels function in Maxquant. For the heavy parameter group, heavy arginine was set as fixed modification and heavy lysine modifications were added into TMT-tag masses without altering the diagnostic peaks, which denote the TMT cleaved label masses. Proteingroups files were exported from Maxquant, filtered to remove contaminants, and filtered for proteins with at least two unique peptides for analysis. For TMT-pSILAC data analysis the razor peptide was included for unique peptide count threshold. Data analysis was performed in Perseus (Tyanova et al., 2016b) and R. Subcellular compartment gene lists were downloaded from Uniprot and restricted to reviewed entries.
Gene Ontology (GO) Analysis
Panther Overrepresentation Tests (Release 20190711) were performed on RNA-sequencing data. Gene Ontology database used was released (2019-10-09), and FISHER test with FDR correction were used. For RNA-sequencing data, only genes with at least one measured TPM greater than 5 and no zero TPM values were used for background (10212 genes in background list). From this subset, genes with log2 fold changes greater than or equal to 1 in both replicates were considered as significantly upregulated and included in the analysis list.
Gene Set Enrichment Analysis (GSEA)
GSEA software (Subramanian et al., 2005) was downloaded from https://www.gsea-msigdb.org/. Median normalized TMT mass spec data across three cell lines (experiment outline in 4a) was used for input (4033 genes). Gene set used was h.all.v6.2.symbols.gmt.
QUANTIFICATION AND STATISTICAL ANALYSIS
Unless otherwise stated, t-tests are two-sided Welch’s t-tests. Data analysis was performed using Graphpad Prism (GraphPad Software), R, or Python. For TMT-proteomics and RNA-sequencing, two biological replicates per condition were collected. Monotherapy drug screen data is the average of four technical replicates and error bars are standard deviations. For combination drug screens (data underlying Fig. S3E–F), data for three technical replicates were obtained. For all drug screens technical replicates are defined as independent wells of a multi-well plate from a single assay. For tumor RNA expression analysis, log-rank test was used to determine significance. For other experiments details on the number of technical and biological replicates can be found in the figure legends.
Supplementary Material
Dataset S1. Proteostasis Gene Lists, related to Figure 1A (attached as Excel file): Curated list of genes included in proteostasis mapping.
Dataset S2. TMT Proteomics PI-sensitive cells, related to Figure 3A–C (attached as Excel file): Proteomic data results from TMT shotgun proteomics experiments in MM.1S, KMS34, and RPMI-8226 cells.
Dataset S3. Pulsed-SILAC-TMT proteomics, related to Figure 4 (attached as Excel file): Proteomic data results from TMT-pSILAC proteomics experiments.
Dataset S4. TMT Proteomics PI-resistant cells, related to Figure S3D (attached as Excel file): Proteomic data results from TMT shotgun proteomics experiments in AMO1-BtzR cells.
Supplementary Information File
Table S3. Oligonucleotide Sequences, related to STAR Methods. Included as an excel spreadsheet (Table S3 Oligonucleotide Sequences.xlsx).
Key resources table.
| REAGENT or RESOURCE | SOURCE | IDENTIFIER |
|---|---|---|
| Antibodies | ||
| Rabbit monoclonal anti-PERK | Cell Signaling | Cell Signaling Technology Cat# 5683, RRID:AB_10841299) |
| Mouse monoclonal anti-CHOP | Cell Signaling | Cell Signaling Technology Cat# 2895, RRID:AB_2089254 |
| Rabbit monoclonal anti-Cleaved Caspase-3 | Cell Signaling | Cell Signaling Technology Cat# 9664, RRID:AB_2070042 |
| Mouse monoclonal anti-beta-actin | Cell Signaling | Cell Signaling Technology Cat# 3700, RRID:AB_2242334 |
| Rabbit polyclonal anti-BiP (HSPA5) | Cell Signaling | Cell Signaling Technology Cat# 3183, RRID:AB_10695864 |
| Rabbit monoclonal anti-HSPA9 | Cell Signaling | Cell Signaling Technology Cat# 3593, RRID:AB_2120328 |
| Rabbit monoclonal anti-HSPA8 | Cell Signaling | Cell Signaling Technology Cat# 8444, RRID:AB_10831837 |
| Rabbit monoclonal anti-MRPL11 | Cell Signaling | Cell Signaling Technology Cat# 2066, RRID:AB_2145598 |
| Rabbit monoclonal anti-SOD2 | Cell Signaling | Cell Signaling Technology Cat# 13141, RRID:AB_2636921 |
| Rabbit monoclonal anti-S6 Ribosomal Protein | Cell Signaling | Cell Signaling Technology Cat# 2217, RRID:AB_331355 |
| Anti-Puromycin | Kerafast | Kerafast [3RH11] Cat# EQ0001 |
| Mouse monoclonal anti-XBP-1s | BioLegend | BioLegend Cat# 647501, RRID:AB_2241744 |
| Bacterial and virus strains | ||
| Stellar Competent Cells | Takara | Takara Cat# 636765 |
| Biological samples | ||
| Myeloma Patient Bone Marrow | UCSF Hematologic Malignancies Tissue Bank | N/A |
| Chemicals, peptides, and recombinant proteins | ||
| JG Compounds (JG193, JG194, JG220, JG231, JG240, JG274, JG285, JG300, JG332, JG342, JG345, JG351, JG361, JG366, JG375, JG98, JG258) | Gift from Jason Gestwicki | N/A |
| Bortezomib | Selleck Chemicals | Selleck Chemicals Cat#S1013 |
| Carfilzomib | Selleck Chemicals | Selleck Chemicals Cat#S2853 |
| 17-DMAG | Sigma Aldrich | Sigma Cat#D5193 |
| ISRIB | Sigma Aldrich | Sigma Cat#SML0843 |
| CB-5083 | Gift from Cleave Biosciences | N/A |
| Mitotracker Deep Red | Invitrogen | Thermo Cat#M22426 |
| Histopaque-1077 | Sigma Aldrich | Sigma Cat#10771 |
| TRIzol | Invitrogen | Thermo Cat#15596026 |
| TCEP-HCL | Gold Biosciences | Gold Catalog ID TCEP |
| SsoAdvanced Universal SYBR Green Supermix | Bio-Rad | Bio-Rad Cat#1725272 |
| iScript™ Reverse Transcription Supermix for RT-qPCR | Bio-Rad | Bio-Rad Cat#1708840 |
| In-Fusion Snap Assembly Master Mix | Takara | Takara Cat#638944 |
| BAMHI-HF | New England Biosciences (NEB) | NEB Cat#R3136S |
| Critical commercial assays | ||
| Mitochondria Isolation Kit for Cultured Cells | Thermo Scientific | Thermo Cat# 89874 |
| MitoProbe™ DiIC1(5) Mitochondrial Membrane Potential Protocol | Thermo Scientific | Thermo Cat#M34151 |
| Deposited data | ||
| Proteomics data, deposited to PRIDE, identifiers PXD018617, PXD018387, and PXD032030 | PRIDE Proteomics Identifications Database (EMBL) | Proteomics data, deposited to PRIDE, identifiers PXD018617, PXD018387, and PXD032030 |
| RNA-sequencing data | Gene Expression Omnibus (GEO) | RNA-sequencing data |
| Experimental models: Cell lines | ||
| MM.1S | ATCC | ATCC Cat#CRL-2974 |
| RPMI-8226 | DSMZ | DSMZ ACC 402 |
| KMS34 | Japanese Collection of Research Bioresources Cell Bank | JCRB1195 |
| AMO1 | Gift from Christophe Driessen | N/A |
| AMO1-BtzR | Gift from Christophe Driessen | N/A |
| AMO1-CfzR | Gift from Christophe Driessen | N/A |
| JJN3 | DSMZ | DSMZ Cat#ACC 541 |
| KMS11 | Japanese Collection of Research Bioresources Cell Bank | JCRB1179 |
| L363 | DSMZ | DSMZ ACC 49 |
| HS5 | ATCC | ATCC Cat#CRL-11882 |
| HS27a | ATCC | ATCC Cat#CRL-2496 |
| U266 | Gift from Brian Van Ness | N/A |
| JIM-3 | Gift from Brian Van Ness | N/A |
| KMS12BM | Gift from Brian Van Ness | N/A |
| MMM1 | Gift from Brian Van Ness | N/A |
| LP-1 | Gift from Brian Van Ness | N/A |
| ANBL6-BtzR | Gift from Brian Van Ness | N/A |
| U266-BtzR | Gift from Brian Van Ness | N/A |
| RPMI-8226 BtzR | Gift from Brian Van Ness | N/A |
| KMM1 | Gift from Brian Van Ness | N/A |
| KMS18 | Gift from Brian Van Ness | N/A |
| MM1144 | Gift from Brian Van Ness | N/A |
| CMK | DSMZ | DSMZ Cat#ACC 392 |
| Oligonucleotides - See Table S3. Oligonucleotide Sequences.xlsx | ||
| Recombinant DNA | ||
| cDNA HSPA9 | Human ORFeome library v8.1 (Access 10 provided by UCSF Recombinant Antibody Network) | HsCD00514475 |
| pLEX donor vector without uORF | Gift from Paul A. Khavari | N/A |
| p8.91 lentiviral packaging plasmid | Gift from Paul A. Khavari | N/A |
| pMD2.G (Addgene Plasmid #12259) lentiviral packaging plasmid | Gift from Paul A. Khavari | N/A |
| pcep4-TAT lentiviral packaging plasmid | Gift from Paul A. Khavari | N/A |
| Software and algorithms | ||
| MaxQuant version 1.6.2.1 | Max-Planck Institute of Biochemistry, Computational Systems Biochemistry | MaxQuant version 1.6.2.1 |
| FlowJo version 8.8.6 | FlowJo | FlowJo version 8.8.6 |
Significance:
Multiple myeloma is a cancer of plasma cells that remains incurable. While proteasome inhibitors (PIs), a critical front-line therapy in this disease, typically drive strong initial responses, all patients eventually relapse. Identifying new strategies to overcome PI resistance remains a pressing need in this disease. Here, we find that a class of benzothiazole rhodacyanine allosteric inhibitors of HSP70 (“JG” compounds) exhibit both broad anti-myeloma activity and increased efficacy against PI-resistant myeloma models. We use multiple methods of quantitative mass spectrometry, not previously applied in myeloma, to delineate downstream impacts of JG compounds versus other known proteostasis inhibitors in this disease. Contrary to expectations from prior myeloma literature, our data suggest that inhibition of mitochondria-localized HSP70 (HSPA9/mortalin) is the primary driver of the unique phenotype leading to increased JG sensitivity in PI-resistant models. Analysis of genome-wide CRISPR screen data as well as data from primary patient tumors further supports the importance of HSPA9/mortalin, and, more broadly, global proteostasis networks, in determining response and resistance to PIs. Our results suggest a new strategy for overcoming PI resistance and motivate future mechanistic and preclinical investigation of HSPA9/mortalin inhibition in myeloma.
Highlights.
JGs have increased potency against proteasome-inhibitor resistant multiple myeloma
JG compounds accumulate in mitochondria and lead to depletion of mitoribosome subunits
Patient data reveals HSPA9 expression as determinant of response to proteasome inhibitors
Acknowledgments:
We thank Drs. Tom Martin, Nina Shah, Sandy Wong, and Jeffrey Wolf for insightful discussions, Multiple Myeloma Research Foundation for sponsoring the CoMMpass study, Dr. Martin Kampmann for providing sgRNA sequences for HSPA9 knockdown and CRISPRi cell line, Dr. Juan A. Oses-Prieto and the UCSF Mass Spectrometry Facility, and Dr. DeLaine Larsen and Dr. Kari Herrington and the UCSF Nikon Imaging Core for insightful discussions and technical assistance. Funding for this study was provided by Gabrielle’s Angel Foundation for Cancer Research, UCSF Stephen and Nancy Grand Multiple Myeloma Translational Initiative, NIH DP2 OD022552, K08 CA184116, and R01 CA226851 (to A.P.W.), F32CA236156 (to K.M.T), R01 NS059690 and DoD PC180716 (to J.G.), and NIH P30 CA082103 (to B.H.).
Footnotes
Declaration of Interests: J.E.G. and H.S. have filed a patent related to the structures of the JG compounds. A.P.W is an equity holder and scientific advisory board member of Indapta Therapeutics and Protocol Intelligence. The other authors declare no relevant conflicts of interest.
Publisher's Disclaimer: This is a PDF file of an unedited manuscript that has been accepted for publication. As a service to our customers we are providing this early version of the manuscript. The manuscript will undergo copyediting, typesetting, and review of the resulting proof before it is published in its final form. Please note that during the production process errors may be discovered which could affect the content, and all legal disclaimers that apply to the journal pertain.
REFERENCES:
- Acosta-Alvear D, Cho MY, Wild T, Buchholz TJ, Lerner AG, Simakova O, Hahn J, Korde N, Landgren O, Maric I, et al. (2015). Paradoxical resistance of multiple myeloma to proteasome inhibitors by decreased levels of 19S proteasomal subunits. eLife 4, e08153. [DOI] [PMC free article] [PubMed] [Google Scholar]
- Anderson DJ, Le Moigne R, Djakovic S, Kumar B, Rice J, Wong S, Wang J, Yao B, Valle E, Kiss von Soly S, et al. (2015). Targeting the AAA ATPase p97 as an Approach to Treat Cancer through Disruption of Protein Homeostasis. Cancer Cell 28, 653–665. [DOI] [PMC free article] [PubMed] [Google Scholar]
- Barretina J, Caponigro G, Stransky N, Venkatesan K, Margolin AA, Kim S, Wilson CJ, Lehar J, Kryukov GV, Sonkin D, et al. (2012). The Cancer Cell Line Encyclopedia enables predictive modelling of anticancer drug sensitivity. Nature 483, 603–607. [DOI] [PMC free article] [PubMed] [Google Scholar]
- Barrio S, Stuhmer T, Da-Via M, Barrio-Garcia C, Lehners N, Besse A, Cuenca I, Garitano-Trojaola A, Fink S, Leich E, et al. (2019). Spectrum and functional validation of PSMB5 mutations in multiple myeloma. Leukemia 33, 447–456. [DOI] [PubMed] [Google Scholar]
- Besse A, Stolze SC, Rasche L, Weinhold N, Morgan GJ, Kraus M, Bader J, Overkleeft HS, Besse L, and Driessen C (2018). Carfilzomib resistance due to ABCB1/MDR1 overexpression is overcome by nelfinavir and lopinavir in multiple myeloma. Leukemia 32, 391–401. [DOI] [PMC free article] [PubMed] [Google Scholar]
- Besse L, Besse A, Mendez-Lopez M, Vasickova K, Sedlackova M, Vanhara P, Kraus M, Bader J, Ferreira RB, Castellano RK, et al. (2019). A metabolic switch in proteasome inhibitor-resistant multiple myeloma ensures higher mitochondrial metabolism, protein folding and sphingomyelin synthesis. Haematologica 104, e415–e419. [DOI] [PMC free article] [PubMed] [Google Scholar]
- Candas D, and Li JJ (2014). MnSOD in oxidative stress response-potential regulation via mitochondrial protein influx. Antiox Redox Sig 20, 1599–1617. [DOI] [PMC free article] [PubMed] [Google Scholar]
- Chitta K, Paulus A, Akhtar S, Blake MK, Caulfield TR, Novak AJ, Ansell SM, Advani P, Ailawadhi S, Sher T, et al. (2015). Targeted inhibition of the deubiquitinating enzymes, USP14 and UCHL5, induces proteotoxic stress and apoptosis in Waldenstrom macroglobulinaemia tumour cells. Br J Haematol 169, 377–390. [DOI] [PMC free article] [PubMed] [Google Scholar]
- Das DS, Das A, Ray A, Song Y, Samur MK, Munshi NC, Chauhan D, and Anderson KC (2017). Blockade of Deubiquitylating Enzyme USP1 Inhibits DNA Repair and Triggers Apoptosis in Multiple Myeloma Cells. Clin Cancer Res 23, 4280–4289. [DOI] [PMC free article] [PubMed] [Google Scholar]
- Eftekharzadeh B, Banduseela VC, Chiesa G, Martínez-Cristóbal P, Rauch JN, Nath SR, Schwarz DMC, Shao H, Marin-Argany M, Di Sanza C, et al. (2019). Hsp70 and Hsp40 inhibit an inter-domain interaction necessary for transcriptional activity in the androgen receptor. Nat Commun 10, 3562. [DOI] [PMC free article] [PubMed] [Google Scholar]
- Egorin MJ, Lagattuta TF, Hamburger DR, Covey JM, White KD, Musser SM, and Eiseman JL (2002). Pharmacokinetics, tissue distribution, and metabolism of 17-(dimethylaminoethylamino)-17-demethoxygeldanamycin (NSC 707545) in CD2F1 mice and Fischer 344 rats. Cancer Chemotherap Pharmacol 49, 7–19. [DOI] [PubMed] [Google Scholar]
- Eugenio AIP, Fook-Alves VL, de Oliveira MB, Fernando RC, Zanatta DB, Strauss BE, Silva MRR, Porcionatto MA, and Colleoni GWB (2017). Proteasome and heat shock protein 70 (HSP70) inhibitors as therapeutic alternative in multiple myeloma. Oncotarget 8, 114698–114709. [DOI] [PMC free article] [PubMed] [Google Scholar]
- Farrell ML, and Reagan MR (2018). Soluble and Cell-Cell-Mediated Drivers of Proteasome Inhibitor Resistance in Multiple Myeloma. Front Endocrinol 9, 218. [DOI] [PMC free article] [PubMed] [Google Scholar]
- Fontaine SN, Rauch JN, Nordhues BA, Assimon VA, Stothert AR, Jinwal UK, Sabbagh JJ, Chang L, Stevens SM Jr., Zuiderweg ER, et al. (2015). Isoform-selective Genetic Inhibition of Constitutive Cytosolic Hsp70 Activity Promotes Client Tau Degradation Using an Altered Co-chaperone Complement. J Biol Chem 290, 13115–13127. [DOI] [PMC free article] [PubMed] [Google Scholar]
- Gabai VL, Yaglom JA, Wang Y, Meng L, Shao H, Kim G, Colvin T, Gestwicki J, and Sherman MY (2016). Anticancer Effects of Targeting Hsp70 in Tumor Stromal Cells. Cancer Res 76, 5926–5932. [DOI] [PMC free article] [PubMed] [Google Scholar]
- Guo X, Aviles G, Liu Y, Tian R, Unger BA, Lin YT, Wiita AP, Xu K, Correia MA, and Kampmann M (2020). Mitochondrial stress is relayed to the cytosol by an OMA1-DELE1-HRI pathway. Nature 579, 427–432. [DOI] [PMC free article] [PubMed] [Google Scholar]
- Huang HH, Ferguson ID, Thornton AM, Lam C, Lin Y-H, Bastola P, Mariano MC, Marcoulis MD, Malato J, Phojanakong P, et al. (2020a). Proteasome inhibitor-induced modulation reveals the spliceosome as a specific therapeutic vulnerability in multiple myeloma. Nat Commun 11, 1931. [DOI] [PMC free article] [PubMed] [Google Scholar]
- Huang L, Wang Y, Bai J, Yang Y, Wang F, Feng Y, Zhang R, Li F, Zhang P, Lv N, et al. (2020b). Blockade of HSP70 by VER-155008 synergistically enhances bortezomib-induced cytotoxicity in multiple myeloma. Cell Stress Chaperones 25, 357–367. [DOI] [PMC free article] [PubMed] [Google Scholar]
- Kambhampati S, and Wiita AP (2020). Lessons Learned from Proteasome Inhibitors, the Paradigm for Targeting Protein Homeostasis in Cancer. Adv Exp Med Biol 1243, 147–162. [DOI] [PubMed] [Google Scholar]
- Kim D, Langmead B, and Salzberg SL (2015). HISAT: a fast spliced aligner with low memory requirements. Nat Methods 12, 357–360. [DOI] [PMC free article] [PubMed] [Google Scholar]
- Lam C, Ferguson ID, Mariano MC, Lin Y-HT, Murnane M, Liu H, Smith GA, Wong SW, Taunton J, Liu JO, et al. (2018). Repurposing tofacitinib as an anti-myeloma therapeutic to reverse growth-promoting effects of the bone marrow microenvironment. Haematologica 103, 1218–1228. [DOI] [PMC free article] [PubMed] [Google Scholar]
- Langmead B, and Salzberg SL (2012). Fast gapped-read alignment with Bowtie 2. Nat Methods 9, 357–359. [DOI] [PMC free article] [PubMed] [Google Scholar]
- Le Moigne R, Aftab BT, Djakovic S, Dhimolea E, Valle E, Murnane M, King EM, Soriano F, Menon MK, Wu ZY, et al. (2017). The p97 inhibitor CB-5083 is a unique disrupter of protein homeostasis in models of Multiple Myeloma. Mol Cancer Ther 16, 2375–2386. [DOI] [PubMed] [Google Scholar]
- Leung-Hagesteijn C, Erdmann N, Cheung G, Keats JJ, Stewart AK, Reece DE, Chung KC, and Tiedemann RE (2013). Xbp1s-negative tumor B cells and pre-plasmablasts mediate therapeutic proteasome inhibitor resistance in multiple myeloma. Cancer Cell 24, 289–304. [DOI] [PMC free article] [PubMed] [Google Scholar]
- Li B, and Dewey CN (2011). RSEM: accurate transcript quantification from RNA-Seq data with or without a reference genome. BMC Bioinformatics 12, 323. [DOI] [PMC free article] [PubMed] [Google Scholar]
- Li X, Colvin T, Rauch JN, Acosta-Alvear D, Kampmann M, Dunyak B, Hann B, Aftab BT, Murnane M, Cho M, et al. (2015). Validation of the Hsp70-Bag3 protein-protein interaction as a potential therapeutic target in cancer. Mol Cancer Ther 14, 642–648. [DOI] [PMC free article] [PubMed] [Google Scholar]
- Li X, Srinivasan SR, Connarn J, Ahmad A, Young ZT, Kabza AM, Zuiderweg ER, Sun D, and Gestwicki JE (2013). Analogs of the Allosteric Heat Shock Protein 70 (Hsp70) Inhibitor, MKT-077, as Anti-Cancer Agents. ACS Med Chem Lett 4, 1042–1047. [DOI] [PMC free article] [PubMed] [Google Scholar]
- Love MI, Huber W, and Anders S (2014). Moderated estimation of fold change and dispersion for RNA-seq data with DESeq2. Genome Biol 15, 550. [DOI] [PMC free article] [PubMed] [Google Scholar]
- Manasanch EE, and Orlowski RZ (2017). Proteasome inhibitors in cancer therapy. Nat Rev Clin Oncol. 14, 417–433. [DOI] [PMC free article] [PubMed] [Google Scholar]
- Marciniak SJ, Yun CY, Oyadomari S, Novoa I, Zhang Y, Jungreis R, Nagata K, Harding HP, and Ron D (2004). CHOP induces death by promoting protein synthesis and oxidation in the stressed endoplasmic reticulum. Genes Dev 18, 3066–3077. [DOI] [PMC free article] [PubMed] [Google Scholar]
- Misiewicz-Krzeminska I, de Ramon C, Corchete LA, Krzeminski P, Rojas EA, Isidro I, Garcia-Sanz R, Martinez-Lopez J, Oriol A, Blade J, et al. (2020). Quantitative expression of Ikaros, IRF4, and PSMD10 proteins predicts survival in VRD-treated patients with multiple myeloma. Blood Adv 4, 6023–6033. [DOI] [PMC free article] [PubMed] [Google Scholar]
- Mitra AK, Harding T, Mukherjee UK, Jang JS, Li Y, HongZheng R, Jen J, Sonneveld P, Kumar S, Kuehl WM, et al. (2017). A gene expression signature distinguishes innate response and resistance to proteasome inhibitors in multiple myeloma. Blood Cancer J 7, e581. [DOI] [PMC free article] [PubMed] [Google Scholar]
- Mitra AK, Mukherjee UK, Harding T, Jang JS, Stessman H, Li Y, Abyzov A, Jen J, Kumar S, Rajkumar V, et al. (2016). Single-cell analysis of targeted transcriptome predicts drug sensitivity of single cells within human myeloma tumors. Leukemia 30, 1094–1102. [DOI] [PubMed] [Google Scholar]
- Mitsiades N, Mitsiades CS, Poulaki V, Chauhan D, Fanourakis G, Gu X, Bailey C, Joseph M, Libermann TA, Treon SP, et al. (2002). Molecular sequelae of proteasome inhibition in human multiple myeloma cells. Proc Natl Acad Sci USA 99, 14374–14379. [DOI] [PMC free article] [PubMed] [Google Scholar]
- Miyata Y, Li X, Lee HF, Jinwal UK, Srinivasan SR, Seguin SP, Young ZT, Brodsky JL, Dickey CA, Sun D, et al. (2013). Synthesis and initial evaluation of YM-08, a blood-brain barrier permeable derivative of the heat shock protein 70 (Hsp70) inhibitor MKT-077, which reduces tau levels. ACS Chem Neurosci 4, 930–939. [DOI] [PMC free article] [PubMed] [Google Scholar]
- Modica-Napolitano JS, and Aprille JR (2001). Delocalized lipophilic cations selectively target the mitochondria of carcinoma cells. Adv Drug Deliv Rev 49, 63–70. [DOI] [PubMed] [Google Scholar]
- Moses MA, Kim YS, Rivera-Marquez GM, Oshima N, Watson MJ, Beebe KE, Wells C, Lee S, Zuehlke AD, Shao H, et al. (2018). Targeting the Hsp40/Hsp70 Chaperone Axis as a Novel Strategy to Treat Castration-Resistant Prostate Cancer. Cancer Res 78, 4022–4035. [DOI] [PMC free article] [PubMed] [Google Scholar]
- Mulligan G, Mitsiades C, Bryant B, Zhan F, Chng WJ, Roels S, Koenig E, Fergus A, Huang Y, Richardson P, et al. (2007). Gene expression profiling and correlation with outcome in clinical trials of the proteasome inhibitor bortezomib. Blood 109, 3177–3188. [DOI] [PubMed] [Google Scholar]
- Nikesitch N, and Ling SC (2016). Molecular mechanisms in multiple myeloma drug resistance. J Clin Pathol 69, 97–101. [DOI] [PMC free article] [PubMed] [Google Scholar]
- Obeng EA, Carlson LM, Gutman DM, Harrington WJ Jr., Lee KP, and Boise LH (2006). Proteasome inhibitors induce a terminal unfolded protein response in multiple myeloma cells. Blood 107, 4907–4916. [DOI] [PMC free article] [PubMed] [Google Scholar]
- Pakos-Zebrucka K, Koryga I, Mnich K, Ljujic M, Samali A, and Gorman AM (2016). The integrated stress response. EMBO Rep 17, 1374–1395. [DOI] [PMC free article] [PubMed] [Google Scholar]
- Perelman A, Wachtel C, Cohen M, Haupt S, Shapiro H, and Tzur A (2012). JC-1: alternative excitation wavelengths facilitate mitochondrial membrane potential cytometry. Cell Death Dis 3, e430. [DOI] [PMC free article] [PubMed] [Google Scholar]
- Perez-Riverol Y, Csordas A, Bai J, Bernal-Llinares M, Hewapathirana S, Kundu DJ, Inuganti A, Griss J, Mayer G, Eisenacher M, et al. (2019). The PRIDE database and related tools and resources in 2019: improving support for quantification data. Nucleic Acids Res 47, D442–D450. [DOI] [PMC free article] [PubMed] [Google Scholar]
- Ramkumar P, Abarientos AB, Tian R, Seyler M, Leong JT, Chen M, Choudhry P, Hechler T, Shah N, Wong SW, et al. (2020a). CRISPR-based screens uncover determinants of immunotherapy response in multiple myeloma. Blood Adv 4, 2899–2911. [DOI] [PMC free article] [PubMed] [Google Scholar]
- Ramkumar P, Tian R, Seyler M, Leong JT, Chen M, Choudhry P, Hechler T, Shah N, Wong SW, Martin TG, et al. (2020b). CRISPR-based screens uncover determinants of immunotherapy response and potential combination therapy strategies. Blood Adv 4, 2899–2911. [DOI] [PMC free article] [PubMed] [Google Scholar]
- Rinaldi S, Assimon VA, Young ZT, Morra G, Shao H, Taylor IR, Gestwicki JE, and Colombo G (2018). A Local Allosteric Network in Heat Shock Protein 70 (Hsp70) Links Inhibitor Binding to Enzyme Activity and Distal Protein-Protein Interactions. ACS Chem. Biol. 13, 3142–3152. [DOI] [PMC free article] [PubMed] [Google Scholar]
- Rosenzweig R, Nillegoda NB, Mayer MP, and Bukau B (2019). The Hsp70 chaperone network. Nat Rev Mol Cell Biol 20, 665–680. [DOI] [PubMed] [Google Scholar]
- Rousaki A, Miyata Y, Jinwal UK, Dickey CA, Gestwicki JE, and Zuiderweg ERP (2011). Allosteric drugs: the interaction of antitumor compound MKT-077 with human Hsp70 chaperones. J. Mol. Biol. 411, 614–632. [DOI] [PMC free article] [PubMed] [Google Scholar]
- Rossi M, Botta C, Arbitrio M, Grembiale RD, Tagliaferri P, and Tassone P (2018). Mouse models of multiple myeloma: technologic platforms and perspectives. Oncotarget 9, 20119–20133. [DOI] [PMC free article] [PubMed] [Google Scholar]
- Sabnis AJ, Guerriero CJ, Olivas V, Sayana A, Shue J, Flanagan J, Asthana S, Paton AW, Paton JC, Gestwicki JE, et al. (2016). Combined chemical-genetic approach identifies cytosolic HSP70 dependence in rhabdomyosarcoma. Proc Natl Acad Sci USA 113, 9015–9020. [DOI] [PMC free article] [PubMed] [Google Scholar]
- Savitski MM, Zinn N, Faelth-Savitski M, Poeckel D, Gade S, Becher I, Muelbaier M, Wagner AJ, Strohmer K, Werner T, et al. (2018). Multiplexed Proteome Dynamics Profiling Reveals Mechanisms Controlling Protein Homeostasis. Cell 173, 260–274 e225. [DOI] [PMC free article] [PubMed] [Google Scholar]
- Schlecht R, Scholz SR, Dahmen H, Wegener A, Sirrenberg C, Musil D, Bomke J, Eggenweiler HM, Mayer MP, and Bukau B (2013). Functional analysis of Hsp70 inhibitors. PloS ONE 8, e78443. [DOI] [PMC free article] [PubMed] [Google Scholar]
- Shah SP, Lonial S, and Boise LH (2015). When Cancer Fights Back: Multiple Myeloma, Proteasome Inhibition, and the Heat-Shock Response. Mol Cancer Res 13, 1163–1173. [DOI] [PMC free article] [PubMed] [Google Scholar]
- Shah SP, Nooka AK, Jaye DL, Bahlis NJ, Lonial S, and Boise LH (2016). Bortezomib-induced heat shock response protects multiple myeloma cells and is activated by heat shock factor 1 serine 326 phosphorylation. Oncotarget 7, 59727–59741. [DOI] [PMC free article] [PubMed] [Google Scholar]
- Shao H, and Gestwicki JE (2020). Neutral analogs of the heat shock protein 70 (Hsp70) inhibitor, JG-98. Bioorg Med Chem Lett 30, 126954. [DOI] [PMC free article] [PubMed] [Google Scholar]
- Shao H, Li X, Moses MA, Gilbert LA, Kalyanaraman C, Young ZT, Chernova M, Journey SN, Weissman JS, Hann B, et al. (2018). Exploration of Benzothiazole Rhodacyanines as Allosteric Inhibitors of Protein-Protein Interactions with Heat Shock Protein 70 (Hsp70). J Med Chem 61, 6163–6177. [DOI] [PMC free article] [PubMed] [Google Scholar]
- Shapiro HM, Natale PJ, and Kamentsky LA (1979). Estimation of membrane potentials of individual lymphocytes by flow cytometry. Proc Natl Acad Sci U S A 76, 5728–5730. [DOI] [PMC free article] [PubMed] [Google Scholar]
- Sidrauski C, McGeachy AM, Ingolia NT, and Walter P (2015). The small molecule ISRIB reverses the effects of eIF2alpha phosphorylation on translation and stress granule assembly. Elife 4, e05033. [DOI] [PMC free article] [PubMed] [Google Scholar]
- Soriano GP, Besse L, Li N, Kraus M, Besse A, Meeuwenoord N, Bader J, Everts B, den Dulk H, Overkleeft HS, et al. (2016). Proteasome inhibitor-adapted myeloma cells are largely independent from proteasome activity and show complex proteomic changes, in particular in redox and energy metabolism. Leukemia 30, 2198–2207. [DOI] [PMC free article] [PubMed] [Google Scholar]
- Srinivasan SR, Cesa LC, Li X, Julien O, Zhuang M, Shao H, Chung J, Maillard I, Wells JA, Duckett CS, et al. (2018). Heat Shock Protein 70 (Hsp70) Suppresses RIP1-Dependent Apoptotic and Necroptotic Cascades. Mol Cancer Res 16, 58–68. [DOI] [PMC free article] [PubMed] [Google Scholar]
- Subramanian A, Tamayo P, Mootha VK, Mukherjee S, Ebert BL, Gillette MA, Paulovich A, Pomeroy SL, Golub TR, Lander ES, et al. (2005). Gene set enrichment analysis: a knowledge-based approach for interpreting genome-wide expression profiles. Proc Natl Acad Sci USA 102, 15545–15550. [DOI] [PMC free article] [PubMed] [Google Scholar]
- Taguwa S, Maringer K, Li X, Bernal-Rubio D, Rauch JN, Gestwicki JE, Andino R, Fernandez-Sesma A, and Frydman J (2015). Defining Hsp70 Subnetworks in Dengue Virus Replication Reveals Key Vulnerability in Flavivirus Infection. Cell 163, 1108–1123. [DOI] [PMC free article] [PubMed] [Google Scholar]
- Taylor IR, Assimon VA, Kuo SY, Rinaldi S, Li X, Young ZT, Morra G, Green K, Nguyen D, Shao H, et al. (2020). Tryptophan scanning mutagenesis as a way to mimic the compound-bound state and probe the selectivity of allosteric inhibitors in cells. Chem. Sci. 11, 1892–1904. [DOI] [PMC free article] [PubMed] [Google Scholar]
- Tian R, Gachechiladze MA, Ludwig CH, Laurie MT, Hong JY, Nathaniel D, Prabhu AV, Fernandopulle MS, Patel R, Abshari M, et al. (2019). CRISPR Interference-Based Platform for Multimodal Genetic Screens in Human iPSC-Derived Neurons. Neuron 104, 239–255. [DOI] [PMC free article] [PubMed] [Google Scholar]
- Tian Z, D’Arcy P, Wang X, Ray A, Tai YT, Hu Y, Carrasco RD, Richardson P, Linder S, Chauhan D, et al. (2014). A novel small molecule inhibitor of deubiquitylating enzyme USP14 and UCHL5 induces apoptosis in multiple myeloma and overcomes bortezomib resistance. Blood 123, 706–716. [DOI] [PMC free article] [PubMed] [Google Scholar]
- Tsherniak A, Vazquez F, Montgomery PG, Weir BA, Kryukov G, Cowley GS, Gill S, Harrington WF, Pantel S, Krill-Burger JM, et al. (2017). Defining a Cancer Dependency Map. Cell 170, 564–576 e516. [DOI] [PMC free article] [PubMed] [Google Scholar]
- Tsvetkov P, Detappe A, Cai K, Keys HR, Brune Z, Ying W, Thiru P, Reidy M, Kugener G, Rossen J, et al. (2019). Mitochondrial metabolism promotes adaptation to proteotoxic stress. Nat Chem Biol 15, 681–689. [DOI] [PMC free article] [PubMed] [Google Scholar]
- Tsvetkov P, Mendillo ML, Zhao J, Carette JE, Merrill PH, Cikes D, Varadarajan M, van Diemen FR, Penninger JM, Goldberg AL, et al. (2015). Compromising the 19S proteasome complex protects cells from reduced flux through the proteasome. eLife 4, e08467. [DOI] [PMC free article] [PubMed] [Google Scholar]
- Tyanova S, Temu T, and Cox J (2016a). The MaxQuant computational platform for mass spectrometry-based shotgun proteomics. Nat Protoc 11, 2301–2319. [DOI] [PubMed] [Google Scholar]
- Tyanova S, Temu T, Sinitcyn P, Carlson A, Hein MY, Geiger T, Mann M, and Cox J (2016b). The Perseus computational platform for comprehensive analysis of (prote)omics data. Nat Methods 13, 731–740. [DOI] [PubMed] [Google Scholar]
- Valera-Alberni M, and Canto C (2018). Mitochondrial stress management: a dynamic journey. Cell Stress 2, 253–274. [DOI] [PMC free article] [PubMed] [Google Scholar]
- Vincenz L, Jager R, O’Dwyer M, and Samali A (2013). Endoplasmic reticulum stress and the unfolded protein response: targeting the Achilles heel of multiple myeloma. Mol Cancer Ther 12, 831–843. [DOI] [PubMed] [Google Scholar]
- Wadhwa R, Sugihara T, Yoshida A, Nomura H, Reddel RR, Simpson R, Maruta H, and Kaul SC (2000). Selective toxicity of MKT-077 to cancer cells is mediated by its binding to the hsp70 family protein mot-2 and reactivation of p53 function. Cancer Res 60, 6818–6821. [PubMed] [Google Scholar]
- Walter P, and Ron D (2011). The unfolded protein response: from stress pathway to homeostatic regulation. Science 334, 1081–1086. [DOI] [PubMed] [Google Scholar]
- Welle KA, Zhang T, Hryhorenko JR, Shen S, Qu J, and Ghaemmaghami S (2016). Time-resolved Analysis of Proteome Dynamics by Tandem Mass Tags and Stable Isotope Labeling in Cell Culture (TMT-SILAC) Hyperplexing. Mol Cell Proteomics 15, 3551–3563. [DOI] [PMC free article] [PubMed] [Google Scholar]
- Wiita AP, Ziv E, Wiita PJ, Urisman A, Julien O, Burlingame AL, Weissman JS, and Wells JA (2013). Global cellular response to chemotherapy-induced apoptosis. Elife 2, e01236. [DOI] [PMC free article] [PubMed] [Google Scholar]
- Wu PK, Hong SK, Chen W, Becker AE, Gundry RL, Lin CW, Shao H, Gestwicki JE, and Park JI (2020). Mortalin (HSPA9) facilitates BRAF-mutant tumor cell survival by suppressing ANT3-mediated mitochondrial membrane permeability. Sci Signaling 13, eaay1478. [DOI] [PMC free article] [PubMed] [Google Scholar]
- Wunderlich M, Manning N, Sexton C, Sabulski A, Byerly L, O’Brien E, Perentesis JP, Mizukawa B, and Mulloy JC (2019). Improved chemotherapy modeling with RAG-based immune deficient mice. PLoS One 14, e0225532. [DOI] [PMC free article] [PubMed] [Google Scholar]
- Yadav B, Wennerberg K, Aittokallio T, and Tang J (2015). Searching for Drug Synergy in Complex Dose-Response Landscapes Using an Interaction Potency Model. Comput Struct Biotechnol J 13, 504–513. [DOI] [PMC free article] [PubMed] [Google Scholar]
- Yaglom JA, Wang Y, Li A, Li Z, Monti S, Alexandrov I, Lu X, and Sherman MY (2018). Cancer cell responses to Hsp70 inhibitor JG-98: Comparison with Hsp90 inhibitors and finding synergistic drug combinations. Sci Rep 8, 3010. [DOI] [PMC free article] [PubMed] [Google Scholar]
- Zecha J, Satpathy S, Kanashova T, Avanessian SC, Kane MH, Clauser KR, Mertins P, Carr SA, and Kuster B (2019). TMT Labeling for the Masses: A Robust and Cost-efficient, In-solution Labeling Approach. Mol Cell Proteomics 18, 1468–1478. [DOI] [PMC free article] [PubMed] [Google Scholar]
Associated Data
This section collects any data citations, data availability statements, or supplementary materials included in this article.
Supplementary Materials
Dataset S1. Proteostasis Gene Lists, related to Figure 1A (attached as Excel file): Curated list of genes included in proteostasis mapping.
Dataset S2. TMT Proteomics PI-sensitive cells, related to Figure 3A–C (attached as Excel file): Proteomic data results from TMT shotgun proteomics experiments in MM.1S, KMS34, and RPMI-8226 cells.
Dataset S3. Pulsed-SILAC-TMT proteomics, related to Figure 4 (attached as Excel file): Proteomic data results from TMT-pSILAC proteomics experiments.
Dataset S4. TMT Proteomics PI-resistant cells, related to Figure S3D (attached as Excel file): Proteomic data results from TMT shotgun proteomics experiments in AMO1-BtzR cells.
Supplementary Information File
Table S3. Oligonucleotide Sequences, related to STAR Methods. Included as an excel spreadsheet (Table S3 Oligonucleotide Sequences.xlsx).
Data Availability Statement
The mass spectrometry proteomics data have been deposited to the ProteomeXchange Consortium via the PRIDE (Perez-Riverol et al., 2019) partner repository with dataset identifiers PXD018617, PXD018387, and PXD032030. RNA sequencing data has been deposited at the Gene Expression Omnibus (GEO) (accession number GSE148659).
Code used for co-dependency and survival analyses is available at https://github.com/YHTLin/MM-proteostasis.
Any additional information required to reanalyze the data reported in this work paper is available from the Lead Contact upon request.