

Abstract
Conventional methods for the surveillance of hepatocellular carcinoma (HCC) by imaging, with and without serum tumor markers, are suboptimal with regard to accuracy. We aimed to develop and validate a reliable serum biomarker panel for the early detection of HCC using a proteomic technique. This multicenter case–control study comprised 727 patients with HCC and patients with risk factors but no HCC. We developed a multiple reaction monitoring–mass spectrometry (MRM-MS) multimarker panel using 17 proteins from the sera of 398 patients. Area under the receiver operating characteristics curve (AUROC) values of this MRM-MS panel with and without α-fetoprotein (AFP) and protein induced by vitamin K absence or antagonist-II (PIVKA-II) were compared. The combination and standalone MRM-MS panels had higher AUROC values than AFP in the training (0.940 and 0.929 vs 0.775, both P < 0.05), test (0.894 and 0.893 vs 0.593, both P < 0.05), and confirmation sets (0.961 and 0.937 vs 0.806, both P < 0.05) in detecting small single HCC. The combination and standalone MRM-MS panels had significantly higher AUROC values than the GALAD score (0.945 and 0.931 vs 0.829, both P < 0.05). Our proteome 17-protein multimarker panel distinguished HCC patients from high-risk controls and had high accuracy in the early detection of HCC.
Introduction
Hepatocellular carcinoma (HCC) accounts for 75–85% of all primary liver cancer cases, and its mortality rate is nearly equivalent to its global incidence.1 The burden of HCC is highest in East Asia, where cirrhosis, hepatitis B and C virus, and excessive alcohol consumption are the major risk factors.2
Although controversies exist over whether HCC surveillance programs provide a survival benefit for at-risk patients, a randomized controlled trial and several retrospective studies have concluded that surveillance through imaging studies, such as ultrasonography and serum α-fetoprotein (AFP) testing, results in early detection of HCC and reduced mortality.3−7 However, in a meta-analysis of patients with cirrhosis, abdominal ultrasonography, a universally recommended imaging modality for the surveillance of HCC, had a low sensitivity of 63% in detecting early-stage HCC with concomitant use of AFP.8 Considering the operator-dependent nature of ultrasonography and the high costs and potential physical harms of other imaging modalities (e.g., radiation hazards with computed tomography), there is a need for the development of a highly sensitive yet economical and safe measure for the early detection of HCC.9
The molecular heterogeneity of HCC has prompted attempts to integrate various serum biomarkers to detect the disease at an early stage.10 The GALAD score, which comprises age, sex, AFP, lectin-bound AFP, and protein induced by vitamin K absence or antagonist-II (PIVKA-II), is one of the most widely examined biomarker panels.11 Similarly, multiple reaction monitoring–mass spectrometry (MRM-MS), a targeted proteomic approach, quickly and accurately analyzes hundreds of proteins as potential biomarkers in various types of cancer.12−16 Our group has proposed a multimarker panel for the detection of early-stage HCC, consisting of 28 proteins that have been identified by MRM-MS.17
This multicenter study aimed to develop and evaluate a new multimarker panel for the detection of HCC with target proteins using a previous proteomic dataset, examine whether the incorporation of AFP and PIVKA-II into the panel improves its accuracy, validate the panel in an independent cohort, and compare its performance with that of the GALAD score.
Methods
Study Design and Participants
This case–control study was based on two independently established datasets of HCC patients and high-risk controls who selected per the same criteria from three referral centers [Seoul National University Hospital (SNUH), Asan Medical Center (AMC), and Samsung Medical Center (SMC)] in Seoul, Korea. The derivation set included 568 patients from all three participating centers—284 HCC patients and 284 non-HCC controls—whose serum samples were drawn between January 3, 2011, and September 3, 2013. They were randomly divided into training set (199 HCC patients and controls each) and test set (85 HCC patients and controls each). The panel was developed and validated using these training and test sets, respectively. Serum samples were also drawn from 159 patients—109 HCC patients from SNUH and AMC and 50 non-HCC controls from AMC—between September 7, 2013, and August 3, 2020, to establish another independent confirmation set (shown in Figure 1).
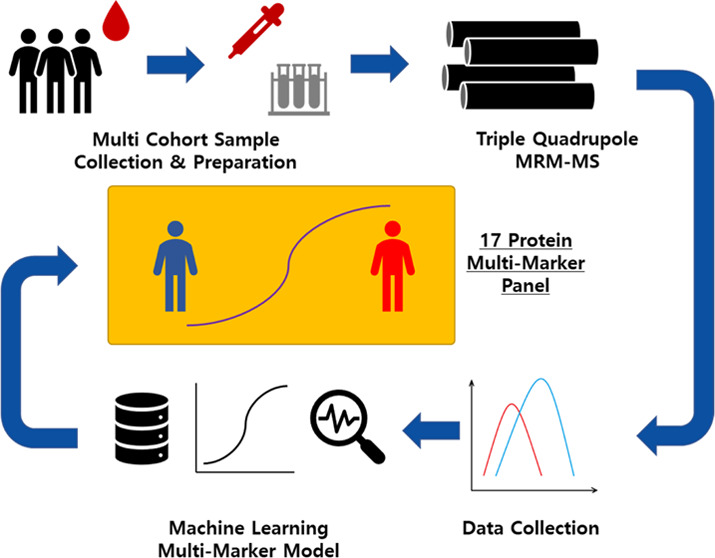
Figure 1.

Overview of the development of the MRM-MS panel. The study was performed with two independent cohorts: derivation and confirmation. A total of 383 target candidates were trained and internally validated with the derivation cohort, and the final 17-marker panel was validated with the confirmation cohort. Subgroups—tumor size under 2 cm, LC, and CHB—were also tested with regard to the performance of the model.
Patients with HCC were eligible if they were aged 20–80 years and diagnosed with single HCC that was smaller than 5 cm or 2–3 HCCs, each smaller than 3 cm, within 3 months prior to collection of their sera. The diagnosis of HCC was made according to radiographic or histological findings following the updated 2011 American Association for the Study of Liver Disease (AASLD) guidelines.18 Patients with radiological vascular invasion or extrahepatic metastasis of HCC by computed tomography (CT) or magnetic resonance (MRI) imaging, which detects advanced HCC, were excluded. The high-risk controls comprised patients aged 20–80 years with cirrhosis or chronic hepatitis B (CHB) or C (CHC) who were confirmed not to have had HCC by abdominal ultrasonography, computed tomography, or magnetic resonance imaging within 3 months prior to collection of their samples. Common exclusion criteria were (i) impaired hepatic function, defined as Child-Pugh class C; (ii) poor performance status, considered an Eastern Cooperative Oncology Group performance status score of 3 or above; and (iii) any other malignancy within 3 years prior to the collection of sera.
Cirrhosis was diagnosed clinically per the following criteria: (i) histological findings, (ii) thrombocytopenia (<100,000/mm3) and a blunted, nodular liver edge with splenomegaly (>12 cm), or (iii) the presence of ascites, varices, or hepatic encephalopathy. CHB and CHC were defined as a positive serum hepatitis B surface antigen test and a positive serum anti-hepatitis C virus antibody test, respectively, on two separate occasions that were separated by at least 6 months.
Biomarker Candidates
In a previous study, 383 peptides, corresponding to 176 proteins, had been identified as being suitable for quantitative MRM-MS analysis. Starting with 2189 proteins that were identified in five biobank resources, semiquantitative MRM-MS assay was performed on pooled serum samples of HCC patients and controls with cirrhosis or CHB, in which 23,184 peptides, representative of 1693 proteins, were filtered by a proteomic approach using prediction servers and a database. Among 1583 reproducibly detectable peptides, 542 were differentially expressed in individual samples of HCC patients compared with controls, 421 of which were verified as being acceptable for subsequent screening according to preexisting mass spectrometry spectral data. A subsequent quantitative MRM-MS analysis targeted 385 peptides that had undergone an interference screen using a stable isotope-labeled standard peptide mixture.17
In this study, we performed MRM-MS quantification for 383 target peptides, correlating to 176 proteins, except for two peptides for which compatible stable isotope-labeled standard peptides were not obtained due to unavailability. Their exclusion did not affect the performance of the developed panel because the two peptides were part of proteins that were represented by other peptides in the MRM-MS quantification.
Quantitative MRM-MS Analysis
Sample block randomization was performed for each set. The six most abundant proteins were removed from the samples by a Multiple Affinity Removal System Human-6 (MARS Hu-6 × 100 mm; Agilent Technologies, Santa Clara, CA) column that was loaded onto a high-performance liquid chromatography system (Shimadzu Co., Kyoto, Japan), wherein the column was exchanged for every 200 samples that were depleted. A total of 100 μg of proteins from each sample was hydrolyzed with sequencing-grade modified trypsin (Promega, Madison, WI). The MRM-MS assays on the training and test sets were conducted on an Agilent 6490 triple quadrupole mass spectrometer (Agilent Technologies) that was equipped with a Jet Stream Electrospray source that was coupled to a 1260 Infinity HPLC system (Agilent Technologies), and the assay on the confirmation set was performed on an Agilent 6495 triple quadrupole mass spectrometer (Agilent Technologies) that was coupled to the same HPLC system.
Detailed information on the MRM-MS procedure is provided in Supplementary Methods.
Data Preprocessing
Log transformation was applied selectively to the raw data from the 383-multiplex MRM assay such that the average of the skewness values of the training set was at a minimum, to secure the normality of the distribution (Figure S1).19 We performed Student’s t test and calculated area under the receiver operating characteristics (AUROC) value for the transformed data of each peptide, leaving 107 peptides (79 proteins) with P < 0.05 by Student’s t test and AUROC > 0.6. Based on the P values and AUROC values, a single peptide was selected for each protein that was associated with multiple peptides. Consequently, 79 candidate proteins were included in the development of the panel.
Panel Development and Assessment
Protein expression levels were compared between HCC patients and controls in the training set for the 79 biomarker candidates by the Mann–Whitney U test. We used logistic regression analysis to build the MRM-MS multimarker panel, with recursive feature elimination with cross-validation to determine the markers that were to remain in the panel. AFP and PIVKA-II were later combined with the MRM-MS panel as continuous variables. The discriminatory abilities of AFP and the MRM-MS panel with and without AFP and/or PIVKA-II were evaluated by AUROC analysis. By DeLong test, we compared, in pairs, the AUROC values of the standalone MRM-MS panel, AFP, and the combination MRM-MS panels in the training, test, and confirmation sets, with that of the GALAD score in a subset (GALAD cohort) of the confirmation cohort.20 Youden index was used as the optimal cutoff from the training set and applied to the test and confirmation set at which the sensitivity and specificity were calculated for the standalone MRM-MS and combination MRM-MS panels.21 The sensitivities and specificities were compared in each set with those of AFP at a cutoff of 20 ng/mL, a common value for screening HCC.22 All reported P values were two-sided, and P values less than 0.05 were deemed to be significant.
All statistical analyses were conducted in R (version 4.0.4; R development Core Team, Vienna, Austria; http://www.R-project.org) and SPSS (version 25.0; SPSS, Chicago, IL).
Results and Discussion
Characteristics of the Study Population
Most participants had cirrhosis (62.3, 65.9, and 82.6% for HCC patients and 78.9, 75.3, and 100.0% for controls in the training, test, and confirmation sets, respectively) and Child-Pugh class A liver function (92.4, 89.4, and 96.3% and 87.9, 89.4, and 70.0%, respectively). All HCC patients with noncirrhotic liver, except 1 in the confirmation set, had CHB or CHC. No participant had a coinfection with hepatitis B and C viruses. Most HCC patients had a single tumor (90.5, 89.4, and 82.6% in the training, test, and confirmation sets, respectively) (shown in Table 1).
Table 1. Characteristics of the Study Populationa,b.
|
training set |
test set |
confirmation set |
|||||||
|---|---|---|---|---|---|---|---|---|---|
| HCC (n = 199) | control (n = 199) | P value | HCC (n = 85) | control (n = 85) | P value | HCC (n = 109) | control (n = 50) | P value | |
| age, years | 58.0 (52.0–64.0) | 56.0 (51.5–61.0) | 0.010 | 58.0 (50.0–63.0) | 56.0 (52.0–64.0) | 0.332 | 61.0 (56.0–67.0) | 57.0 (51.0–61.0) | 0.001 |
| sex, N (%) | <0.001 | 0.007 | <0.001 | ||||||
| female | 34 (17.1%) | 80 (40.2%) | 23 (27.1%) | 41 (48.2%) | 17 (15.6%) | 26 (52.0%) | |||
| male | 165 (82.9%) | 119 (59.8%) | 62 (72.9%) | 44 (51.8%) | 92 (84.4%) | 24 (48.0%) | |||
| body mass index, kg/m2 | 24.7 (22.5–26.7) | 24.4 (22.3–26.5) | 0.504 | 24.8 (22.6–26.3) | 24.0 (22.4–25.8) | 0.161 | 24.5 (22.5–26.6) | 24.4 (23.0–27.9) | 0.765 |
| platelet, ×103/μL | 142.0 (112.5–175.0) | 87.0 (65.0–127.0) | <0.001 | 140.0 (110.0–180.0) | 92.0 (64.0–147.0) | <0.001 | 140.0 (102.0–186.0) | 74.0 (56.0–102.0) | <0.001 |
| creatinine, mg/dL | 0.9 (0.8–1.0) | 0.8 (0.6–0.9) | <0.001 | 0.8 (0.8–1.0) | 0.8 (0.6–0.9) | 0.002 | 0.9 (0.7–1.0) | 0.7 (0.6–0.9) | <0.001 |
| albumin, g/dL | 3.8 (3.5–4.0) | 4.2 (3.8–4.5) | <0.001 | 3.8 (3.4–4.0) | 4.4 (4.0–4.6) | <0.001 | 3.8 (3.6–4.1) | 3.9 (3.7–4.3) | 0.829 |
| ALT, IU/L | 41.0 (26.0–114.5) | 23.0 (17.0–33.0) | <0.001 | 51.0 (28.0–121.0) | 26.0 (18.0–35.0) | <0.001 | 26.0 (19.0–36.0) | 23.0 (19.0–30.0) | 0.236 |
| total bilirubin, mg/dL | 0.9 (0.5–1.2) | 1.1 (0.7–1.6) | <0.001 | 0.9 (0.6–1.3) | 1.0 (0.8–1.4) | 0.115 | 0.7 (0.5–0.9) | 1.6 (1.0–2.3) | <0.001 |
| prothrombin time, INR | 1.1 (1.0–1.2) | 1.1 (1.0–1.2) | <0.001 | 1.2 (1.1–1.3) | 1.1 (1.0–1.2) | <0.001 | 1.1 (1.0–1.1) | 1.1 (1.1–1.3) | <0.001 |
| risk factors | <0.001 | 0.346 | 0.004 | ||||||
| cirrhosis, N (%) | 124 (62.3%) | 157 (78.9%) | 56 (65.9%) | 64 (75.3%) | 90 (82.6%) | 50 (100.0%) | |||
| noncirrhotic CHB, N (%) | 65 (32.7%) | 34 (17.1%) | 20 (23.5%) | 16 (18.8%) | 15 (13.8%) | 0 | |||
| noncirrhotic CHC, N (%) | 10 (5.0%) | 8 (4.0%) | 9 (10.6%) | 5 (5.9%) | 3 (2.8%) | 0 | |||
| others, N (%) | 0 | 0 | 1 (0.9%) | ||||||
| Child-Pugh class, N (%) | 0.183 | 1.000 | <0.001 | ||||||
| A | 183 (92.4%) | 175 (87.9%) | 76 (89.4%) | 76 (89.4%) | 105 (96.3%) | 35 (70.0%) | |||
| B | 15 (7.6%) | 24 (12.1%) | 9 (10.6%) | 9 (10.6%) | 4 (3.7%) | 15 (30.0%) | |||
| alcoholic, N (%) | 20 (10.1%) | 12 (6.0%) | 0.197 | 6 (7.1%) | 8 (9.4%) | 0.780 | 14 (12.8%) | 6 (12.0%) | 1.000 |
| diabetes mellitus, N (%) | 45 (22.6%) | 19 (9.5%) | 0.001 | 11 (12.9%) | 5 (5.9%) | 0.189 | 30 (27.5%) | 5 (10.0%) | 0.023 |
| hypertension, N (%) | 60 (30.2%) | 13 (6.5%) | <0.001 | 17 (20.0%) | 7 (8.2%) | 0.047 | 34 (31.2%) | 13 (26.0%) | 0.632 |
| AFP ng/mL, median (IQR) | 6.0 (2.9–14.1) | 2.5 (1.7–3.8) | <0.001 | 5.7 (2.7–19.3) | 2.8 (2.0–3.9) | <0.001 | 10.9 (3.5–43.9) | 3.0 (2.3–5.6) | <0.001 |
| PIVKA-II mAU/mL, median (IQR) | 32.0 (23.0–83.5) | 16.0 (13.0–20.0) | <0.001 | 37.0 (23.0–78.0) | 16.0 (13.0–20.0) | <0.001 | 42.0 (26.0–216.0) | 17.0 (14.0–21.0) | <0.001 |
| tumor number, N (%) | |||||||||
| 1 | 180 (90.5%) | 76 (89.4%) | 90 (82.6%) | ||||||
| 2 | 12 (6.0%) | 6 (7.1%) | 15 (13.8%) | ||||||
| 3 | 7 (3.5%) | 3 (3.5%) | 4 (3.7%) | ||||||
| tumor size, cm | 2.4 (1.6–3.0) | 2.4 (1.5–3.7) | 2.5 (1.5–3.2) | ||||||
| AJCC stage, n (%) | |||||||||
| IA | 77 (38.7%) | 31 (36.5%) | 42 (38.5%) | ||||||
| IB | 105 (52.8%) | 45 (52.9%) | 48 (44.0%) | ||||||
| II | 17 (8.5%) | 9 (10.6%) | 19 (17.4%) | ||||||
Data are provided in N (%) or median (interquartile range).
HCC, hepatocellular carcinoma; ALT, alanine aminotransferase; INR, international normalized ratio; CHB, chronic hepatitis B; CHC, chronic hepatitis C; AFP, α-fetoprotein; PIVKA-II, protein induced by vitamin K absence or antagonist-II; AJCC, American Joint Committee on Cancer; IQR, interquartile range.
Development of an MRM-MS Panel
Of the 79 candidate proteins that were significantly associated with the presence of HCC (P < 0.05), 17 proteins [PPBP (platelet basic protein), SERPINC1 (antithrombin-III), MCAM (cell surface glycoprotein), CFL1 (cofilin-1), C4A (complement C4-A), AMBP (protein AMBP), THBS1 (thrombospondin-1), UCHL3 (ubiquitin carboxyl-terminal hydrolase isozyme L3), LCAT (phosphatidylcholine-sterol acyltransferase), C1QC (complement C1q subcomponent subunit C), CNDP1 (β-Ala-His dipeptidase), C2 (cytochrome c oxidase subunit 2), CA2 (carbonic anhydrase 2), C6 (complement component C6), SAA4 (serum amyloid A-4 protein), SERPINA10 (protein Z-dependent protease inhibitor), and APOH (β-2-glycoprotein 1)] were selected as optimal constituents of the MRM-MS panel by stepwise selection. The predicted probability of HCC cases according to the panel was calculated in the training set (shown in Table S1).
Performance of the MRM-MS Panel Excluding General Proteins
Although 17 protein markers were suggested by machine learning, several were not specifically related to HCC. The performance of a panel that excluded general proteins, such as C4A, C6, SAA4, and APOH, was confirmed prior to the analysis of the 17-protein panel (Figure S2).
In the training set, the standalone MRM-MS panel had a significantly higher AUROC value (0.912 vs 0.759; P < 0.001) than AFP alone. The addition of AFP to the MRM-MS panel (designated the MA panel) improved the AUROC value (0.939; 95% CI, 0.910–0.956; P = 0.025), as did that of PIVKA-II to it (termed the MP panel) (0.926; 95% CI, 0.901–0.951; P = 0.175). The combination MRM-MS panel with AFP and PIVKA-II (the MAP panel) had a significantly higher AUROC value (0.938; 95% CI, 0.915–0.960; P = 0.005) than AFP alone.
In the test set, the MRM-MS panel yielded a significantly higher AUROC value (0.919 vs 0.691; P < 0.001) than AFP alone. The AUROC values of the MA (0.919; 95% CI, 0.877–0.962; P = 0.841), MP (0.928; 95% CI, 0.889–0.967; P = 0.191), and MAP panels (0.930; 95% CI, 0.891–0.970; P = 0.288) were comparable with that of the standalone MRM-MS panel.
In the confirmation set, the MRM-MS panel had a significantly higher AUROC value (0.947 vs 0.779, P < 0.001) than AFP alone. The AUROC values of the MA (0.9577; 95% CI, 0.930–0.985; P < 0.001), MP (0.966; 95% CI, 0.942–0.990; P < 0.001), and MAP panels (0.973; 95% CI, 0.952–0.994; P < 0.001) were also higher than that of the standalone MRM-MS panel.
In a machine learning-based biomarker study, the classifier processes the best set of combination solely using the given quantitative value of the data. From our result, the 17-marker combination, including the four general markers, performed best in distinguishing patients and healthy controls alone, without AFP or PIVKA values, which are not quantifiable by MRM-MS.
In addition, considering that blood samples that are procured from the median cubital vein do not represent a specific organ, certain markers that are irrelevant to HCC might have been selected as candidates. Because the presence of HCC might impact not merely the immune and endocrine systems but also the entire body, removing markers that are related to inflammation, which would show a definitive difference between patients and controls, might decrease the accuracy of a multimarker panel that is developed for surveillance.
Performance of the MRM-MS Panel with and without AFP and PIVKA-II in Detecting HCC
In the training set, the standalone MRM-MS panel had a significantly higher AUROC value (0.937 vs 0.759; P < 0.001) than AFP alone. The MRM-MS panel had greater sensitivity (80.4 vs 17.1%) and lower specificity (93.5 vs 97.5%) than AFP. The addition of AFP to the MRM-MS panel improved the AUROC value (0.949; 95% CI, 0.929–0.969; P = 0.006), whereas that of PIVKA-II to it did not (0.941; 95% CI, 0.920–0.963; P = 0.073). The combination MRM-MS panel with AFP and PIVKA-II had a significantly higher AUROC value (0.953; 95% CI, 0.934–0.971; P = 0.002), similar sensitivity (80.4%), and greater specificity (96.5%) compared with the standalone MRM-MS panel (shown in Figures 2 and S3).
Figure 2.

Performance of AFP and the MRM-MS panel with and without AFP and PIVKA-II in detecting HCC. ROC curves of AFP, standalone MRM-MS panel, MRM-MS + AFP (MA) panel, MRM-MS + PIVKA-II (MP) panel, and MRM-MS + AFP + PIVKA-II (MAP) panel in the (A) training set and (B) confirmation set.
In the test set, the MRM-MS panel yielded a significantly higher AUROC value (0.891 vs 0.691; P < 0.001), greater sensitivity (78.8 vs 24.7%), and lower specificity (81.2 vs 97.7%) than AFP. The AUROC values of the MA (0.891; 95% CI, 0.844–0.938; P = 0.598), MP (0.901; 95% CI, 0.856–0.945; P = 0.086), and MAP panels (0.907; 95% CI, 0.863–0.952; P = 0.280) were comparable with that of the standalone MRM-MS panel. However, the sensitivity and specificity were higher in the MAP panel (81.2 and 82.3%, respectively) versus the standalone MRM-MS panel.
In the confirmation set, the MRM-MS panel had a significantly higher AUROC value (0.940 vs 0.779, P < 0.001), higher sensitivity (88.1 vs 35.8%), and lower specificity (82.0 vs 96.0%) than AFP. The AUROC values of the MA (0.958; 95% CI, 0.929–0.986; P = 0.004), MP (0.953; 95% CI, 0.923–0.983; P = 0.001), and MAP panels (0.970; 95% CI, 0.947–0.994; P < 0.001) were also higher than that of the standalone MRM-MS panel. The sensitivity and specificity of the MAP panel were 89.9 and 98.0%, respectively, both higher compared with the standalone MRM-MS panel (shown in Table 2).
Table 2. Performance of AFP and the MRM-MS Panel with and without AFP and PIVKA-II in Detecting HCCa.
| AUROC 95% CI | P value | sensitivity (%) | specificity (%) | |
|---|---|---|---|---|
| Training Set | ||||
| AFP | 0.759 (0.712–0.806) | 17.1 | 97.5 | |
| standalone MRM-MS panel | 0.937 (0.915–0.959) | <0.001b | 80.4 | 93.5 |
| MA panel | 0.949 (0.929–0.969) | 0.006c | 88.4 | 87.5 |
| MP panel | 0.941 (0.920–0.963) | 0.073c | 81.4 | 94.5 |
| MAP panel | 0.953 (0.934–0.971) | 0.002c | 80.4 | 96.5 |
| Test Set | ||||
| AFP | 0.691 (0.610–0.772) | 24.7 | 97.7 | |
| standalone MRM-MS panel | 0.891 (0.844–0.938) | <0.001b | 78.8 | 81.2 |
| MA panel | 0.898 (0.852–0.945) | 0.598c | 89.4 | 74.1 |
| MP panel | 0.901 (0.856–0.945) | 0.086c | 81.2 | 78.8 |
| MAP panel | 0.907 (0.863–0.952) | 0.280c | 81.2 | 82.3 |
| Confirmation Set | ||||
| AFP | 0.779 (0.707–0.852) | 35.8 | 96.0 | |
| standalone MRM-MS panel | 0.940 (0.906–0.975) | <0.001b | 88.1 | 82.0 |
| MA panel | 0.958 (0.929–0.986) | 0.004c | 92.7 | 70.0 |
| MP panel | 0.953 (0.923–0.983) | 0.001c | 88.1 | 98.0 |
| MAP panel | 0.970 (0.947–0.994) | <0.001c | 89.9 | 98.0 |
AUROC—area under the receiver operating characteristics curve; AFP—α-fetoprotein; MA—multiple reaction monitoring–mass spectrometer + AFP; MP—multiple reaction monitoring–mass spectrometer + protein induced by vitamin K absence or antagonist-II; MAP—multiple reaction monitoring–mass spectrometer + AFP + protein induced by vitamin K absence or antagonist-II.
AUROC of the standalone MRM-MS panel versus AUROC of AFP.
AUROC of MA, MP, or MAP panel versus AUROC of the standalone MRM-MS panel.
Performance of the MRM-MS Panel with and without AFP and PIVKA-II in Detecting Small (<2 cm) Single HCC
Patients with small (i.e., <2 cm) single HCC and high-risk controls in each set were analyzed. In the training set, the standalone MRM-MS panel had a significantly higher AUROC value (0.929 vs 0.775, P < 0.001), greater sensitivity (76.6 vs 22.1%), and lower specificity (93.5 vs 97.5%) compared with AFP. The AUROC values of the MA (0.938; 95% CI, 0.909–0.968; P = 0.072), MP (0.931; 95% CI, 0.898–0.963; P = 0.498), and MAP panels (0.940; 95% CI, 0.911–0.969; P = 0.074) were similar to that of the standalone MRM-MS panel. The sensitivity and specificity of the MAP panel were 72.7 and 96.5%, respectively (shown in Figures 3 and S3).
Figure 3.

Performance of AFP and the MRM-MS panel with and without AFP and PIVKA-II in detecting small (<2 cm) single HCC. ROC curves of AFP, standalone MRM-MS panel, MRM-MS + AFP (MA) panel, MRM-MS + PIVKA-II (MP) panel, and MRM-MS + AFP + PIVKA-II (MAP) panel in the (A) training set and (B) confirmation set.
In the test set, the MRM-MS panel yielded a significantly higher AUROC value (0.893 vs 0.593; P < 0.001), better sensitivity (74.2 vs 22.6%), and lower specificity (81.2 vs 97.5%) than AFP. The AUROC values of the MA (0.895; 95% CI, 0.934–0.957; P = 0.882), MP (0.893; 95% CI, 0.832–0.953; P = 0.938), and MAP panels (0.894; 95% CI, 0.832–0.957; P = 0.943) were comparable with that of the standalone MRM-MS panel. The sensitivity and specificity of the MAP panel were 77.4 and 82.4%, respectively.
In the confirmation set, the standalone MRM-MS panel had a significantly higher AUROC value (0.937 vs 0.806; P = 0.019), greater sensitivity (88.1 vs 31.0%), and lower specificity (82.0 vs 96.0%) than AFP. The AUROC values of the MP (0.946; 95% CI, 0.892–1.000; P = 0.04) and MAP panels (0.961; 95% CI, 0.912–1.000; P = 0.026) were significantly higher versus the standalone MRM-MS panel, unlike the MA panel (0.955; 95% CI 0.901–1.000; P = 0.062). The sensitivity and specificity of the MAP panel were 90.5 and 98.0%, respectively (shown in Table 3).
Table 3. Performance of AFP and the MRM-MS Panel with and without AFP and PIVKA-II in Detecting Small (<2 cm) Single HCCa.
| AUROC 95% CI | P value | sensitivity (%) | specificity (%) | |
|---|---|---|---|---|
| Training Set | ||||
| AFP | 0.775 (0.710–0.813) | 22.1 | 97.5 | |
| standalone MRM-MS panel | 0.929 (0.896–0.962) | <0.001b | 76.6 | 93.5 |
| MA panel | 0.938 (0.909–0.968) | 0.072c | 83.1 | 87.4 |
| MP panel | 0.931 (0.898–0.963) | 0.498c | 76.6 | 94.5 |
| MAP panel | 0.940 (0.911–0.969) | 0.074c | 72.7 | 96.5 |
| Test Set | ||||
| AFP | 0.593 (0.464–0.721) | 22.6 | 97.5 | |
| standalone MRM-MS panel | 0.893 (0.834–0.952) | <0.001b | 74.2 | 81.2 |
| MA panel | 0.895 (0.834–0.957) | 0.882c | 90.3 | 74.1 |
| MP panel | 0.893 (0.832–0.953) | 0.938c | 74.2 | 78.8 |
| MAP panel | 0.894 (0.832–0.957) | 0.943c | 77.4 | 82.4 |
| Confirmation Set | ||||
| AFP | 0.806 (0.717–0.896) | 31.0 | 96.0 | |
| standalone MRM-MS panel | 0.937 (0.878–0.996) | 0.019b | 88.1 | 82.0 |
| MA panel | 0.955 (0.901–1.000) | 0.062c | 95.2 | 70.0 |
| MP panel | 0.946 (0.892–1.000) | 0.040c | 88.1 | 98.0 |
| MAP panel | 0.961 (0.912–1.000) | 0.026c | 90.5 | 98.0 |
AUROC—area under the receiver operating characteristics curve; AFP—α-fetoprotein; MA—multiple reaction monitoring–mass spectrometer + AFP; MP—multiple reaction monitoring–mass spectrometer + protein induced by vitamin K absence or antagonist-II; MAP—multiple reaction monitoring–mass spectrometer + AFP + protein induced by vitamin K absence or antagonist-II.
AUROC of the standalone MRM-MS panel versus AUROC of AFP.
AUROC of MA, MP, or MAP panel versus AUROC of the standalone MRM-MS panel.
Performance of the MRM-MS Panel with and without AFP and PIVKA-II vs GALAD in Detecting HCC
The GALAD cohort was a subset of the confirmation set and was composed of 53 HCC patients and 50 controls from a single participating center (AMC) (Table S2). The MRM-MS panel had a significantly higher AUROC value (0.931 vs 0.718; P <0.001), greater sensitivity (88.7 vs 52.8%), and lower specificity (82.0 vs 92.0%) than the GALAD score. The AUROC value of the MAP panel was significantly higher (0.958; 95% CI, 0.916–1.000; P = 0.009) than the standalone MRM-MS panel (Figure S4). The addition of AFP and PIVKA-II to the MRM-MS panel improved its sensitivity (90.6%) and specificity (98.0%) (shown in Table S3).
Subgroup Analysis
A separate subgroup analysis was performed for patients with cirrhosis in each set and those with noncirrhotic CHB in the training and test sets. An analysis of participants with noncirrhotic CHB in the confirmation set was not feasible because all controls in the set had cirrhosis.
For patients with cirrhosis, the standalone MRM-MS model yielded a significantly higher AUROC value (0.927 vs 0.790; P < 0.001), higher sensitivity (76.6 vs 20.2%), and lower specificity (94.9 vs 97.5%) than AFP in the training set. The AUROC value of MAP panel (0.945; 95% CI, 0.919–0.970; P = 0.021) was significantly higher versus the standalone MRM-MS panel. In the test and confirmation sets, the MRM-MS model also had a significantly higher AUROC value (0.875 and 0.944 vs 0.712 and 0.798; P = 0.005 and P < 0.001, respectively), greater sensitivity (76.8 and 88.9% vs 28.6 and 36.7%, respectively), and lower specificity (78.1% and 82.0 vs 96.9 and 96.0%, respectively) than AFP alone. The AUROC value of the MRM-MS panel improved with the addition of AFP and PIVKA-II (i.e., MAP panel) in the confirmation set (0.973; 95% CI, 0.949–0.997; P = 0.001), but this increase was not significant in the test set (0.897; 95% CI, 0.839–0.954; P = 0.303) (shown in Table S4A and Figure S5).
For patients with noncirrhotic CHB in the training set, the MRM-MS panel had a significantly higher AUROC value (0.951 vs 0.734; P < 0.001), greater sensitivity (86.2 vs 13.8%), and lower specificity (85.3 vs 97.1%) than AFP, whereas the MAP panel had a statistically similar AUROC value (0.962; 95% CI, 0.929–0.994; P = 0.111) as the standalone MRM-MS panel. In the test set, the MRM-MS panel also had a significantly higher AUROC value (0.909 vs 0.702; P < 0.001) compared with AFP alone, and the addition of AFP and PIVKA-II (i.e., the MAP panel) did not significantly improve the AUROC value (0.931; 95% CI, 0.854–1.000; P = 0.298) (shown in Table S4B and Figure S5).
We have developed a multimarker panel of 17 proteins by MRM-MS analysis for detecting HCC. This MRM-MS panel performed significantly better than AFP in differentiating HCC patients from controls in every dataset, especially with regard to sensitivity. The incorporation of AFP and PIVKA-II into the MRM-MS panel improved its performance in every set, although statistical significance was not achieved with the test set. The diagnostic superiority of the MRM-MS panel over AFP was maintained in patients with small single HCC, but the significant improvement that was affected by the addition of AFP and PIVKA-II was observed only in the confirmation set. The MRM-MS panel also outperformed the GALAD score and demonstrated its efficacy in identifying HCC patients among cirrhotic patients and those with noncirrhotic CHB.
The low concentrations of potential biomarkers and the wide range of protein levels are major setbacks in the proteomic analysis of serum.23 MRM-MS, which can detect attomole levels of peptides24−27 and quantify hundreds of peptides in an automated manner,28,29 is an effective modality in examining and validating candidate biomarkers for early detection of HCC. The data that are generated by MRM-MS assays are highly reproducible.30
HCC surveillance programs that are based on abdominal ultrasonography with and without serum AFP assay have low sensitivities in cirrhotic patients,8,31 whose alterations in liver parenchyma are associated with poor imaging quality32 and a high risk of HCC.33 Although recent studies have examined the value of cross-sectional imaging modalities (e.g., computed tomography and magnetic resonance imaging) as potential alternatives,34−36 their limited accessibility and high cost are major barriers to their widespread use.37 HCC surveillance using an MRM-MS panel has the advantages of being readily available and cost-effective because it requires only blood samples for mass spectrometry assays.
No study that has aimed to identify new HCC serum markers through mass spectrometry38−42 has validated the discriminatory performance of the identified markers in a chronologically separately collected, multicenter cohort. The current study is also distinct from a previous report by our group,17 in that data preprocessing was adopted before the selection of the markers and that fewer markers were involved in the developed panel. The smaller number of markers renders the MRM-MS panel economically competitive with regard to the amount of internal standard peptides and reagents that are needed for mass spectrometry assays.43
Our MRM-MS panel showed excellent accuracy in discriminating HCC patients, with an AUROC value of 0.891 being the lowest across all analyses, considering that a value over 0.8 is excellent.44 However, its specificity was lower than that of AFP, as was the case with our group’s earlier panel. AFP, despite its low sensitivity of 39–65% in detecting HCC,45 improved the sensitivity when added to the MRM-MS panel, although its specificity declined. This drawback was overcome by introducing PIVKA-II, which is more specific than AFP in detecting HCC.46 A similar trend was observed when the analysis was confined to patients with small single HCC. These results imply that the serum levels of proteins in the MRM-MS panel are affected by the presence of HCC through mechanisms that are independent of those that affect the levels of AFP and PIVKA-II. Notably, the MRM-MS panel was consistently reliable when classifying patients with cirrhosis and those with noncirrhotic CHB, in contrast to AFP, the levels of which are frequently elevated in patients with cirrhosis or CHB.47
Our study has several limitations. The depletion of the six most abundant proteins before the MRM-MS assays might have eliminated other proteins with significant discriminatory value, as inferred from the finding that AFP was not included in the list of the 17 markers. This issue has been discussed in other proteomic studies48,49 and was addressed in our study through the subsequent addition of AFP, which is the only commonly used serum biomarker for screening HCC.45
Further, it is unknown whether the MRM-MS panel is useful for patients with other risk factors for HCC, such as alcoholic liver cirrhosis, or nonalcoholic fatty liver disease. Because the main etiological cause of HCC is shifting from CHB or CHC to NASH or ALD due to vaccination and antivirals, further validation in the ALD and NASH populations is required.50,51 Also, the effectiveness of the MRM-MS panel in patients of various ethnicities is unverified—all of our participants were Korean. Finally, no comparison with abdominal ultrasonography was performed in this study.
Conclusions
In conclusion, this MRM-MS multimarker panel, comprising 17 proteins, showed excellent performance in distinguishing HCC patients from high-risk controls with cirrhosis or CHB or CHC. Its combination with AFP and PIVKA-II enhanced its performance, although statistical significance was not consistently reached. Prospective studies are warranted to determine whether our MRM-MS panel is a viable alternative to abdominal ultrasonography in HCC surveillance.
Acknowledgments
This work was supported by the Industrial Strategic Technology Development Program (no. 20000134) and the Korea Health Industry Development Institute (nos. HL19C0020 & HI19C1132). I.Y. was supported by BK21 FOUR, funded by the National Research Foundation of Korea. J.L. and D.S. received a scholarship from the BK21-Plus Education Program, provided by the National Research Foundation of Korea. This research was conducted in the absence of any commercial or financial relationship that could be construed as a potential conflict of interest.
Glossary
Abbreviations Used
- HCC
hepatocellular carcinoma
- AFP
α-fetoprotein
- PIVKA-II
protein induced by vitamin K absence or antagonist-II
- MRM-MS
multiple reaction monitoring–mass spectrometry
- CHB
chronic hepatitis B
- CHC
chronic hepatitis C
- AUROC
area under the receiver operating characteristics curve
Supporting Information Available
The Supporting Information is available free of charge at https://pubs.acs.org/doi/10.1021/acsomega.2c02926.
Detailed MRM-MS analysis methods; logistic regression equation (logit [P = HCC]) with selective log transformation for the 17 marker proteins (Table S1); characteristics of the GALAD cohort (Table S2); performance of AFP and the MRM-MS panel with and without AFP and PIVKA-II compared with GALAD in detecting HCC (Table S3); subgroup analysis of patients with cirrhosis (Table S4A); subgroup analysis of patients with chronic hepatitis B (Table S4B); MS method information of 383 targets (Table S5); AFP, PIVKA, and 17 protein value for multimarker panel development (Table S6); density plot of the 17 marker peptides in the MRM-MS panel (Figure S1); performance of AFP and the MRM-MS panel excluding general proteins (Figure S2); performance of AFP and the MRM-MS panel with/without combination of AFP and/or PIVKA-II in the test set (Figure S3); performance of GALAD score and the MRM-MS panel with and without AFP and PIVKA-II in detecting HCC (Figure S4); and subgroup analysis of patients with cirrhosis and chronic hepatitis B (Figure S5) (PDF)
Author Contributions
# J.Y.K., J.K., and Y.-S.L. contributed equally to this work as co-first authors. J.Y.K. performed investigation, interpretation, data analysis, and writing—original draft. J.K. carried out data curation, data analysis, statistical analysis, visualization, and writing—original draft. Y.L. performed data curation, investigation, and methodology. G.G. and J.L. carried out data curation. I.Y. performed data curation and investigation. Yoseop K. conducted statistical analysis. D.S. contributed to visualization. J.L. performed conceptualization and writing—review and editing. Y.K. contributed to conceptualization, resources, supervision, funding acquisition, and writing—review and editing.
The authors declare no competing financial interest.
Notes
The MRM-MS raw files were deposited to PeptideAtlas (http://www.peptideatlas.org; dataset identifier: PASS01728; password: RE4655m).
Notes
This study was approved by the Institutional Review Board of each participating center (Asan Medical Center [IRB No. 2017-1049], Samsung Medical Center [IRB No. 2017-08-164], and Seoul National University Hospital [IRB No. H-1710-028-891]) and has been confirmed for waiver of informed consent. This study was conducted in accordance with the Declaration of Helsinki and Good Clinical Practice.
Supplementary Material
References
- Arnold M.; Abnet C. C.; Neale R. E.; Vignat J.; Giovannucci E. L.; McGlynn K. A.; Bray F. Global Burden of 5 Major Types of Gastrointestinal Cancer. Gastroenterology 2020, 159, 335–349. 10.1053/j.gastro.2020.02.068. [DOI] [PMC free article] [PubMed] [Google Scholar]
- McGlynn K. A.; Petrick J. L.; El-Serag H. B. Epidemiology of Hepatocellular Carcinoma. Hepatology 2021, 73, 4–13. 10.1002/hep.31288. [DOI] [PMC free article] [PubMed] [Google Scholar]
- Zhang B.-H.; Yang B.-H.; Tang Z.-Y. Randomized Controlled Trial of Screening for Hepatocellular Carcinoma. J. Cancer Res. Clin. Oncol. 2004, 130, 417–422. 10.1007/s00432-004-0552-0. [DOI] [PMC free article] [PubMed] [Google Scholar]
- van Meer S.; de Man R. A.; Robert A.; Coenraad M. J.; Sprengers D.; van Nieuwkerk K. M.; Klümpen H.-J.; Jansen P. L.; IJzermans J. N.; van Oijen M. G.; Siersema P. D. Surveillance for Hepatocellular Carcinoma Is Associated with Increased Survival: Results from a Large Cohort in the Netherlands. J. Hepatol. 2015, 63, 1156–1163. 10.1016/j.jhep.2015.06.012. [DOI] [PubMed] [Google Scholar]
- Wu C.-Y.; Hsu Y.-C.; Ho H. J.; Chen Y.-J.; Lee T.-Y.; Lin J.-T. Association between Ultrasonography Screening and Mortality in Patients with Hepatocellular Carcinoma: A Nationwide Cohort Study. Gut 2016, 65, 693–701. 10.1136/gutjnl-2014-308786. [DOI] [PubMed] [Google Scholar]
- Mittal S.; Kanwal F.; Ying J.; Chung R.; Sada Y. H.; Temple S.; Davila J. A.; El-Serag H. B. Effectiveness of Surveillance for Hepatocellular Carcinoma in Clinical Practice: A United States Cohort. J. Hepatol. 2016, 65, 1148–1154. 10.1016/j.jhep.2016.07.025. [DOI] [PMC free article] [PubMed] [Google Scholar]
- Kim H. Y.; Nam J.; Lee J. H.; Lee H.; Chang Y.; Lee H.; Cho H.; Lee D.; Cho Y.; Cho E.; et al. Intensity of Surveillance for Hepatocellular Carcinoma Determines Survival in Patients at Risk in a Hepatitis B-Endemic Area. Aliment. Pharmacol. Ther. 2018, 47, 1490–1501. 10.1111/apt.14623. [DOI] [PubMed] [Google Scholar]
- Tzartzeva K.; Obi J.; Rich N. E.; Parikh N. D.; Marrero J. A.; Yopp A.; Waljee A. K.; Singal A. G. Surveillance Imaging and Alpha Fetoprotein for Early Detection of Hepatocellular Carcinoma in Patients with Cirrhosis: A Meta-Analysis. Gastroenterology 2018, 154, 1706–1718. 10.1053/j.gastro.2018.01.064. [DOI] [PMC free article] [PubMed] [Google Scholar]
- Singal A. G.; Lampertico P.; Nahon P. Epidemiology and Surveillance for Hepatocellular Carcinoma: New Trends. J. Hepatol. 2020, 72, 250–261. 10.1016/j.jhep.2019.08.025. [DOI] [PMC free article] [PubMed] [Google Scholar]
- Toyoda H.; Kumada T.; Osaki Y.; Oka H.; Urano F.; Kudo M.; Matsunaga T. Staging Hepatocellular Carcinoma by a Novel Scoring System (Balad Score) Based on Serum Markers. Clin. Gastroenterol. Hepatol. 2006, 4, 1528–1536. 10.1016/j.cgh.2006.09.021. [DOI] [PubMed] [Google Scholar]
- Johnson P. J.; Pirrie S. J.; Cox T. F.; Berhane S.; Teng M.; Palmer D.; Morse J.; Hull D.; Patman G.; Kagebayashi C.; et al. The Detection of Hepatocellular Carcinoma Using a Prospectively Developed and Validated Model Based on Serological Biomarkers. Cancer Epidemiol. Prev. Biomarkers 2014, 23, 144–153. 10.1158/1055-9965.EPI-13-0870. [DOI] [PubMed] [Google Scholar]
- Shin J.; Song S.-Y.; Ahn H.-S.; An B. C.; Choi Y.-D.; Yang E. G.; Na K.-J.; Lee S.-T.; Park J.-I.; Kim S.-Y.; et al. Integrative Analysis for the Discovery of Lung Cancer Serological Markers and Validation by Mrm-Ms. PLoS One 2017, 12, e0183896 10.1371/journal.pone.0183896. [DOI] [PMC free article] [PubMed] [Google Scholar]
- Bhardwaj M.; Gies A.; Weigl K.; Tikk K.; Benner A.; Schrotz-King P.; Borchers C. H.; Brenner H. Evaluation and Validation of Plasma Proteins Using Two Different Protein Detection Methods for Early Detection of Colorectal Cancer. Cancers 2019, 11, 1426. 10.3390/cancers11101426. [DOI] [PMC free article] [PubMed] [Google Scholar]
- Chi L.-M.; Hsiao Y.-C.; Chien K.-Y.; Chen S.-F.; Chuang Y.-N.; Lin S.-Y.; Wang W.-S.; Chang I. Y.-F.; Yang C.; Chu L. J.; et al. Assessment of Candidate Biomarkers in Paired Saliva and Plasma Samples from Oral Cancer Patients by Targeted Mass Spectrometry. J. Proteomics 2020, 211, 103571 10.1016/j.jprot.2019.103571. [DOI] [PubMed] [Google Scholar]
- Goldman R.; Ressom H. W.; Abdel-Hamid M.; Goldman L.; Wang A.; Varghese R. S.; An Y.; Loffredo C. A.; Drake S. K.; Eissa S. A.; et al. Candidate Markers for the Detection of Hepatocellular Carcinoma in Low-Molecular Weight Fraction of Serum. Carcinogenesis 2007, 28, 2149–2153. 10.1093/carcin/bgm177. [DOI] [PMC free article] [PubMed] [Google Scholar]
- Goldman R.; Ressom H. W.; Varghese R. S.; Goldman L.; Bascug G.; Loffredo C. A.; Abdel-Hamid M.; Gouda I.; Ezzat S.; Kyselova Z.; et al. Detection of Hepatocellular Carcinoma Using Glycomic Analysis. Clin. Cancer Res. 2009, 15, 1808–1813. 10.1158/1078-0432.CCR-07-5261. [DOI] [PMC free article] [PubMed] [Google Scholar]
- Yeo I.; Kim G. A.; Kim H.; Lee J. H.; Sohn A.; Gwak G. Y.; Lee J. H.; Lim Y. S.; Kim Y. Proteome Multimarker Panel with Multiple Reaction Monitoring-Mass Spectrometry for Early Detection of Hepatocellular Carcinoma. Hepatol. Commun. 2020, 4, 753–768. 10.1002/hep4.1500. [DOI] [PMC free article] [PubMed] [Google Scholar]
- Bruix J.; Sherman M.; Management of Hepatocellular Carcinoma: An Update. Hepatology 2011, 53, 1020–1022. 10.1002/hep.24199. [DOI] [PMC free article] [PubMed] [Google Scholar]
- Emwas A.-H.; Saccenti E.; Gao X.; McKay R. T.; Dos Santos V. A. M.; Roy R.; Wishart D. S. Recommended Strategies for Spectral Processing and Post-Processing of 1d 1 H-Nmr Data of Biofluids with a Particular Focus on Urine. Metabolomics 2018, 14, 1–23. 10.1007/s11306-018-1321-4. [DOI] [PMC free article] [PubMed] [Google Scholar]
- DeLong E. R.; DeLong D. M.; Clarke-Pearson D. L. Comparing the Areas under Two or More Correlated Receiver Operating Characteristic Curves: A Nonparametric Approach. Biometrics 1988, 44, 837–845. 10.2307/2531595. [DOI] [PubMed] [Google Scholar]
- Youden W. J. Index for Rating Diagnostic Tests. Cancer 1950, 3, 32–35. . [DOI] [PubMed] [Google Scholar]
- Trevisani F.; D’Intino P. E.; Morselli-Labate A. M.; Mazzella G.; Accogli E.; Caraceni P.; Domenicali M.; De Notariis S.; Roda E.; Bernardi M. Serum A-Fetoprotein for Diagnosis of Hepatocellular Carcinoma in Patients with Chronic Liver Disease: Influence of Hbsag and Anti-Hcv Status. J. Hepatol. 2001, 34, 570–575. 10.1016/S0168-8278(00)00053-2. [DOI] [PubMed] [Google Scholar]
- Anderson N. L.; Anderson N. G. The Human Plasma Proteome: History, Character, and Diagnostic Prospects. Mol. Cell. Proteomics 2002, 1, 845–867. 10.1074/mcp.R200007-MCP200. [DOI] [PubMed] [Google Scholar]
- Percy A. J.; Chambers A. G.; Yang J.; Jackson A. M.; Domanski D.; Burkhart J.; Sickmann A.; Borchers C. H. Method and Platform Standardization in Mrm-Based Quantitative Plasma Proteomics. J. Proteomics 2013, 95, 66–76. 10.1016/j.jprot.2013.07.026. [DOI] [PubMed] [Google Scholar]
- Rai A. J.; Gelfand C. A.; Haywood B. C.; Warunek D. J.; Yi J.; Schuchard M. D.; Mehigh R. J.; Cockrill S. L.; Scott G. B.; Tammen H.; et al. Hupo Plasma Proteome Project Specimen Collection and Handling: Towards the Standardization of Parameters for Plasma Proteome Samples. Proteomics 2005, 5, 3262–3277. 10.1002/pmic.200401245. [DOI] [PubMed] [Google Scholar]
- Addona T. A.; Abbatiello S. E.; Schilling B.; Skates S. J.; Mani D.; Bunk D. M.; Spiegelman C. H.; Zimmerman L. J.; Ham A.-J. L.; Keshishian H.; et al. Multi-Site Assessment of the Precision and Reproducibility of Multiple Reaction Monitoring–Based Measurements of Proteins in Plasma. Nat. Biotechnol. 2009, 27, 633–641. 10.1038/nbt.1546. [DOI] [PMC free article] [PubMed] [Google Scholar]
- Chambers A. G.; Percy A. J.; Simon R.; Borchers C. H. Mrm for the Verification of Cancer Biomarker Proteins: Recent Applications to Human Plasma and Serum. Expert Rev. Proteomics 2014, 11, 137–148. 10.1586/14789450.2014.877346. [DOI] [PubMed] [Google Scholar]
- Domanski D.; Percy A. J.; Yang J.; Chambers A. G.; Hill J. S.; Freue G. V. C.; Borchers C. H. Mrm-Based Multiplexed Quantitation of 67 Putative Cardiovascular Disease Biomarkers in Human Plasma. Proteomics 2012, 12, 1222–1243. 10.1002/pmic.201100568. [DOI] [PubMed] [Google Scholar]
- Surinova S.; Hüttenhain R.; Chang C.-Y.; Espona L.; Vitek O.; Aebersold R. Automated Selected Reaction Monitoring Data Analysis Workflow for Large-Scale Targeted Proteomic Studies. Nat. Protoc. 2013, 8, 1602–1619. 10.1038/nprot.2013.091. [DOI] [PubMed] [Google Scholar]
- Kennedy J. J.; Abbatiello S. E.; Kim K.; Yan P.; Whiteaker J. R.; Lin C.; Kim J. S.; Zhang Y.; Wang X.; Ivey R. G.; et al. Demonstrating the Feasibility of Large-Scale Development of Standardized Assays to Quantify Human Proteins. Nat. Methods 2014, 11, 149–155. 10.1038/nmeth.2763. [DOI] [PMC free article] [PubMed] [Google Scholar]
- Singal A.; Volk M.; Waljee A.; Salgia R.; Higgins P.; Rogers M.; Marrero J. Meta-Analysis: Surveillance with Ultrasound for Early-Stage Hepatocellular Carcinoma in Patients with Cirrhosis. Aliment. Pharmacol. Ther. 2009, 30, 37–47. 10.1111/j.1365-2036.2009.04014.x. [DOI] [PMC free article] [PubMed] [Google Scholar]
- Simmons O.; Fetzer D. T.; Yokoo T.; Marrero J. A.; Yopp A.; Kono Y.; Parikh N.; Browning T.; Singal A. G. Predictors of Adequate Ultrasound Quality for Hepatocellular Carcinoma Surveillance in Patients with Cirrhosis. Aliment. Pharmacol. Ther. 2017, 45, 169–177. 10.1111/apt.13841. [DOI] [PMC free article] [PubMed] [Google Scholar]
- Fattovich G.; Stroffolini T.; Zagni I.; Donato F. Hepatocellular Carcinoma in Cirrhosis: Incidence and Risk Factors. Gastroenterology 2004, 127, S35–S50. 10.1053/j.gastro.2004.09.014. [DOI] [PubMed] [Google Scholar]
- Kim S. Y.; An J.; Lim Y.-S.; Han S.; Lee J.-Y.; Byun J. H.; Won H. J.; Lee S. J.; Lee H. C.; Lee Y. S. Mri with Liver-Specific Contrast for Surveillance of Patients with Cirrhosis at High Risk of Hepatocellular Carcinoma. JAMA Oncol. 2017, 3, 456–463. 10.1001/jamaoncol.2016.3147. [DOI] [PMC free article] [PubMed] [Google Scholar]
- Pocha C.; Dieperink E.; McMaken K.; Knott A.; Thuras P.; Ho S. Surveillance for Hepatocellular Cancer with Ultrasonography Vs. Computed Tomography–a Randomised Study. Aliment. Pharmacol. Ther. 2013, 38, 303–312. 10.1111/apt.12370. [DOI] [PubMed] [Google Scholar]
- Park H. J.; Jang H. Y.; Kim S. Y.; Lee S. J.; Won H. J.; Byun J. H.; Choi S. H.; Lee S. S.; An J.; Lim Y.-S. Non-Enhanced Magnetic Resonance Imaging as a Surveillance Tool for Hepatocellular Carcinoma: Comparison with Ultrasound. J. Hepatol. 2020, 72, 718–724. 10.1016/j.jhep.2019.12.001. [DOI] [PubMed] [Google Scholar]
- Farvardin S.; Patel J.; Khambaty M.; Yerokun O. A.; Mok H.; Tiro J. A.; Yopp A. C.; Parikh N. D.; Marrero J. A.; Singal A. G. Patient-Reported Barriers Are Associated with Lower Hepatocellular Carcinoma Surveillance Rates in Patients with Cirrhosis. Hepatology 2017, 65, 875–884. 10.1002/hep.28770. [DOI] [PMC free article] [PubMed] [Google Scholar]
- Lee Y.-S.; Ko E.; Yoon E. L.; Jung Y. K.; Kim J. H.; Seo Y. S.; Yim H. J.; Kim K.-H.; Kwon S. Y.; Yeon J. E.; et al. Multiplexed Proteomic Approach for Identification of Serum Biomarkers in Hepatocellular Carcinoma Patients with Normal Afp. J. Clin. Med. 2020, 9, 323. 10.3390/jcm9020323. [DOI] [PMC free article] [PubMed] [Google Scholar]
- Du Z.; Liu X.; Wei X.; Luo H.; Li P.; Shi M.; Guo B.; Cui Y.; Su Z.; Zeng J.; et al. Quantitative Proteomics Identifies a Plasma Multi-Protein Model for Detection of Hepatocellular Carcinoma. Sci. Rep. 2020, 10, 15552 10.1038/s41598-020-72510-9. [DOI] [PMC free article] [PubMed] [Google Scholar]
- Kim H.; Kim K.; Yu S. J.; Jang E. S.; Yu J.; Cho G.; Yoon J.-H.; Kim Y. Development of Biomarkers for Screening Hepatocellular Carcinoma Using Global Data Mining and Multiple Reaction Monitoring. PLoS One 2013, 8, e63468 10.1371/journal.pone.0063468. [DOI] [PMC free article] [PubMed] [Google Scholar]
- Liu H.; Chen H.; Wu X.; Sun Y.; Wang Y.; Zeng Y.; Chen G.; Liu X.; Xing X.; Zhao B.; et al. The Serum Proteomics Tracking of Hepatocellular Carcinoma Early Recurrence Following Radical Resection. Cancer Manag. Res. 2019, 11, 2935. 10.2147/CMAR.S190561. [DOI] [PMC free article] [PubMed] [Google Scholar]
- Fye H. K.; Wright-Drakesmith C.; Kramer H. B.; Camey S.; da Costa A. N.; Jeng A.; Bah A.; Kirk G. D.; Sharif M. I.; Ladep N. G. Protein Profiling in Hepatocellular Carcinoma by Label-Free Quantitative Proteomics in Two West African Populations. PLoS One 2013, 8, e68381 10.1371/journal.pone.0068381. [DOI] [PMC free article] [PubMed] [Google Scholar]
- Hoofnagle A. N.; Whiteaker J. R.; Carr S. A.; Kuhn E.; Liu T.; Massoni S. A.; Thomas S. N.; Townsend R. R.; Zimmerman L. J.; Boja E.; et al. Recommendations for the Generation, Quantification, Storage, and Handling of Peptides Used for Mass Spectrometry–Based Assays. Clin. Chem. 2016, 62, 48–69. 10.1373/clinchem.2015.250563. [DOI] [PMC free article] [PubMed] [Google Scholar]
- Hosmer D. W. Jr; Lemeshow S.; Sturdivant R. X.. Applied Logistic Regression; John Wiley & Sons, 2013. [Google Scholar]
- Daniele B.; Bencivenga A.; Megna A. S.; Tinessa V. A-Fetoprotein and Ultrasonography Screening for Hepatocellular Carcinoma. Gastroenterology 2004, 127, S108–S112. 10.1053/j.gastro.2004.09.023. [DOI] [PubMed] [Google Scholar]
- Inagaki Y.; Tang W.; Makuuchi M.; Hasegawa K.; Sugawara Y.; Kokudo N. Clinical and Molecular Insights into the Hepatocellular Carcinoma Tumour Marker Des-Γ-Carboxyprothrombin. Liver Int. 2011, 31, 22–35. 10.1111/j.1478-3231.2010.02348.x. [DOI] [PubMed] [Google Scholar]
- Di Bisceglie A. M.; Hoofnagle J. H. Elevations in Serum Alpha-Fetoprotein Levels in Patients with Chronic Hepatitis B. Cancer 1989, 64, 2117–2120. . [DOI] [PubMed] [Google Scholar]
- Feng J. T.; Liu Y. K.; Song H. Y.; Dai Z.; Qin L. X.; Almofti M. R.; Fang C. Y.; Lu H. J.; Yang P. Y.; Tang Z. Y. Heat-Shock Protein 27: A Potential Biomarker for Hepatocellular Carcinoma Identified by Serum Proteome Analysis. Proteomics 2005, 5, 4581–4588. 10.1002/pmic.200401309. [DOI] [PubMed] [Google Scholar]
- Megger D. A.; Naboulsi W.; Meyer H. E.; Sitek B. Proteome Analyses of Hepatocellular Carcinoma. J. Clin. Transl. Hepatol. 2014, 2, 23. 10.14218/JCTH.2013.00022. [DOI] [PMC free article] [PubMed] [Google Scholar]
- Zeng Y.; He H.; An Z. Advance of Serum Biomarkers and Combined Diagnostic Panels in Nonalcoholic Fatty Liver Disease. Dis. Markers 2022, 2022, 1254014 10.1155/2022/1254014. [DOI] [PMC free article] [PubMed] [Google Scholar]
- Lin Y.; Zhu J.; Zhang J.; Dai J.; Liu S.; Arroyo A.; Rose M.; Singal A. G.; Parikh N. D.; Lubman D. M. Glycopeptides with Sialyl Lewis Antigen in Serum Haptoglobin as Candidate Biomarkers for Nonalcoholic Steatohepatitis Hepatocellular Carcinoma Using a Higher-Energy Collision-Induced Dissociation Parallel Reaction Monitoring-Mass Spectrometry Method. ACS Omega 2022, 7, 22850–22860. 10.1021/acsomega.2c02600. [DOI] [PMC free article] [PubMed] [Google Scholar]
Associated Data
This section collects any data citations, data availability statements, or supplementary materials included in this article.