Abstract
Background
Visual assessment remains the standard for evaluating emphysema at CT; however, it is time consuming, is subjective, requires training, and is affected by variability that may limit sensitivity to longitudinal change.
Purpose
To evaluate the clinical and imaging significance of increasing emphysema severity as graded by a deep learning algorithm on sequential CT scans in cigarette smokers.
Materials and Methods
A secondary analysis of the prospective Genetic Epidemiology of Chronic Obstructive Pulmonary Disease (COPDGene) study participants was performed and included baseline and 5-year follow-up CT scans from 2007 to 2017. Emphysema was classified automatically according to the Fleischner emphysema grading system at baseline and 5-year follow-up using a deep learning model. Baseline and change in clinical and imaging parameters at 5-year follow-up were compared in participants whose emphysema progressed versus those who did not. Kaplan-Meier analysis and multivariable Cox regression were used to assess the relationship between emphysema score progression and mortality.
Results
A total of 5056 participants (mean age, 60 years ± 9 [SD]; 2566 men) were evaluated. At 5-year follow-up, 1293 of the 5056 participants (26%) had emphysema progression according to the Fleischner grading system. This group demonstrated progressive airflow obstruction (forced expiratory volume in 1 second [percent predicted]: −3.4 vs −1.8), a greater decline in 6-minute walk distance (−177 m vs −124 m), and greater progression in quantitative emphysema extent (adjusted lung density: −1.4 g/L vs 0.5 g/L; percentage of lung voxels with CT attenuation less than −950 HU: 0.6 vs 0.2) than those with nonprogressive emphysema (P < .001 for each). Multivariable Cox regression analysis showed a higher mortality rate in the group with emphysema progression, with an estimated hazard ratio of 1.5 (95% CI: 1.2, 1.8; P < .001).
Conclusion
An increase in Fleischner emphysema grade on sequential CT scans using an automated deep learning algorithm was associated with increased functional impairment and increased risk of mortality.
ClinicalTrials.gov registration no. NCT00608764
© RSNA, 2022
Online supplemental material is available for this article.
See also the editorial by Grenier in this issue.
Summary
Emphysema progression on CT scans scored using a deep learning algorithm was associated with increased functional impairment and mortality at 5-year follow-up.
Key Results
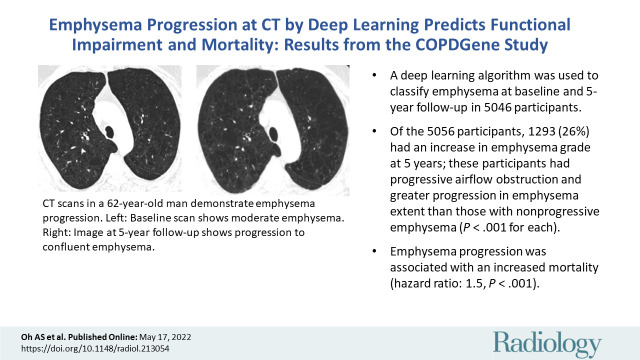
■ A deep learning algorithm was used to classify emphysema at baseline and 5-year follow-up in 5056 participants.
■ Of the 5056 participants, 1293 (26%) had an increase in emphysema grade at 5 years; these participants had progressive airflow obstruction, greater decline in 6-minute walk distance, and greater progression in emphysema extent than those with nonprogressive emphysema (P < .001 for each).
■ Emphysema progression was associated with an increased mortality (hazard ratio: 1.5, P < .001).
Introduction
Chronic obstructive pulmonary disease (COPD) is a progressive and debilitating respiratory condition that causes substantial morbidity and mortality (1). CT captures the presence, pattern, and extent of phenotypic abnormalities associated with COPD. Both visual and quantitative CT assessments have been extensively validated and are considered complementary methods for the evaluation of COPD. Quantitative CT assessment based on lung densitometry is established both clinically and pathologically as an objective measure of emphysema severity (2–4). Although studies have demonstrated correlations between the extent of emphysema at CT with pulmonary physiology and quality-of-life measures, CT densitometry provides no information about the morphologic characteristics of the emphysema pattern.
Visual assessment of CT scans enables diagnosis of emphysema and direct assessment of its presence and distribution (5). Visual classification of emphysema subtypes has been associated with mortality risk, lung cancer, and impaired function (6–10). The Fleischner Society published a system for visual grading of emphysema severity that has been validated as an independent predictor of future progression and increased mortality risk (6,11). Standardized visual assessment, however, can be time consuming, is subjective, and requires dedicated training, making it impractical for routine use (12,13).
Advanced computerized assessments have shown promise for improved emphysema phenotyping at CT (14,15). Humphries et al (16) recently described a deep learning algorithm capable of automatic classification of CT emphysema severity using the Fleischner Society scoring system (17). The deep learning algorithm, based on convolutional neural network and long short-term memory architectures, was trained to classify patterns of parenchymal emphysema according to Fleischner criteria. The algorithm was trained using baseline CT scans and visual scores on a subset of Genetic Epidemiology of COPD (COPDGene) participants. In validation testing using a nonoverlapping subset of 7143 COPDGene baseline CT scans, deep learning scores showed moderate concordance with visual scores and stronger associations than visual evaluation when compared with physiologic impairment and mortality risk. Additional validation in an independent cohort (Evaluation of COPD Longitudinally to Identify Predictive Surrogate Endpoints, or ECLIPSE) showed similar results.
Our purpose was to evaluate the significance of increased emphysema severity, as graded by a deep learning algorithm on sequential CT scans according to the Fleischner Society emphysema classification system in cigarette smokers. We sought to determine the relationship of clinical, physiologic, and imaging outcomes in those who progressed by one or more emphysema grades according to the Fleischner system versus those who did not progress.
Materials and Methods
Study Participants
This study is a secondary analysis from COPDGene (ClinicalTrials.gov identifier: NCT00608764), a prospective, multicenter study focused on the genetic epidemiology of COPD (18). Between 2007 and 2012, 10 192 individuals aged 45–80 years with at least a 10 pack-year smoking history were enrolled in this Health Insurance Portability and Accountability Act–compliant study at 21 clinical centers in the United States. Institutional review board approval of the research protocol was obtained at all clinical centers. Smokers were enrolled based on smoking history and classified using the Global Initiative for Lung Disease, or GOLD, spirometric criteria based on postbronchodilator spirometry. Participants self-identified as non-Hispanic African American or non-Hispanic white race. Those with respiratory conditions other than asthma and COPD were excluded from the study. Written informed consent was obtained from all study participants. In addition to CT, clinical evaluation included baseline spirometry, the 6-minute walk test, and standardized questionnaires including St George’s Respiratory Questionnaire and modified Medical Research Council dyspnea score (see Appendix E1 [online] for details) (19,20). Deaths were reported to the central study from clinical centers, and the Social Security Death Index was used to determine survival or censoring time for each participant (6).
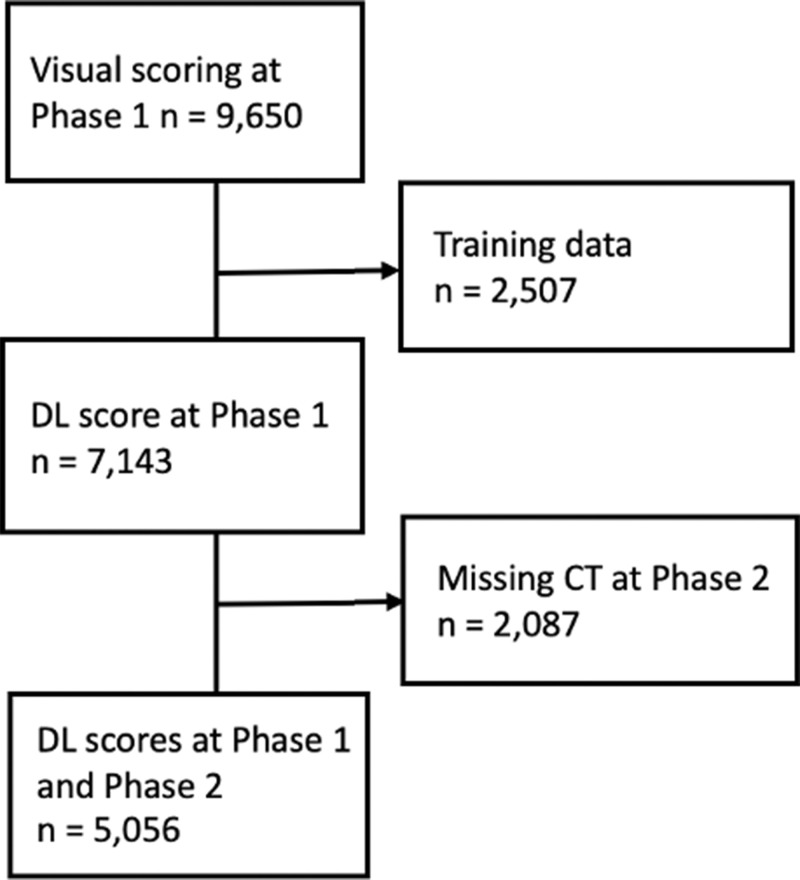
This report is based on 5056 COPDGene participants who had automatic scoring of emphysema at CT according to the Fleischner classification system using a deep learning algorithm, which has been previously described (16). Briefly, emphysema severity was graded as absent (score, 0), trace (score, 1), mild (score, 2), moderate (score, 3), confluent (score, 4), or advanced destructive (score, 5). Participants with baseline (phase I, 2007–2012) and 5-year follow-up (phase II, 2013–2017) inspiratory CT scans and deep learning scores were included (Fig 1). Follow-up for mortality analysis after the phase II scans continued up to 10.6 years. Separate analysis was performed on 2087 participants who did not return for follow-up CT imaging at phase II. See Table E1 (online) for details.
Figure 1:
Flowchart of study population. DL = deep learning.
Quantitative CT Analysis
All participants underwent volumetric noncontrast axial inspiratory and expiratory CT using a standardized protocol (18,21). The scans were reconstructed with a section thickness of 0.625, 0.75, or 0.9 mm depending on the CT manufacturer; corresponding section intervals were 0.625, 0.5, or 0.45 mm, respectively, to achieve near-isotropic voxels (22). Quantitative analysis of emphysema extent was performed using a dedicated software program (LungQ, version 1.0.0; Thirona). Emphysema was quantified using the 15th percentile lung density method adjusted for inspiratory lung volume and percentage of lung voxels with CT attenuation less than −950 HU (LAA-950) on inspiratory CT scans as previously described (23–26).
Deep Learning Algorithm Development and Training
A deep learning model was developed and validated using Python (version 3.6; Python Software Foundation, https://www.python.org/) and PyTorch (version 0.4.1; https://pytorch.org) as previously reported (16). The model source code can be accessed at https://gitlab.njhealth.org/qil_public/emphysema_v1_public/-/tree/main. Briefly, our deep learning algorithm was trained on categorical visual scores assigned by two trained research analysts, with disagreements greater than one grade adjudicated by a thoracic radiologist with more than 30 years of experience (D.A.L.). The model architecture includes convolutional layers and a long short-term memory component to process 25 axial sections sampled from each volumetric CT examination, outputting a probability (on a scale of 0.0–1.0) for each Fleischner emphysema classification category. This output was treated as a discrete probability distribution, and the final classification was calculated as the probability-weighted average of the categories rounded to the nearest integer.
Statistical Analysis
Descriptive statistics between emphysema scores and demographic and functional parameters were computed. One-way analysis of variance was used to test for significant differences in percent predicted forced expiratory volume in 1 second (FEV1), ratio of FEV1 to forced vital capacity (FVC), St George’s Respiratory Questionnaire score, quantitative CT emphysema value, and smoking history stratified according to emphysema scores. Quantitative emphysema value was computed as LAA-950. χ2 tests of independence were used to compare Global Initiative for Lung Disease stage and other categorical characteristics between emphysema severity scores.
The median length of follow-up after the phase II scan in this data set was 4.9 years (range, 30 days to 10.6 years). Kaplan-Meier plots were used to visualize mortality according to emphysema scores. Multivariable analysis of risk of death according to emphysema grade was performed using shared frailty models, an extension of Cox proportional hazard models that account for variability between study sites. A normally distributed random effect was included as a linear predictor to account for correlation in the data due to clustering of participants by study site.
Statistical calculations were performed using R software (version 3.4.4; R Foundation for Statistical Computing). P < .05 was considered to indicate a statistically significant difference.
Results
Participant Characteristics
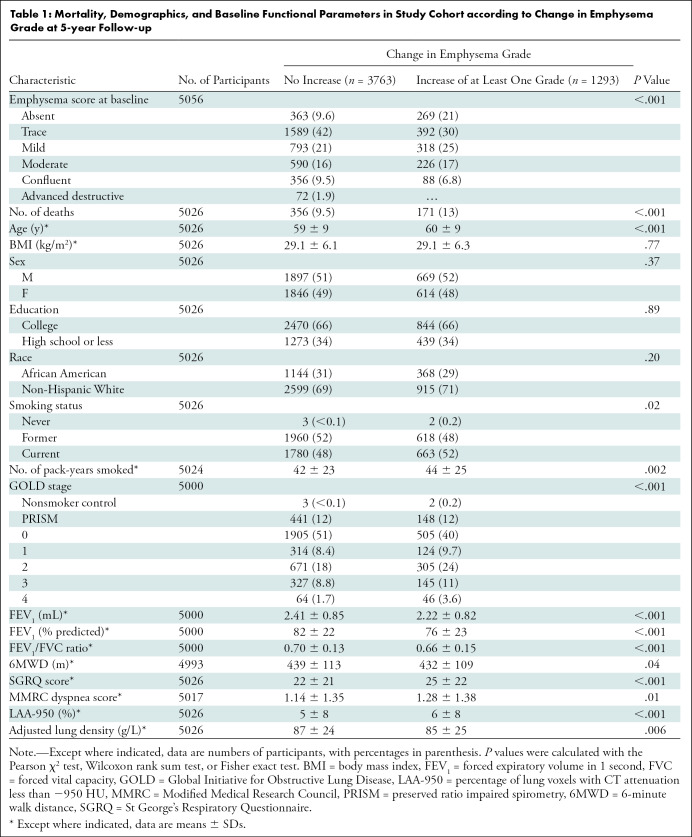
A total of 5056 current and former smokers (2566 men and 2490 women) were evaluated (Table 1). A total of 2087 participants did not return for CT imaging at phase II; these patients were excluded from our primary analysis (Fig 1). See Table E1 (online) for additional details. The mean age at enrollment was 60 years ± 9 (SD), with a mean age of 60 years ± 9 for men and 59 years ± 9 for women. The emphysema score increased by one or more Fleischner categories in 1293 of the 5056 participants (26%) and did not progress at phase II in 3763 (74%). Compared with participants whose emphysema grade did not progress, those who progressed were older and more likely to be current smokers with a higher tobacco exposure at baseline. An increase in emphysema score was also associated with lower baseline percent predicted FEV1, lower FEV1/FVC ratio, shorter 6-minute walk distance, lower disease-specific quality of life, and more dyspnea. Radiologically, participants with emphysema grade progression at phase II had a higher LAA-950 and lower adjusted lung density (ALD).
Table 1:
Mortality, Demographics, and Baseline Functional Parameters in Study Cohort according to Change in Emphysema Grade at 5-year Follow-up
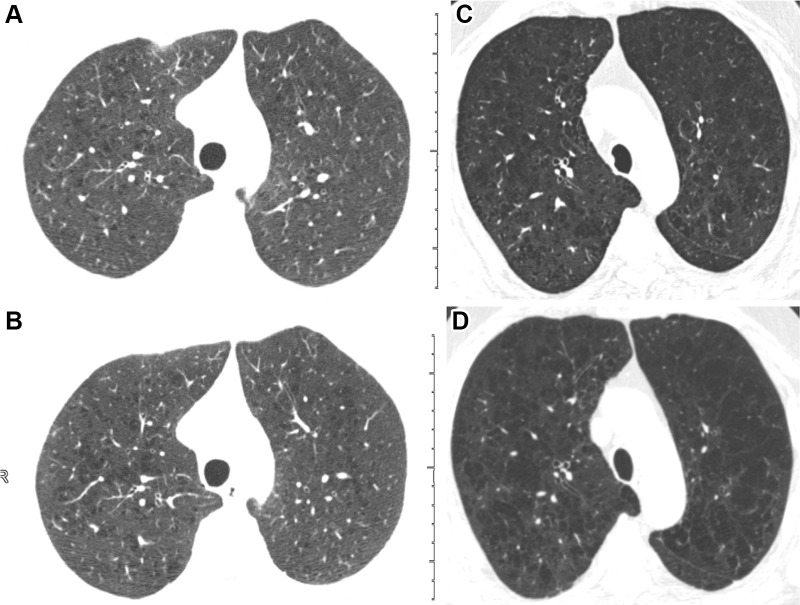
Within the group whose emphysema score progressed at phase II, most of the progression was by one category and predominantly in participants with absent, trace, or mild baseline emphysema scores (Table E2 [online]). An example of two participants who progressed according to the deep learning model are shown in Figure 2. Figure 3 shows a representative example of a participant without emphysema progression. In the group with nonprogressive emphysema scores at phase II, the score in 693 of 3763 participants (18%) decreased by one or more categories (Table E2 [online]). Most of these occurred in participants with trace or mild baseline emphysema scores.
Figure 2:
Inspiratory axial noncontrast CT scans obtained at baseline and 5-year-follow-up in two participants demonstrate emphysema progression according to the deep learning automated method. (A) Baseline scan shows mild emphysema in a 49-year-old man. (B) Image obtained at 5-year follow-up shows progression to moderate emphysema. Forced expiratory volume in 1 second (FEV1) decreased by 677 mL. (C) Baseline scan shows moderate emphysema in a 62-year-old man. (D) Image obtained at 5-year follow-up shows progression to confluent emphysema. FEV1 decreased by 502 mL.
Figure 3:
Inspiratory axial noncontrast CT scans obtained at (A) baseline and (B) 5-year follow-up in a 73-year-old woman. There was no change in emphysema grade according to the deep learning automated method. Both baseline and 5-year follow-up scans show mild emphysema. Forced expiratory volume in 1 second did not change at follow-up.
Univariable Analysis
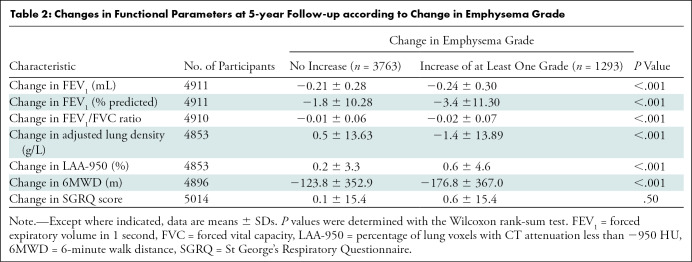
At 5-year follow-up, participants with an increase in emphysema grade demonstrated progressive airflow obstruction measured by mean percent predicted FEV1 (−3.4 vs −1.8, respectively; P < .001) and FEV1/FVC ratio (−0.02 vs −0.01, P < .001), a greater decline in mean 6 minute walk distance (−176.8 m vs −123.8 m, P < .001), and greater progression in mean quantitative emphysema extent (ALD, −1.4 g/L vs 0.5 g/L; LAA-950, 0.6 vs 0.2; P < .001 for each) than those with nonprogressive emphysema (Table 2). We found no evidence of a difference in disease-specific impact on quality of life between the two groups (St George’s Respiratory Questionnaire score, 0.6 vs 0.1; P = .50).
Table 2:
Changes in Functional Parameters at 5-year Follow-up according to Change in Emphysema Grade
Multivariable Survival Analysis
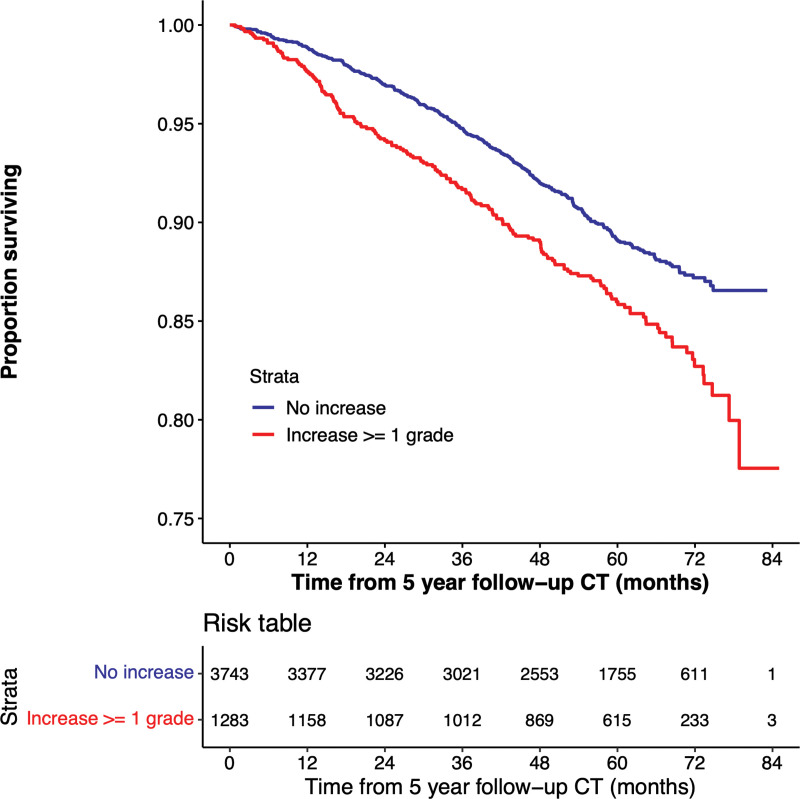
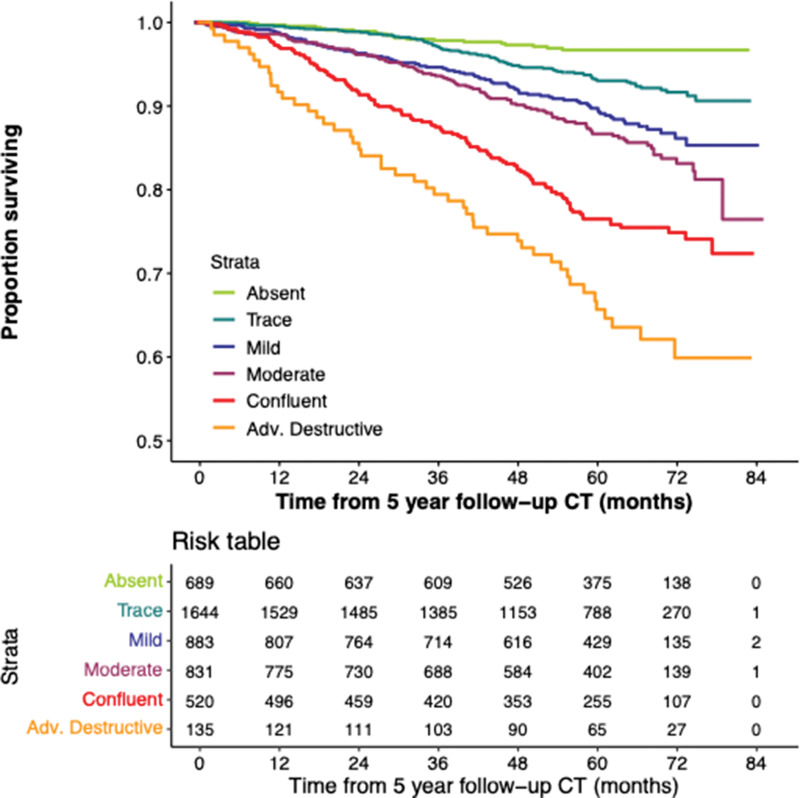
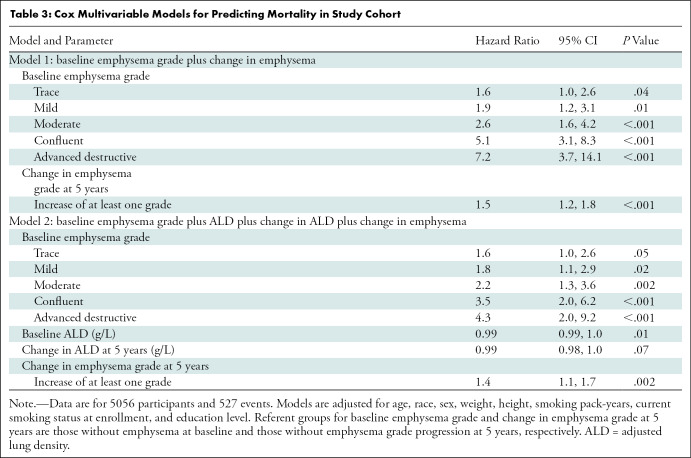
There were 527 deaths in the cohort (171 deaths in the participants whose emphysema grade progressed). Survival follow-up continued up to 85 months after phase II. Figure 4 shows the Kaplan-Meier plot for survival stratified according to change in emphysema score from phase I to phase II, and Figure 5 shows the Kaplan-Meier plot based on emphysema severity grade at phase II. Of the 5056 participants included for analysis, 30 were missing vital status and were not included for survival analysis. At multivariable analysis adjusted for age, race, sex, weight, height, smoking pack-years, smoking status at enrollment, and education level, increasing emphysema grade classified by deep learning at baseline was associated with a higher mortality rate compared with the referent group of absent emphysema (Table E3, model 1 [online]). Estimated hazard ratios were 1.5 (95% CI: 0.9, 2.4), 1.7 (95% CI: 1.1, 2.8), 2.4 (95% CI: 1.5, 3.9), 4.4 (95% CI: 2.7, 7.2), and 5.7 (95% CI: 3.0, 11.0) for trace, mild, moderate, confluent, and advanced destructive emphysema, respectively. An increase by at least one emphysema grade at phase II was associated with a higher mortality rate than the referent group of nonprogressive emphysema, with an estimated hazard ratio of 1.5 (95% CI: 1.2, 1.8; P < .001) (Table 3, model 1). The mortality associations for all baseline emphysema grades persisted after adjustment for change in emphysema grade at phase II. Change in emphysema grade remained a predictor of mortality after adjustment for baseline ALD and change in ALD, with an estimated hazard ratio of 1.4 (95% CI: 1.1, 1.7; P = .002) (Table 3, model 2).
Figure 4:
Kaplan-Meier plot shows the relationship between deep learning emphysema grade progression and survival. Lower survival is associated with emphysema progression in 5026 participants included in mortality analysis.
Figure 5:
Kaplan-Meier plot shows survival according to emphysema grade assessed at 5-year follow-up chest CT. Adv. = advanced.
Table 3:
Cox Multivariable Models for Predicting Mortality in Study Cohort
Additional Kaplan-Meier analysis and curves of the 2087 participants who did not return for CT at phase II are provided in Figure E1 (online). Of note, given that the Fleischner categories are bounded observations, progression of emphysema in participants in the highest risk category (ie, advanced destructive) cannot be measured. Results of univariate analysis accounting for this limitation by excluding participants with advanced destructive emphysema at phase I are shown in Table E4 (online).
Discussion
Using a previously validated computer algorithm for automatic grading of emphysema pattern according to the Fleischner Society criteria, we demonstrated that an increase in emphysema grade on sequential CT scans is associated with substantial disease progression and increased risk of mortality. In our current study, the 1293 participants whose deep learning emphysema score increased by one or more Fleischner categories demonstrated more airflow obstruction and dyspnea at baseline and had shorter 6-minute walk distances, greater extent of quantitative emphysema, and lower quality of life compared with those who did not progress. At 5-year follow-up, they had a more substantial increase in airflow obstruction and quantitative emphysema extent and a greater reduction in 6-minute walk distance than those who did not progress. Our findings extend the results of prior studies that have established the significance of baseline parenchymal emphysema pattern according to the Fleischner Society scoring system using visual methods, and its role in predicting future emphysema progression and mortality (6,11). They also underscore the significance of the automated deep learning algorithm, which previously was shown to more strongly correlate with clinical parameters than visual assessment (16).
One of the challenges of studying COPD is that the rate of progression is often slow, and the rate of FEV1 decline is traditionally used to quantify disease progression, despite changes on CT scans often predating spirometric impairment. Emphysema-specific and more sensitive parameters are needed to monitor disease progression and treatment effects. Quantitative CT using lung densitometry has been successfully used to prospectively detect changes in emphysema progression (27,28). A recent study by Ash et al (29) showed that in ever-smokers with emphysema, a decrease in adjusted lung density on sequential CT scans was associated with increased all-cause and respiratory mortality. Additional studies have tried to more fully characterize CT emphysema beyond its extent using texture-based methods and cluster analysis (30–32). Virdee et al (33) expanded on low-attenuation cluster analysis by investigating the spatial arrangement of emphysematous voxels within clusters and showed that so-called compactness of the CT emphysema voxels corresponded to the severity of COPD and better correlated with visual emphysema scores and lung function measurements than traditional CT densitometry methods.
Despite these established and newer quantitative methods, qualitative visual scoring continues to be the standard for emphysema assessment. Visual assessment, however, is time consuming, is subjective, requires training, and suffers variability that may limit sensitivity to longitudinal change (34). The deep learning technique used in our study mitigates these issues by automating image classification, which effectively eliminates the time burden and subjectivity of visual assessment. Moreover, the trained algorithm embodies the expert knowledge of the Fleischner scoring system, potentially allowing for distribution of the criteria at a global level and use as a training aide to foster wider adoption.
The classifier-based change in emphysema grade at 5 years proved to be more robust than the lung densitometry technique, remaining an independent predictor of mortality in multivariable models. The mortality association also persisted in models that included baseline emphysema grade stratified according to the Fleischner criteria, suggesting that longitudinal assessment of emphysema pattern provides added information that is independent of, and complementary to, lung densitometry and baseline emphysema score.
Of note, in the nonprogressive emphysema group, 18% (693 of 3763 participants) showed an apparent decrease in emphysema score at 5 years. Given that emphysema is defined as irreversible parenchymal destruction, we speculate that these findings are primarily due to technical factors, specifically under- or overestimation of the emphysema grade possibly due to differences in CT lung volume between baseline and follow-up scans. Our deep learning algorithm was trained on categorical visual scores; pattern differentiation at the extremes of the grading scale is subject to greater interobserver variation. The output of the deep learning model is essentially a prediction probability for each category that is rounded to the nearest integer for final output. Most of the “improved” cases occurred in the trace and mild categories (Table E2 [online]). It is likely that many of these “improved” cases represented no significant change in emphysema grade at interval imaging in participants who straddle the borderline between two categories.
Our study had some limitations. First, by including only smokers who returned for 5-year follow-up, we may have introduced selection bias by excluding those who were too ill or deceased. Second, because the deep learning algorithm was trained using only COPDGene data, our model could have been influenced by the specific CT protocol and selection biases present in this cohort. In addition, the multicenter design of our study could have introduced sources of variability, which are known to affect measures of lung densitometry and may also influence our deep learning system as they are trained on visual scores. Finally, deep learning methods are sometimes criticized for lacking interpretability. However, by anchoring the algorithm to a well-established and validated visual scoring system, classification outputs are clearly defined and can be intuitively understood by clinicians.
In conclusion, we applied a previously validated deep learning algorithm that automatically classifies emphysema pattern at CT according to the Fleischner classification system and demonstrated that an increase in emphysema severity score at 5 years was an independent predictor of disease progression and mortality. These results suggest the clinical value of automatic, structured grading of emphysema severity at CT for identification of patients at greater risk. Possible applications include lung health assessments at lung cancer screening or entry criteria for clinical trials.
The project was supported by grants R01HL089897 and R01HL089856 from the National Heart, Lung, and Blood Institute. The COPDGene project is also supported by the COPD Foundation Industry Advisory Board (with contributions from AstraZeneca, Boehringer Ingelheim, Novartis, Pfizer, Siemens, Sunovion, and GlaxoSmithKline).
Data Sharing: Data analyzed during the study were provided by a third party. Requests for data should be directed to the provider indicated in the Acknowledgements.
Disclosures of conflicts of interest: A.S.O. No relevant relationships. D.B. No relevant relationships. D.A.L. Grant to institution from Boehringer Ingelheim. S.Y.A. No relevant relationships. J.D.C. Chair of Board of Directors for COPD Foundation. S.M.H. Grant to institution from Boehringer Ingelheim and Veracyte; service contracts from Calyrx to institution; consulting fees from Veracyte, Boehringer Ingelheim, and Imidex; honorarium from WASOG/AASOG 2021 conference; patent application submitted and assigned to institution.
Abbreviations:
- ALD
- adjusted lung density
- COPD
- chronic obstructive pulmonary disease
- FEV1
- forced expiratory volume in 1 second
- FVC
- forced vital capacity
- LAA-950
- percentage of lung voxels with CT attenuation less than −950 HU
References
- 1. Qaseem A , Wilt TJ , Weinberger SE , et al . Diagnosis and management of stable chronic obstructive pulmonary disease: a clinical practice guideline update from the American College of Physicians, American College of Chest Physicians, American Thoracic Society, and European Respiratory Society . Ann Intern Med 2011. ; 155 ( 3):179 – 191. [DOI] [PubMed] [Google Scholar]
- 2. Müller NL , Staples CA , Miller RR , Abboud RT . “Density mask”. An objective method to quantitate emphysema using computed tomography . Chest 1988. ; 94 ( 4):782 – 787. [DOI] [PubMed] [Google Scholar]
- 3. Madani A , Zanen J , de Maertelaer V , Gevenois PA . Pulmonary emphysema: objective quantification at multi-detector row CT--comparison with macroscopic and microscopic morphometry . Radiology 2006. ; 238 ( 3):1036 – 1043. [DOI] [PubMed] [Google Scholar]
- 4. Crossley D , Renton M , Khan M , Low EV , Turner AM . CT densitometry in emphysema: a systematic review of its clinical utility . Int J Chron Obstruct Pulmon Dis 2018. ; 13 : 547 – 563. [DOI] [PMC free article] [PubMed] [Google Scholar]
- 5. Hruban RH , Meziane MA , Zerhouni EA , et al . High resolution computed tomography of inflation-fixed lungs. Pathologic-radiologic correlation of centrilobular emphysema . Am Rev Respir Dis 1987. ; 136 ( 4):935 – 940. [DOI] [PubMed] [Google Scholar]
- 6. Lynch DA , Moore CM , Wilson C , et al . CT-based Visual Classification of Emphysema: Association with Mortality in the COPDGene Study . Radiology 2018. ; 288 ( 3):859 – 866. [DOI] [PMC free article] [PubMed] [Google Scholar]
- 7. Carr LL , Jacobson S , Lynch DA , et al . Features of COPD as Predictors of Lung Cancer . Chest 2018. ; 153 ( 6):1326 – 1335. [DOI] [PMC free article] [PubMed] [Google Scholar]
- 8. Ostridge K , Williams NP , Kim V , et al . Relationship of CT-quantified emphysema, small airways disease and bronchial wall dimensions with physiological, inflammatory and infective measures in COPD . Respir Res 2018. ; 19 ( 1):31. [DOI] [PMC free article] [PubMed] [Google Scholar]
- 9. Matsuoka S , Yamashiro T , Washko GR , Kurihara Y , Nakajima Y , Hatabu H . Quantitative CT assessment of chronic obstructive pulmonary disease . RadioGraphics 2010. ; 30 ( 1):55 – 66. [DOI] [PubMed] [Google Scholar]
- 10. Park J , Hobbs BD , Crapo JD , et al . Subtyping COPD by Using Visual and Quantitative CT Imaging Features . Chest 2020. ; 157 ( 1):47 – 60. [DOI] [PMC free article] [PubMed] [Google Scholar]
- 11. El Kaddouri B , Strand MJ , Baraghoshi D , et al . Fleischner Society Visual Emphysema CT Patterns Help Predict Progression of Emphysema in Current and Former Smokers: Results from the COPDGene Study . Radiology 2021. ; 298 ( 2):441 – 449. [DOI] [PMC free article] [PubMed] [Google Scholar]
- 12. COPDGene CT Workshop Group ; Barr RG , Berkowitz EA , et al . A combined pulmonary-radiology workshop for visual evaluation of COPD: study design, chest CT findings and concordance with quantitative evaluation . COPD 2012. ; 9 ( 2):151 – 159. [DOI] [PMC free article] [PubMed] [Google Scholar]
- 13. Labaki WW , Martinez CH , Martinez FJ , et al . The Role of Chest Computed Tomography in the Evaluation and Management of the Patient with Chronic Obstructive Pulmonary Disease . Am J Respir Crit Care Med 2017. ; 196 ( 11):1372 – 1379. [DOI] [PMC free article] [PubMed] [Google Scholar]
- 14. Yang J , Angelini ED , Balte PP , et al . Novel Subtypes of Pulmonary Emphysema Based on Spatially-Informed Lung Texture Learning: The Multi-Ethnic Study of Atherosclerosis (MESA) COPD Study . IEEE Trans Med Imaging 2021. ; 40 ( 12):3652 – 3662. [DOI] [PMC free article] [PubMed] [Google Scholar]
- 15. Hasenstab KA , Yuan N , Retson T , et al . Automated CT Staging of Chronic Obstructive Pulmonary Disease Severity for Predicting Disease Progression and Mortality with a Deep Learning Convolutional Neural Network . Radiol Cardiothorac Imaging 2021. ; 3 ( 2):e200477. [DOI] [PMC free article] [PubMed] [Google Scholar]
- 16. Humphries SM , Notary AM , Centeno JP , et al . Deep Learning Enables Automatic Classification of Emphysema Pattern at CT . Radiology 2020. ; 294 ( 2):434 – 444. [DOI] [PMC free article] [PubMed] [Google Scholar]
- 17. Lynch DA , Austin JHM , Hogg JC , et al . CT-Definable Subtypes of Chronic Obstructive Pulmonary Disease: A Statement of the Fleischner Society . Radiology 2015. ; 277 ( 1):192 – 205. [DOI] [PMC free article] [PubMed] [Google Scholar]
- 18. Regan EA , Hokanson JE , Murphy JR , et al . Genetic epidemiology of COPD (COPDGene) study design . COPD 2010. ; 7 ( 1):32 – 43. [DOI] [PMC free article] [PubMed] [Google Scholar]
- 19. Jones PW , Quirk FH , Baveystock CM , Littlejohns P . A self-complete measure of health status for chronic airflow limitation. The St. George’s Respiratory Questionnaire . Am Rev Respir Dis 1992. ; 145 ( 6):1321 – 1327. [DOI] [PubMed] [Google Scholar]
- 20. Mahler DA , Wells CK . Evaluation of clinical methods for rating dyspnea . Chest 1988. ; 93 ( 3):580 – 586. [DOI] [PubMed] [Google Scholar]
- 21. Han MK , Bartholmai B , Liu LX , et al . Clinical significance of radiologic characterizations in COPD . COPD 2009. ; 6 ( 6):459 – 467. [DOI] [PubMed] [Google Scholar]
- 22. Schroeder JD , McKenzie AS , Zach JA , et al . Relationships between airflow obstruction and quantitative CT measurements of emphysema, air trapping, and airways in subjects with and without chronic obstructive pulmonary disease . AJR Am J Roentgenol 2013. ; 201 ( 3):W460 – W470. [DOI] [PMC free article] [PubMed] [Google Scholar]
- 23. Parr DG , Stoel BC , Stolk J , Stockley RA . Validation of computed tomographic lung densitometry for monitoring emphysema in alpha1-antitrypsin deficiency . Thorax 2006. ; 61 ( 6):485 – 490. [DOI] [PMC free article] [PubMed] [Google Scholar]
- 24. Stoel BC , Putter H , Bakker ME , et al . Volume correction in computed tomography densitometry for follow-up studies on pulmonary emphysema . Proc Am Thorac Soc 2008. ; 5 ( 9):919 – 924. [DOI] [PubMed] [Google Scholar]
- 25. Gevenois PA , de Maertelaer V , De Vuyst P , Zanen J , Yernault JC . Comparison of computed density and macroscopic morphometry in pulmonary emphysema . Am J Respir Crit Care Med 1995. ; 152 ( 2):653 – 657. [DOI] [PubMed] [Google Scholar]
- 26. Lynch DA , Al-Qaisi MA . Quantitative computed tomography in chronic obstructive pulmonary disease . J Thorac Imaging 2013. ; 28 ( 5):284 – 290. [DOI] [PMC free article] [PubMed] [Google Scholar]
- 27. Cavigli E , Camiciottoli G , Diciotti S , et al . Whole-lung densitometry versus visual assessment of emphysema . Eur Radiol 2009. ; 19 ( 7):1686 – 1692. [DOI] [PubMed] [Google Scholar]
- 28. Stolk J , Putter H , Bakker EM , et al . Progression parameters for emphysema: a clinical investigation . Respir Med 2007. ; 101 ( 9):1924 – 1930. [DOI] [PubMed] [Google Scholar]
- 29. Ash SY , San José Estépar R , Fain SB , et al . Relationship between Emphysema Progression at CT and Mortality in Ever-Smokers: Results from the COPDGene and ECLIPSE Cohorts . Radiology 2021. ; 299 ( 1):222 – 231. [DOI] [PMC free article] [PubMed] [Google Scholar]
- 30. Mishima M , Hirai T , Itoh H , et al . Complexity of terminal airspace geometry assessed by lung computed tomography in normal subjects and patients with chronic obstructive pulmonary disease . Proc Natl Acad Sci U S A 1999. ; 96 ( 16):8829 – 8834. [DOI] [PMC free article] [PubMed] [Google Scholar]
- 31. Gietema HA , Müller NL , Fauerbach PV , et al . Quantifying the extent of emphysema: factors associated with radiologists’ estimations and quantitative indices of emphysema severity using the ECLIPSE cohort . Acad Radiol 2011. ; 18 ( 6):661 – 671. [DOI] [PubMed] [Google Scholar]
- 32. Sørensen L , Nielsen M , Petersen J , Pedersen JH , Dirksen A , de Bruijne M . Chronic Obstructive Pulmonary Disease Quantification Using CT Texture Analysis and Densitometry: Results From the Danish Lung Cancer Screening Trial . AJR Am J Roentgenol 2020. ; 214 ( 6):1269 – 1279. [DOI] [PubMed] [Google Scholar]
- 33. Virdee S , Tan WC , Hogg JC , et al . Spatial Dependence of CT Emphysema in Chronic Obstructive Pulmonary Disease Quantified by Using Join-Count Statistics . Radiology 2021. ; 301 ( 3):702 – 709. [DOI] [PubMed] [Google Scholar]
- 34. Wille MMW , Thomsen LH , Dirksen A , Petersen J , Pedersen JH , Shaker SB . Emphysema progression is visually detectable in low-dose CT in continuous but not in former smokers . Eur Radiol 2014. ; 24 ( 11):2692 – 2699. [DOI] [PubMed] [Google Scholar]


