Abstract
In‐scanner head motion systematically reduces estimated regional gray matter volumes obtained from structural brain MRI. Here, we investigate how head motion affects structural covariance networks that are derived from regional gray matter volumetric estimates. We acquired motion‐affected and low‐motion whole brain T1‐weighted MRI in 29 healthy adult subjects and estimated relative regional gray matter volumes using a voxel‐based morphometry approach. Structural covariance network analyses were undertaken while systematically increasing the number of included motion‐affected scans. We demonstrate that the standard deviation in regional gray matter estimates increases as the number of motion‐affected scans increases. This increases pairwise correlations between regions, a key determinant for construction of structural covariance networks. We further demonstrate that head motion systematically alters graph theoretic metrics derived from these networks. Finally, we present evidence that weighting correlations using image quality metrics can mitigate the effects of head motion. Our findings suggest that in‐scanner head motion is a source of error that violates the assumption that structural covariance networks reflect neuroanatomical connectivity between brain regions. Results of structural covariance studies should be interpreted with caution, particularly when subject groups are likely to move their heads in the scanner.
Keywords: graph theory, morphometrics, quality control, volumetry
In‐scanner head motion systematically affects volumetric estimates that are used to construct structural covariance networks. Results of structural covariance studies should be interpreted with caution, particularly when subject groups are likely to move their heads in the scanner.
1. INTRODUCTION
Analysis of the covariance of regional grey matter volume and related morphometric measures across subjects is a widely used MRI‐based network analysis technique that is used to investigate neuroanatomical changes in disease and healthy aging (Alexander‐Bloch et al., 2010; Alexander‐Bloch, Giedd, et al., 2013; Alexander‐Bloch, Raznahan, et al., 2013; Bassett et al., 2008; Bernhardt et al., 2009; Bethlehem et al., 2017; Coppen et al., 2016; DuPre & Spreng, 2017; He et al., 2008; Irimia & Van Horn, 2013; Montembeault et al., 2012; Montembeault et al., 2016; Romero‐Garcia et al., 2018; Valk et al., 2015; Zhang et al., 2019). The primary underlying assumption of structural covariance analyses is that regional covariation of morphometric estimates reflects neuroanatomical connectivity between brain regions. In this study, we test this assumption by investigating the effect of in‐scanner head motion on construction and graph theoretic analysis of structural covariance networks.
In‐scanner head motion has been previously demonstrated to cause brain‐wide changes in morphometric estimates derived from structural MRI scans (Alexander‐Bloch et al., 2016; Pardoe et al., 2016; Reuter et al., 2015; Savalia et al., 2017). Increased head motion is generally associated with brain‐wide apparent reductions in cortical thickness and regional gray matter volume. Previous studies have shown that head motion is typically increased in disease groups relative to healthy controls and varies by age, with children and elderly adults showing increased head motion relative to adults aged between 15 and 40 years (Pardoe et al., 2016; Savalia et al., 2017). Although the effect of head motion on MRI‐based estimates of regional cortical thickness, volume and related neuroanatomical measures has been extensively described recently, the effect of motion on higher order multivariate analytical approaches such as structural covariance analysis is yet to be established.
Structural covariance networks are inferred by measuring the correlation of regional volume or other morphometric estimates between pairs of brain regions across subjects. Because head motion increases variability in regional morphometric estimates across the whole brain, it is likely that the concurrent variation in members of any pair of regional estimates is increased, increasing the measured correlation between these pairs. This effect can be conceptualized as a corollary of the restricted range phenomenon, in which the measured correlation between two variables is reduced if the sample is drawn from a limited range of the population (Goodwin & Leech, 2006). In the case of in‐scanner head motion, we hypothesize that the inclusion of motion‐affected scans will increase variability in morphometric estimates across subjects and subsequently increase the measured correlation between pairs of brain regions.
We investigated the effect of head motion on structural covariance networks by obtaining both motion‐affected and low‐motion whole brain T1‐weighted MRI scans in healthy adult subjects. The scans described as “low‐motion” can be considered equivalent to scans obtained in a typical clinical imaging setting. Our imaging dataset was used to obtain regional gray matter volume estimates following a voxel‐based morphometry (VBM) approach similar to that used in a number of prior studies (Bassett et al., 2008; Coppen et al., 2016; DuPre & Spreng, 2017; Montembeault et al., 2012; Montembeault et al., 2016; Zhang et al., 2019). We systematically varied the number of motion‐affected scans included in each group and assessed how this influenced metrics related to network construction and commonly used graph theoretic measures. Our primary analyses used the widely used AAL parcellation scheme; however, we also carried out additional analyses using a novel automated parcellation scheme that systematically varied the number of nodes used to parcellate a template.
Finally, we describe a postprocessing method for ameliorating the influence of subject motion on structural covariance networks. Our proposed approach used image quality metrics to weight GM volume estimates that were used to estimate interregional correlations, as opposed to using standard nonweighted correlations. Weighted correlations were derived from datasets that included motion‐affected scans and compared these with ground‐truth correlations derived from datasets that only included low‐motion scans. If weighted correlations were closer to ground truth low‐motion correlations than their standard unweighted equivalent, this provided supporting evidence that the approach may be a useful technique for addressing the problem of systematic errors in structural covariance networks due to in‐scanner head motion.
If the inclusion of motion‐affected scans affects the construction of structural covariance networks and derived metrics, regional covariance of volumes and related morphometric measures across subjects may not always reflect anatomical connectivity. In general, if subject groups differ in the amount of in‐scanner head motion, differences in graph theoretic network metrics derived from structural covariance analyses of these groups may not be due to neurobiological differences.
2. METHODS
Whole brain T1w MRI scans were obtained in 29 healthy control subjects recruited via community advertisement (mean age 33 ± 13 years, 13 female). Approval for the study was obtained from the NYU Langone Health Institutional Review Board, and written informed consent was obtained from all study participants. MRI scans and scripts associated with the analyses presented in this study are provided at https://openneuro.org/datasets/ds003639 (Pardoe & Martin, 2021).
Participants were imaged on a Siemens 3 T Prisma MRI scanner. Two T1w MPRAGE MRI scans were acquired per participant in each imaging session; a motion‐affected scan, in which participants moved their heads in stereotyped prompted motions during the scan, and a low motion scan in which participants held their head still. For a subset of study participants (N = 23) the motion‐affected and low‐motion acquisitions were repeated in the same scanning session, yielding four T1‐weighted MRI scans per participant (2 × motion‐affected, 2 × low‐motion). The low‐motion scans from the subset of participants with repeat scans were used to assess the test–retest reliability of regional correlations used to construct structural covariance. For the motion‐affected scans, in‐scanner head motion was prompted using a video presented to participants during the scan. Participants were instructed to shake their head in a “no” type motion, equivalent to roll around the long axis of the MRI scanner. Low‐motion scans were not rejected or repeated if subtle head motion artifacts were present. For all cases, the motion‐affected scans had substantially more visually detectable motion artifacts than the low‐motion scans.
Image acquisition parameters: MRI scans were acquired in the sagittal plane with a 256 mm2 field of view, 176 slices with 1 mm slice thickness to yield a 1 mm isotropic voxel size. Echo time (TE) = 3 ms, flip angle = 8°, inversion time (TI) = 0.9 s, repetition time = 2.5 s.
Image quality was quantitatively assessed using (i) the weighted overall image quality index obtained from the CAT12 SPM toolbox (version CAT12.8‐Beta (r1844), http://www.neuro.uni-jena.de/cat12-html/cat_methods_QA.html) and (ii) the Euler number, derived from cortical surface reconstructions obtained using the Freesurfer software package (v6.0; Dale et al., 1999). The latter measure summarizes the topological complexity of the surface delineating the boundary between white and gray matter and has been shown to reliably detect reduced image quality in T1‐weighted MRI scans (Rosen et al., 2018). For our analysis, we calculated the Euler number using the left and right cortical surfaces obtained prior to the Freesurfer topological defect correction routines; the surfaces are named “lh.nofix.orig” and “rh.nofix.orig,” respectively. The composite Euler numbers were then averaged across hemispheres as per the approach described by Rosen et al (Rosen et al., 2018). The CAT12‐based image quality indices and Euler numbers were compared between motion‐affected and low‐motion groups using linear models.
MRI scans were segmented and co‐registered using the DARTEL toolbox provided in the SPM12 software package (Ashburner, 2007). A custom template was created from the motion‐free dataset. Scans were segmented using a six‐compartment model, with the first two compartments comprising gray matter (GM) and white matter (WM). The GM and WM segments were coregistered to MNI space via nonrigid coregistration to the custom template. GM segments were smoothed using an 8 mm Gaussian smoothing filter. Regional GM volumes were estimated by calculating the mean GM value within each region defined in the AAL atlas (Tzourio‐Mazoyer et al., 2002). We excluded cerebellar brain regions from our analyses, thereby yielding GM volume estimates in 90 brain regions. Covariance matrices were estimated from regional GM values across subjects by measuring the Pearson correlation (r) between brain regions. Matrices were thresholded and binarized to construct undirected adjacency matrices. Undirected adjacency matrices were thresholded by calculating the Pearson r value threshold that corresponded to a fixed target edge density; this is a standard approach used in a number of previous studies (Alexander‐Bloch et al., 2010; Alexander‐Bloch, Raznahan, et al., 2013; Bethlehem et al., 2017; He et al., 2008; Romero‐Garcia et al., 2018). Subject groups were formed by systematically increasing the number of motion‐affected scans in each group, ranging from no motion‐affected scans to all motion‐affected scans.
Prior to our primary analysis of the effect of in‐scanner motion on structural covariance networks, we investigated the test–retest reliability of structural covariance networks constructed using the VBM approach described above as well as cortical thickness and regional volume estimates derived from Freesurfer. These analyses were carried out to determine whether morphometric estimates derived from our sample were suitable for our goal of investigating the effect of head motion on structural covariance networks. Recent prior research suggested that our overall sample size of N = 29 subjects is close to the lower limit for reliable structural covariance network estimation, and that covariance networks estimated using regional cortical thickness estimates have lower reliability than those constructed from volume estimates when the same sample size is used (Carmon et al., 2020).
Our test–retest analyses used the N = 23 subset of our study population who had four MRI scans acquired per imaging session, comprising 2 × motion‐affected scans and 2 × low‐motion scans. MRI scans were processed using the longitudinal processing stream of Freesurfer v6.0 (Reuter et al., 2012) with default settings. Regional cortical thickness and volume estimates were obtained using the Desikan–Killiany atlas (Desikan et al., 2006), yielding 68 regional estimates per MRI scan. Covariance matrices were constructed by measuring the Pearson correlation between brain regions as per the previously described VBM approach. Test–retest reliability was assessed by comparing region‐wise r values in the repeated low‐motion datasets using the intraclass correlation coefficient (ICC). For our analyses, we used the single score intraclass correlation method implemented in the “irr” R software toolbox (Gamer et al., 2019). Morphometric estimates were deemed appropriate for subsequent analysis if the lower bound for the 95% ICC confidence interval was above 0.9.
We investigated how in‐scanner head motion‐affected structural covariance network construction by measuring the following as the number of motion‐affected scans included in each dataset increased: (i) the variability in volume estimates, assessed by measuring the standard deviation in each brain region across subjects; (ii) Pearson correlation coefficients (r) between volumes of brain regions; and (iii) the Pearson r thresholds required to obtain fixed edge densities = 0.1, 0.15, and 0.2. We also investigated how commonly used graph theoretic network metrics, consisting of (i) global clustering coefficient (transitivity), (ii) modularity, (iii) global efficiency, and (iv) small world index varied as a function of the number of motion‐affected scans in each group. These analyses are described in more detail below. Analyses were carried out using the R software package with the iGraph, brainGraph, and qgraph libraries (Csardi & Nepusz, 2006; Epskamp et al., 2012; Team, R.C., 2020; Watson, 2020).
The global clustering coefficient or transitivity is the ratio of the number of closed triplets (triangles) to the total number of triplets in the network. We calculated this property using the iGraph toolbox (Csardi & Nepusz, 2006). Modularity summarizes how a network is subdivided into communities; networks with high modularity contain subgraphs (communities) that are highly connected with each other but sparsely connected to other subgraphs. For our analyses, communities were detected using the fast greedy modularity algorithm implemented in the iGraph toolbox (Clauset et al., 2004; Csardi & Nepusz, 2006). Global efficiency is related to how network structure influences how information can be transmitted across a network and was calculated using the brainGraph toolbox following the formulation presented by Latora and Marchiori (Latora & Marchiori, 2001; Watson, 2020). Small world index was estimated using the qgraph toolbox following the methods described byWatts and Strogatz (Epskamp et al., 2012; Watts & Strogatz, 1998).
A bootstrapping approach was used to estimate how GM estimates derived from motion‐affected scans affected (i) the across‐subject standard deviation in each brain region and (ii) the Pearson correlation r between pairs of brain regions. The number of motion‐affected scans included was systematically increased from zero (no motion‐affected scans) to 29 (all motion‐affected scans). For each iteration, N = 5000 samples were drawn with replacement and (i) the across‐subject standard deviation in each brain region and (ii) pairwise correlations in mean GM values between brain regions were calculated (Figure 1). The relationship between average standard deviation across brain regions and the percentage of motion‐affected scans was tested using a linear model. In order to assess the spatial distribution of this relationship we also carried out this inference on a per‐node basis, and mapped the correlation between the percentage of motion‐affected scans included and (i) regional average GM and (ii) regional standard deviation to color scales to generate maps showing the regional distribution of these changes. The relationship between average pairwise correlation across all nodes and the percentage of motion‐affected scans was also tested using a linear model.
FIGURE 1.
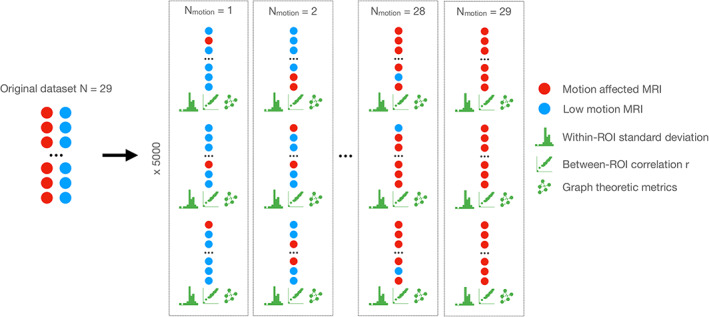
A schematic diagram of our bootstrapping approach to estimating how the inclusion of motion‐affected scans affects structural covariance networks. The original sample of 29 participants with motion‐affected (red circles) and low motion (blue circles) was resampled with systematically increasing numbers of motion‐affected scans. For each sample, the following parameters were estimated: (i) within‐region of interest (ROI) standard deviation across all regions; (ii) between‐ROI correlation (r) across all pairs of ROIs; (iii) graph theoretic metrics derived from structural covariance networks constructed from each sample. Five thousand resamples were taken for each setting of the number of motion‐affected scans to be included in the analyses.
We investigated how the inclusion of motion‐affected scans affected the threshold r value required to obtain undirected adjacency matrices with a prespecified fixed edge density. Target edge densities of 0.1, 0.15, and 0.2 were used. As in previous analyses, a bootstrapping approach was used to estimate the average r value required to obtain the target densities as the number of motion‐affected scans increased. The 5000 samples were drawn with replacement for each iteration as the number of motion‐affected scans in the dataset was increased. The relationship between threshold r value and percentage of motion‐affected scans was tested using a linear model.
We also investigated how in‐scanner head motion affects graph theoretic network measures that are commonly used in structural covariance studies to assess differences between subject groups. Specific metrics included measures of network segregation, consisting of transitivity (also known as clustering coefficient) and modularity, measures of network integration including global efficiency and small world index. For these analyses, the graph theoretic estimates were obtained from graphs constructed from adjacency matrices that were thresholded to obtain target edge densities = 0.1, 0.15, and 0.2. As in the previous analyses, 5000 samples were drawn with replacement as the number of motion‐affected scans increased, with the four graph theoretic metrics calculated for each sample.
Given that structural covariance assesses relationships between brain regions, we investigated how the correlation and subsequent inferred connections between nodes varies as a function of internode distance in the presence of head motion. We measured the average Euclidean distance between connected nodes from structural covariance networks while systematically increasing the number of motion‐affected scans as per the previous analyses. If proximal connections were preserved or removed as the number of motion‐affected scans increased, we should observe systematic changes in the average spatial distance between connected nodes. If the average spatial distance increased, it meant that distal connections were preserved (or conversely proximal connections were removed); likewise, if the average distance decreased it would suggest that distal connections were removed.
We investigated how varying the parcellation scheme affects the relationship between structural covariance networks and head motion. The same custom template used for the prior analyses was parcellated using the following approach. A binary GM segment was derived from the probabilistic custom template using a threshold = 0.01. The number of nodes for each parcellation nSeed was set to 200, 250, 300, 350, and 400. For each value of nSeed, the GM segment was unwrapped from 3D into a 1D vector and seeded nSeed times evenly spaced over the 1D vector. The 1D vector was then re‐mapped back into 3D space and the seed labels were expanded using the “expand_label” function provided as part of the scikit‐image python image‐processing module (van der Walt et al., 2014). This approach yielded custom parcellations with systematically reduced size of individual regions of interest as the number of nodes increased (Figure 2).
FIGURE 2.

Custom parcellations used to investigate how parcellation schemes influence structural covariance networks in the presence of motion‐affected scans. The images show parcellations with number of nodes (from left to right) = 200, 250, 300, 350, and 400.
Regional GM volumes and structural covariance networks were estimated by calculating (i) the mean GM values within each region and (ii) the Pearson correlation between regions for each custom parcellation, following the previously described analyses that used the AAL atlas. We investigated how the use of different parcellations modified the standard deviation of regional GM values in the presence of motion‐affected scans; how the between‐node Pearson correlation varied when using different parcellations; and how the previously described graph theoretic metrics varied when different parcellations were used. For the latter analyses, a fixed edge density = 0.1 was used to construct the networks.
For our proposed weighted correlation method for correcting for in‐scanner head motion, interregional correlations were estimated while systematically increasing the number of motion‐affected scans included in each dataset. The AAL atlas was used to define regional GM volumetric estimates for these analyses. The previously described resampling approach was used to obtain robust estimates. Weighted correlations were estimated using the “weights” R package (Pasek, 2021). We used both the CAT12 weighted image quality index and average Euler number as image quality metrics. Both IQMs were inverted so that higher quality less motion‐affected scans had a higher score and were therefore more heavily weighted. The following interregional correlation matrices were estimated: (i) ground truth estimates derived from low‐motion scans, (ii) unweighted correlations derived from datasets containing motion‐affected scans, (iii) correlations weighted using inverted CAT12 IQMs, and (iv) correlations weighted using inverted Euler number IQMs. The region‐wise difference and mean absolute error (MAE) between ground truth low‐motion correlations and weighted/unweighted motion‐affected correlations was calculated. If the proposed weighted correlation approach is effective for correcting for the effects of in‐scanner motion, we would expect the MAE associated with weighted correlations derived from motion‐affected datasets to be lower than the MAE for the equivalent unweighted correlations.
3. RESULTS
Quantitative assessment of image quality in the motion‐affected and low‐motion scan groups indicated substantially reduced image quality in the motion‐affected scans when using the weighted image quality metric from the CAT12 SPM toolbox and the Euler number derived from Freesurfer‐based cortical surface reconstructions (Figure 3). The test–retest reliability of structural covariance networks constructed from repeat low‐motion scans was high for both the VBM‐based AAL atlas approach and regional volume estimates obtained using Freesurfer, with an average ICC of 0.95 and 0.97, respectively. The ICC of regional cortical thickness estimates was significantly lower, with a mean ICC = 0.79. The mean ICC values and 95% confidence intervals for these estimates are shown in Figure 4. Given the lower test–retest reliability of between‐region correlations estimated using cortical thickness estimates, all subsequent analyses on the effects of head motion used structural covariance networks derived from volumetric estimates only.
FIGURE 3.
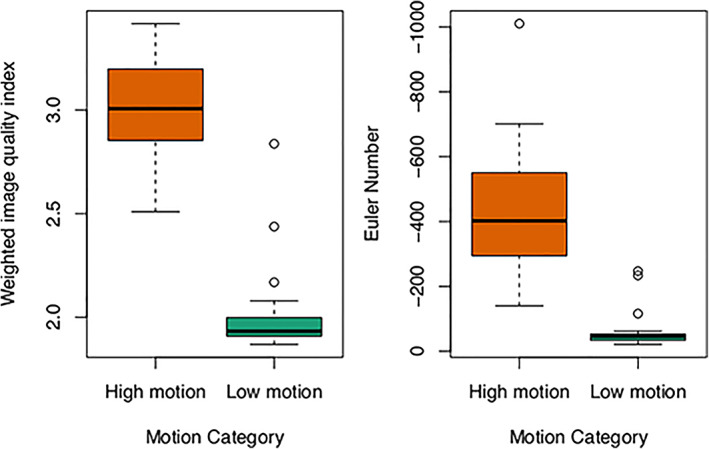
Quantitative image quality indices show that brain MRI quality is reduced (higher weighted image quality index and lower Euler number, p < < .001 for both analyses) in the motion‐affected group. Note that the y‐axis on the Euler number plot is reversed.
FIGURE 4.
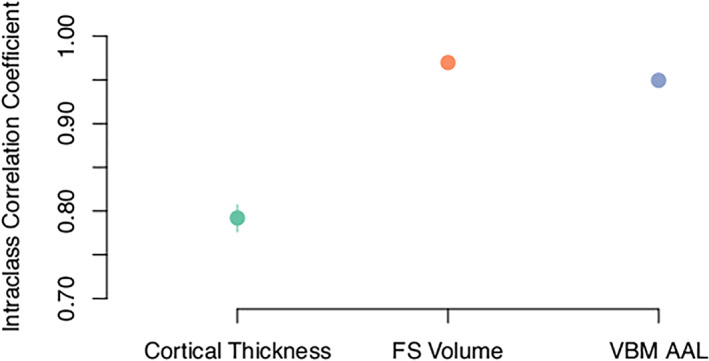
Test–retest variability is higher (lower ICC) when constructing structural covariance networks using cortical thickness estimates compared to volumetric estimates derived from surface‐based (FS volume) and voxel‐based morphometry (VBM AAL) approaches. The 95% confidence intervals for volumetric estimates are smaller than the size of the plot labels.
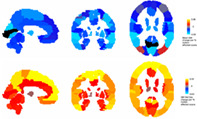
As expected from previous studies the measured GM volumetric estimates generally reduced as the number of motion‐affected scans included in our analyses increased (Figure 5). The average across‐subject standard deviation systematically increased as the number of motion‐affected scans included in an analysis increased, with an increase of 1.9 × 10⁻⁴ SD per percent change in the number of motion‐affected scans (Figure 5; p < < .001). The change in standard deviation as a function of the number of motion‐affected scans, both per‐region and averaged across all brain regions, is shown in Figure 6. For example, if 20% of the scans in a dataset were motion affected, the standard deviation increased on average by 23%. The average correlation between GM regions also systematically increased as the number of motion‐affected scans included increased, with an increase of 5.1 × 10⁻⁴ in r per percent change in the number of motion‐affected scans (p < < .001; Figure 7). As an example, we have provided scatterplots showing the change in the correlation between the left pallidum and left inferior temporal gyrus as the number of motion‐affected scans increased (Figure 8). The figure shows that the Pearson correlation increased from r = .57 if no motion‐affected scans are included to r = .71 if six subjects (20% of the sample) are motion affected. The average threshold r value required to obtain adjacency matrices with the prespecified edge densities systematically increased as the number of motion‐affected scans included in the analyses increased; this was observed across the three target densities investigated in our study (Figure 9).
FIGURE 5.
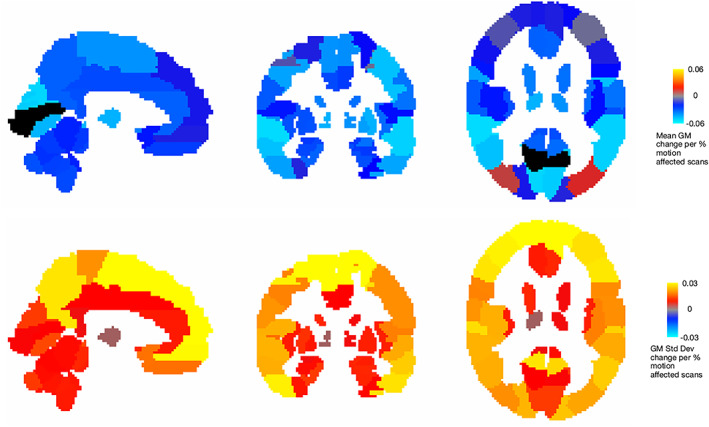
The spatial distribution of changes in measured node‐wise average GM volume (top row) and node‐wise standard deviation (bottom row) as the number of motion‐affected scans increases. The measured GM volume generally decreases as the number of motion‐affected scans increases; the standard deviation in all regions increases as the number of included motion‐affected scans increases.
FIGURE 6.
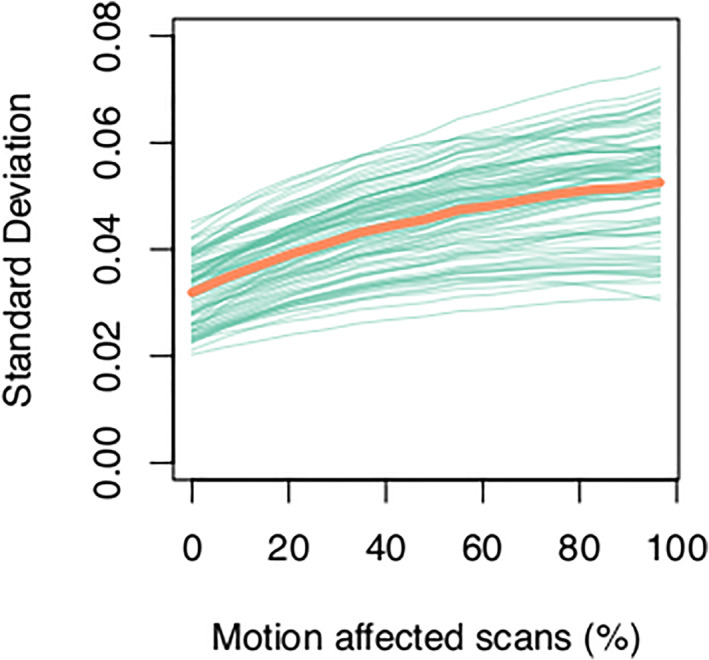
Variability in regional gray matter volume estimates across subjects increases with the number of motion‐affected scans included in a dataset. The standard deviation averaged across all brain regions is shown in orange, with standard deviation in individual brain regions is shown in green.
FIGURE 7.
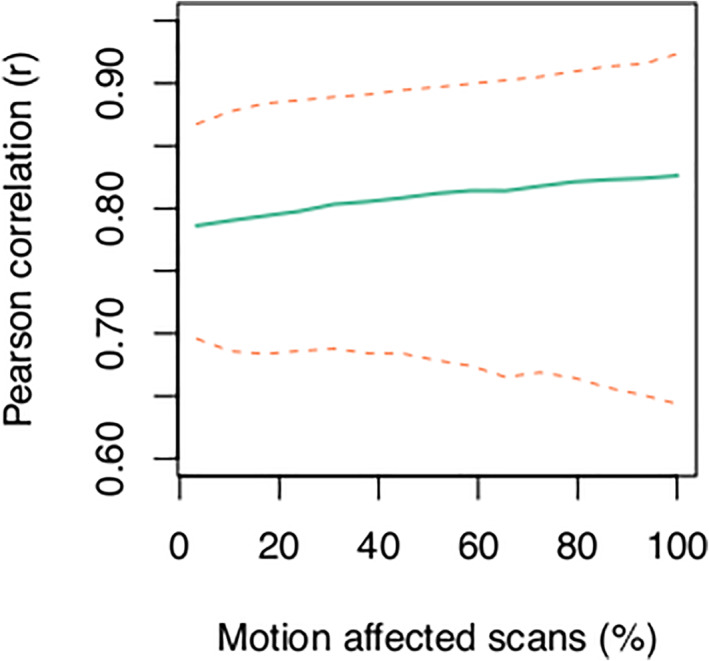
The correlation between gray matter volume estimates increases as the number of motion‐affected scans included in a dataset increases. The green line shows the average Pearson r across all brain regions and the dashed lines indicate the 2.5th (lower line) and 97.5th (upper line) percentiles for N = 5000 iterations for each setting of the number of motion‐affected scans
FIGURE 8.
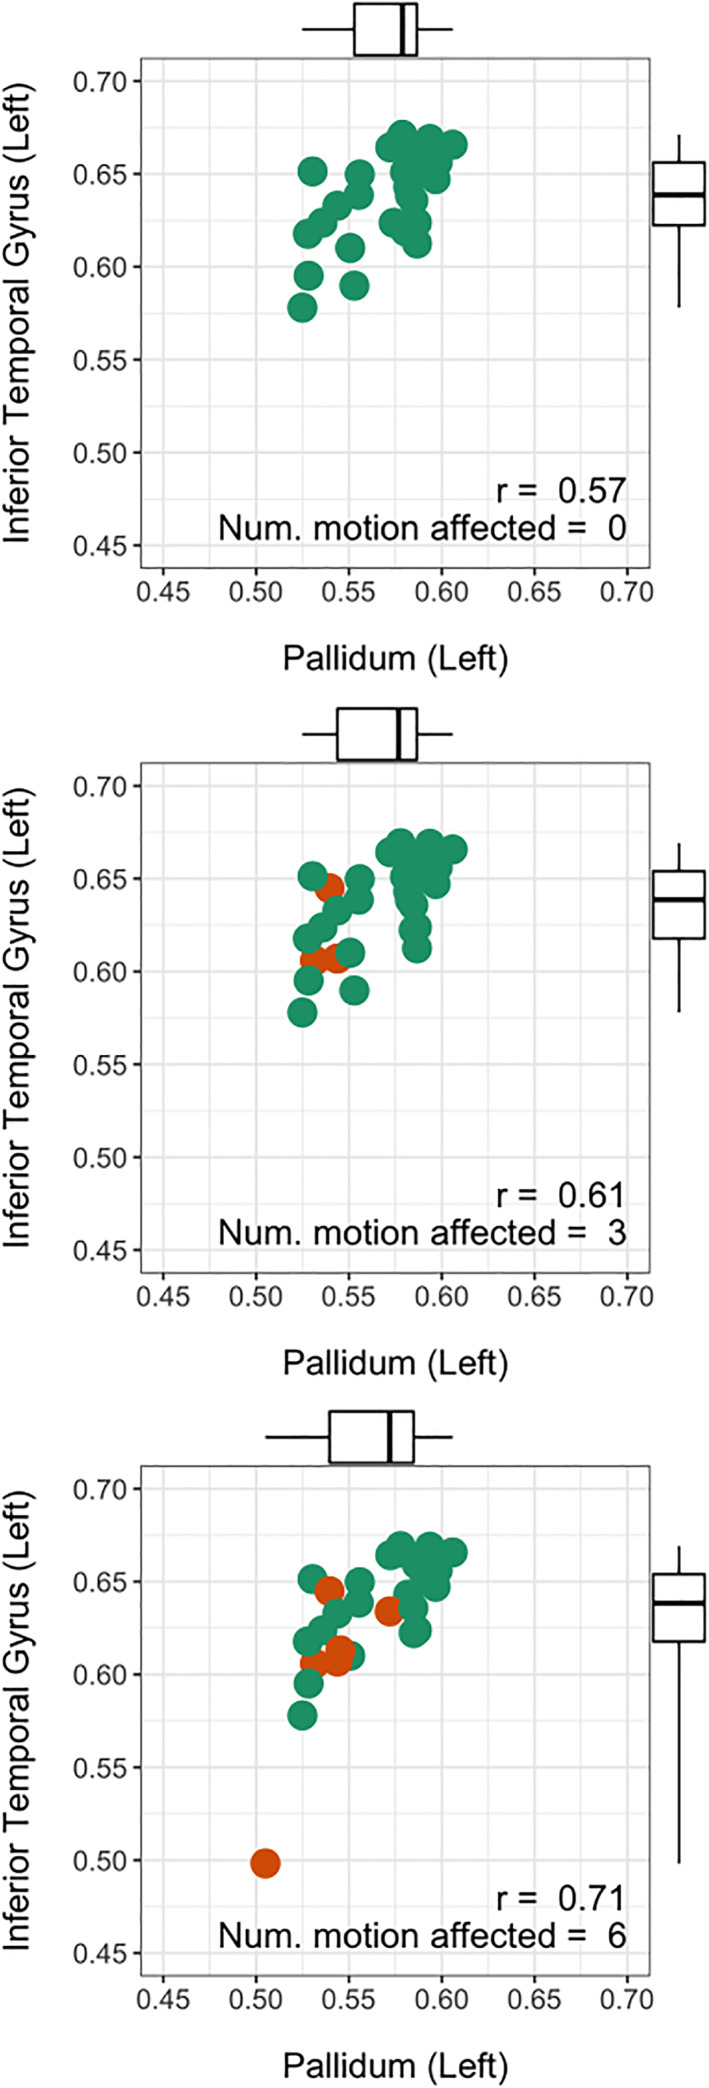
The effect of in‐scanner head motion on the measured correlation in gray matter volume between the pallidum and the inferior temporal gyrus. As more motion‐affected scans are included in the sample, the correlation between these brain regions increases from 0.57 to 0.71.
FIGURE 9.
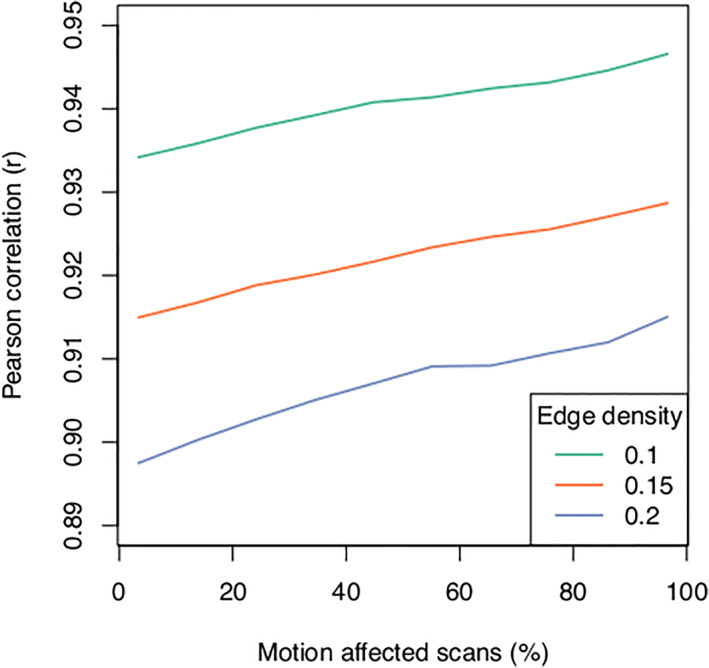
The threshold Pearson correlation required to obtain a predefined network edge density is dependent on the number of motion‐affected scans included in an analysis.
Both modularity and efficiency systematically increased as the number of motion‐affected scans increased. These changes were consistent across the range of edge densities used in our analyses (Figure 10). Small world index generally decreased as the number of motion‐affected scans increased, although the higher edge densities = 0.15, 0.2 showed a small peak in small world index when a low number of motion‐affected scans was increased. The relationship between transitivity and number of motion‐affected scans depended on edge density, with the shape of the density = 0.1 curve markedly different to curves for edge densities = 0.15 and 0.2. For the higher edge density values, the transitivity decreased as the number of motion‐affected scans increased. When examining changes in graph theoretic metrics for a single edge density = 0.15, it can be seen that the most substantial changes in transitivity, modularity, and efficiency occur when a small number of motion‐affected scans are included in the analysis (Figure 11).
FIGURE 10.
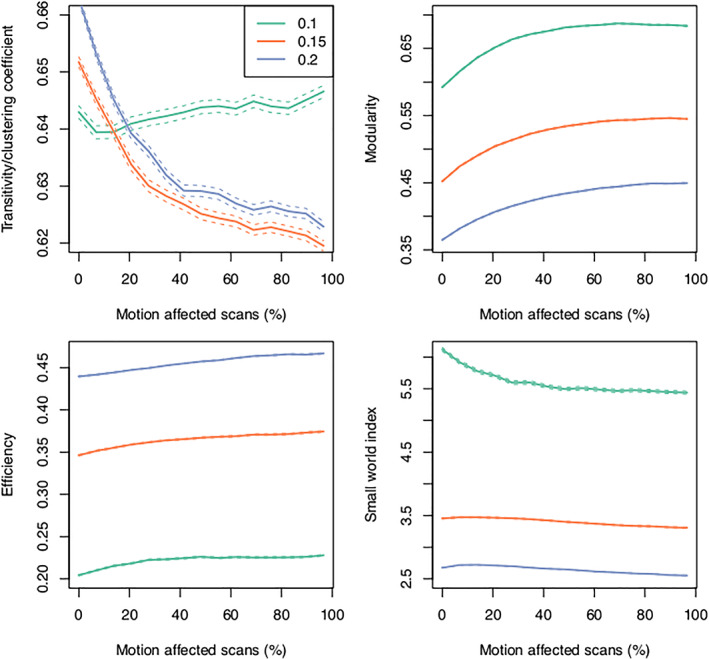
Change in graph theoretic metrics across edge density = 0.1, 0.15, 0.2. The relationship between motion and transitivity (clustering coefficient) is variable depending on the edge density used. Modularity and efficiency increase as the number of motion‐affected scans increases. Small world index generally decreases as the number of motion‐affected scans increases. The dashed lines indicate the 95% confidence interval.
FIGURE 11.
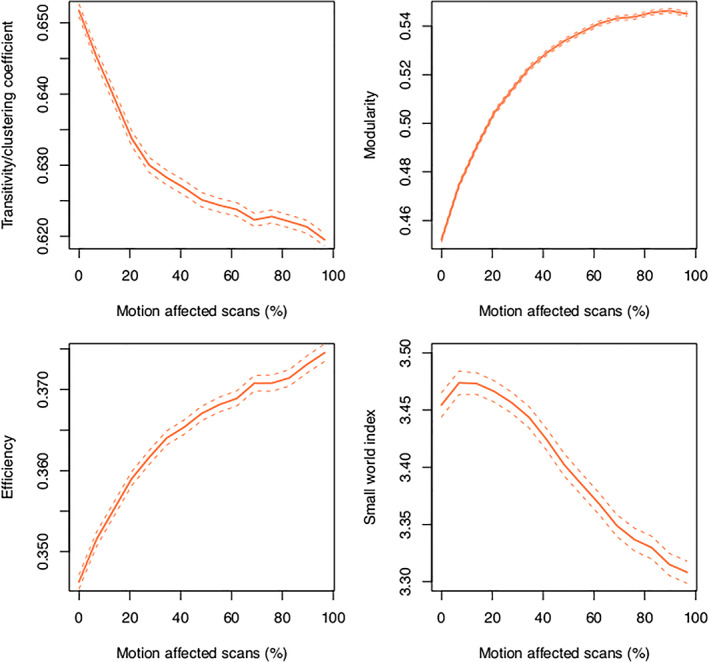
Change in graph theoretic metrics as a function of in‐scanner motion for edge density = 0.15. For transitivity, modularity, and efficiency, the largest changes occurred when a small number of motion‐affected scans were included (<20%). The dashed lines indicate the 95% confidence interval
For our analyses of the effect of internode distance on networks constructed in the presence of increasing head motion, we found that there appears to be preservation of distal connections as the number of motion‐affected scans increase until they comprise half of the sample, with removal of distal connections as the number of motion‐affected scans exceeds the number of low‐motion scans. This effect is subtle, however, with a maximal average shift of only ~0.5 mm (see Supplementary Material).
When the number of nodes and associated node size was varied via the use of our custom parcellation scheme, the change in average within‐node standard deviation of GM values followed a qualitatively similar monotonic increase as the number of motion‐affected scans increased, independent of the number of nodes (Figure 12). The average within‐node standard deviation systematically increased as the number of nodes increased. For between‐region correlations, the relationship between r and the number of motion‐affected scans was consistent across the different parcellations. As the number of nodes used for the parcellation scheme increased the between‐node correlations systematically decreased; this systematic change appears particularly large for the lower number of nodes (n = 200–250), but the difference was reduced when parcellations with a larger number of nodes were used; for example, there was no apparent difference in average Pearson correlation when comparing n = 350 and n = 400 parcellation schemes.
FIGURE 12.
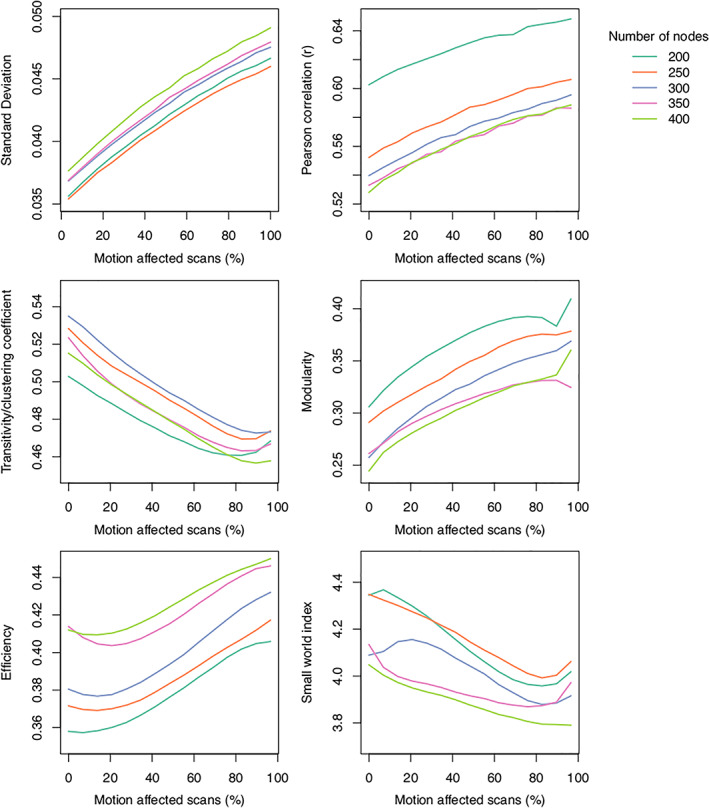
The influence of different parcellation schemes on structural covariance network metrics affected by in‐scanner head motion. The plots show that varying the number of nodes, and associated node size, generally results in upward or downward shifts in network properties; however, the change in these properties as the number of motion‐affected scans increases is consistent across parcellations.
For the graph theoretic metrics, the relationships between each metric and the number of motion‐affected scans were similar regardless of the parcellation scheme used. For the transitivity metrics, there was no discernable systematic relationship between the number of nodes in the parcellation and the estimated transitivity values. Modularity estimates systematically decreased as the number of nodes in the parcellation scheme increased; efficiency estimates increased as the number of nodes increased; and the small world index values decreased as the number of nodes increased.
Weighting between‐region GM volume correlations using the CAT12 weighted image quality index or average Euler number derived from Freesurfer reduced the mean absolute error relative to unweighted correlations (Figure 13). Although the weighted correlation analyses mitigate the effects of in‐scanner head motion, unsurprisingly the MAE increases for both IQMs as the number of motion‐affected scans included in the analysis increased. Our preliminary analyses suggest that using the average Euler number to weight the correlations has a lower MAE than the CAT12 IQM over most of the range of motion‐affected scans.
FIGURE 13.
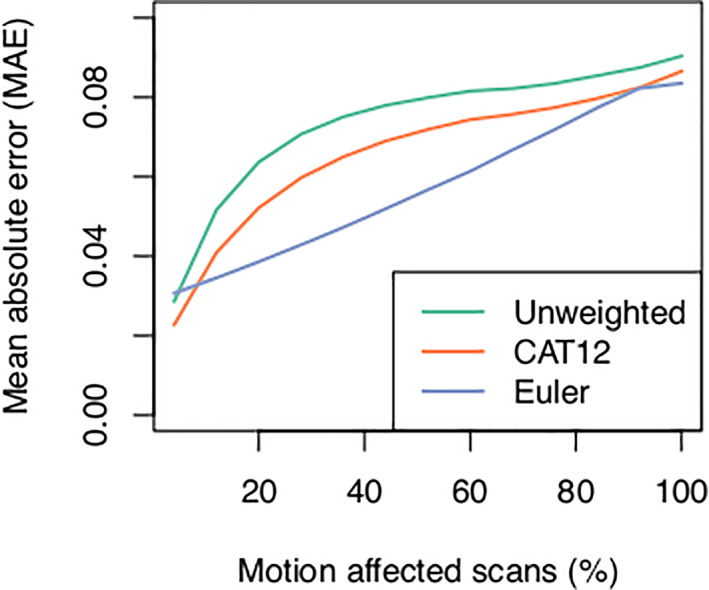
Weighting interregional correlations by image quality metrics derived from the CAT12 toolbox (orange line) and average Euler number derived from Freesurfer (blue line) yields correlations that more closely resemble ground‐truth correlations derived from low‐motion scans compared with unweighted correlations (green line). This suggests that errors in correlation estimates and further downstream metrics introduced by in‐scanner head motion may be mitigated using postprocessing techniques.
4. DISCUSSION
We have demonstrated that the inclusion of motion‐affected scans in a structural covariance analysis framework causes systematic increases in the variability of measured gray matter volumes. The increase in variability subsequently increases the correlation in GM volumes between brain regions. The increases in regional variability and measured correlation between brain regions are observed across the whole brain. These findings suggest that in‐scanner head motion can affect the construction of networks derived from covariance of the volumes of gray matter regions across subjects. We have also shown that graph theoretic metrics derived from graphs constructed based on correlation between brain regions are dependent on the number of motion‐affected scans included in an analysis. Our analyses suggest that in‐scanner head motion is a potential source of error for structural covariance analyses and violates the primary underlying assumption that significant correlations in GM volume estimates between brain regions reflect neuroanatomical connectivity. These findings suggest that caution should be exercised when interpreting the results of structural covariance analyses.
Given that we have demonstrated that structural covariance network properties can be affected by in‐scanner head motion, it naturally follows that there would be interest in the development of methods for mitigating this source of error. We have provided preliminary evidence that weighting correlations using IQMs derived from the CAT12 toolbox or the average Euler number derived from Freesurfer‐based surface analysis yield estimates that are closer to ground‐truth estimates obtained using only low‐motion scans. Our analyses suggest that the use of average Euler number is modestly superior to the CAT12 IQM; however, more research is needed to optimize this candidate approach. Nevertheless, these findings suggest that, despite the fact that in‐scanner head motion systematically affects structural covariance networks, this source of error may be controlled using postprocessing methods. Additional approaches could be investigated; for example, based on the scatterplots shown in Figure 8 the use of outlier detection methods such as Cook's distance or alternatives to Pearson correlation such as Spearman's rank correlation coefficient could be beneficial. As with our weighted correlation approach, these techniques may mitigate the effects of motion but they may not eliminate the effect entirely; for example, although Cook's distance may correctly identify the clear outlier shown in orange in the bottom plot of Figure 8, it may not identify more subtle systematic shifts due to head motion. A similar argument could be applied to rank‐based correlation methods since relative rank changes could still occur due to head motion. One approach we believe may be useful would be to match scans based on the image quality metrics presented in Figure 3; if image quality was similar across subject groups this would suggest that the groups are matched for head motion. The methods described are speculative at this stage and further investigation is warranted. A limitation of our study is that no direct estimates of head motion were included in our analyses, primarily due to the fact that there are few widely available techniques for measuring head motion during structural MRI scans. Future studies incorporating recently proposed direct measures of head motion could be useful for the development of techniques to ameliorate this source of error (Frost et al., 2019; Kober et al., 2011; Maclaren et al., 2012; Pardoe et al., 2021; Tisdall et al., 2016).
Our experimental framework used individuals who deliberately moved their heads in the MRI scanner. The motion‐related artifacts in these scans may be greater than those encountered in a typical clinical imaging study, particularly in studies that have stringent quality control procedures. Although quality control protocols implemented at the clinical imaging site are likely to reduce the magnitude of this source of error, it is unclear whether they would eliminate this effect. Previous studies have demonstrated that in‐scanner head motion in a clinical setting has a significant effect on cortical thickness and regional volume even in scans that have been visually rated as being high quality (Pardoe et al., 2016); this suggests that it is possible that even subtle in‐scanner head motion could have a systematic effect on structural covariance analyses, particularly in large studies. Recently developed motion‐robust acquisitions (Frost et al., 2019; White et al., 2010) are likely to ameliorate the effects of in‐scanner head motion described in this work; however, these should be investigated in future studies.
One interesting finding from our analyses is the interaction between edge density and transitivity/clustering coefficient as the number of motion‐affected scans increases (Figure 10, top left). We suspect that this effect is due to the fact that lower density networks, for example, density = 0.1, are by definition limited to “stronger” node‐node correlations (higher r) than higher density networks. The global clustering coefficient = Number of closed triplets/Number of all triplets ; the plot of clustering coefficient against the number motion‐affected scans therefore implies that the number of closed triplets in low‐density networks is relatively stable as the number of motion‐affected scans increases. For higher density networks, the number of closed triplets decreases substantially as the number of motion‐affected scans increases. This difference may be related to the volume of the individual nodes that comprise each triplet in the network, because the relative change in measured volume of large nodes as motion increases will be smaller than the change in volume of smaller nodes. We investigated this post hoc hypothesis by measuring the average volume of “robust” closed triplets, that is, those present in high motion low‐density networks (N robust triplets = 610), versus the average volume of “weak” closed triplets, that is, those triplets that are present in low‐motion high‐density networks but fall out of the network as the number of motion‐affected scans increases (N weak triplets = 2899). We found that the average volume of robust closed triplets was significantly higher than weak closed triplets (Volrobust = 1690, Volweak = 1320, p < < .001), which supports our hypothesis.
For our study, we limited our analysis of graph theoretic metrics to the most widely used in the literature. There are a number of additional measures and variants of existing measures that may be derived from structural covariance networks, including measures of local efficiency, path length, betweenness, closeness, and centrality. Given that all graph theoretic estimates that we investigated in our study were to some extent dependent on in‐scanner head motion, it is highly likely that these additional measures will also be affected.
In summary, we have demonstrated that in‐scanner head motion systematically increases the correlation in estimates of regional gray matter volume as a consequence of increased variability in these estimates. These changes affect graph theory‐based metrics typically used to infer differences in neuroanatomical connectivity between subject groups. As with mass‐univariate analyses of regional brain volume differences between subject groups, the results of structural covariance analyses should be interpreted with the knowledge that head motion is a potential source of error.
CONFLICT OF INTEREST
The authors have no conflicts of interest to disclose.
Supporting information
Figure S1 The average inter‐node distance between connected nodes as the number of motion‐affected scans included in an analysis increases. The two plots show the same data displayed with different scaling on the y‐axis. The plots show that as the number of motion‐affected scans increases there is a subtle increase in the number of distal connections relative to the number of proximal connections when motion‐affected scans comprise less than 50% of the sample.
ACKNOWLEDGMENTS
The authors wish to thank a reviewer for their helpful suggestion of the use of weighted correlations to control for the effects of in‐scanner head motion on structural covariance networks.
Pardoe, H. R. , & Martin, S. P. (2022). In‐scanner head motion and structural covariance networks. Human Brain Mapping, 43(14), 4335–4346. 10.1002/hbm.25957
Funding information Finding A Cure for Epilepsy and Seizures; National Institutes of Health, Grant/Award Number: NS117990
DATA AVAILABILITY STATEMENT
The data that support the findings of this study are openly available at https://openneuro.org/datasets/ds003639.
REFERENCES
- Alexander‐Bloch, A. , Clasen, L. , Stockman, M. , Ronan, L. , Lalonde, F. , Giedd, J. , & Raznahan, A. (2016). Subtle in‐scanner motion biases automated measurement of brain anatomy from in vivo MRI. Human Brain Mapping, 37(7), 2385–2397. [DOI] [PMC free article] [PubMed] [Google Scholar]
- Alexander‐Bloch, A. , Giedd, J. N. , & Bullmore, E. (2013). Imaging structural co‐variance between human brain regions. Nature Reviews. Neuroscience, 14(5), 322–336. [DOI] [PMC free article] [PubMed] [Google Scholar]
- Alexander‐Bloch, A. , Raznahan, A. , Bullmore, E. , & Giedd, J. (2013). The convergence of maturational change and structural covariance in human cortical networks. The Journal of Neuroscience, 33(7), 2889–2899. [DOI] [PMC free article] [PubMed] [Google Scholar]
- Alexander‐Bloch, A. F. , Gogtay, N. , Meunier, D. , Birn, R. , Clasen, L. , Lalonde, F. , Lenroot, R. , Giedd, J. , & Bullmore, E. T. (2010). Disrupted modularity and local connectivity of brain functional networks in childhood‐onset schizophrenia. Frontiers in Systems Neuroscience, 4, 147. [DOI] [PMC free article] [PubMed] [Google Scholar]
- Ashburner, J. (2007). A fast diffeomorphic image registration algorithm. NeuroImage, 38(1), 95–113. [DOI] [PubMed] [Google Scholar]
- Bassett, D. S. , Bullmore, E. , Verchinski, B. A. , Mattay, V. S. , Weinberger, D. R. , & Meyer‐Lindenberg, A. (2008). Hierarchical organization of human cortical networks in health and schizophrenia. The Journal of Neuroscience, 28(37), 9239–9248. [DOI] [PMC free article] [PubMed] [Google Scholar]
- Bernhardt, B. C. , Rozen, D. A. , Worsley, K. J. , Evans, A. C. , Bernasconi, N. , & Bernasconi, A. (2009). Thalamo‐cortical network pathology in idiopathic generalized epilepsy: Insights from MRI‐based morphometric correlation analysis. NeuroImage, 46(2), 373–381. [DOI] [PubMed] [Google Scholar]
- Bethlehem, R. A. I. , Romero‐Garcia, R. , Mak, E. , Bullmore, E. T. , & Baron‐Cohen, S. (2017). Structural covariance networks in children with autism or ADHD. Cerebral Cortex, 27(8), 4267–4276. [DOI] [PMC free article] [PubMed] [Google Scholar]
- Carmon, J. , Heege, J. , Necus, J. H. , Owen, T. W. , Pipa, G. , Kaiser, M. , Taylor, P. N. , & Wang, Y. (2020). Reliability and comparability of human brain structural covariance networks. NeuroImage, 220, 117104. [DOI] [PubMed] [Google Scholar]
- Clauset, A. , Newman, M. E. J. , & Moore, C. (2004). Finding community structure in very large networks. Phys. Rev. E, 70(6), 066111. https://link.aps.org/doi/10.1103/PhysRevE.70.066111 [DOI] [PubMed] [Google Scholar]
- Coppen, E. M. , van der Grond, J. , Hafkemeijer, A. , Rombouts, S. A. R. B. , & Roos, R. A. C. (2016). Early grey matter changes in structural covariance networks in Huntington's disease. NeuroImage: Clinical, 12, 806–814. [DOI] [PMC free article] [PubMed] [Google Scholar]
- Csardi, G. , & Nepusz, T. (2006). The igraph software package for complex network research. InterJournal, Complex Systems, 1695. [Google Scholar]
- Dale, A. M. , Fischl, B. , & Sereno, M. I. (1999). Cortical surface‐based analysis I. Segmentation and surface reconstruction. Neuroimage, 9(2), 179–194. [DOI] [PubMed] [Google Scholar]
- Desikan, R. S. , Ségonne, F. , Fischl, B. , Quinn, B. T. , Dickerson, B. C. , Blacker, D. , Buckner, R. L. , Dale, A. M. , Maguire, R. P. , Hyman, B. T. , Albert, M. S. , & Killiany, R. J. (2006). An automated labeling system for subdividing the human cerebral cortex on MRI scans into gyral based regions of interest. NeuroImage, 31(3), 968–980. [DOI] [PubMed] [Google Scholar]
- DuPre, E. , & Spreng, R. N. (2017). Structural covariance networks across the life span, from 6 to 94 years of age. Network Neuroscience, 1(3), 302–323. [DOI] [PMC free article] [PubMed] [Google Scholar]
- Epskamp, S. , Cramer, A. O. J. , Waldorp, L. J. , Schmittmann, V. D. , & Borsboom, D. (2012). qgraph: Network visualizations of relationships in psychometric data. Journal of Statistical Software, 48(4), 1–18. [Google Scholar]
- Frost, R. , Wighton, P. , Karahanoğlu, F. I. , Robertson, R. L. , Grant, P. E. , Fischl, B. , Tisdall, M. D. , & van der Kouwe, A. (2019). Markerless high‐frequency prospective motion correction for neuroanatomical MRI. Magnetic Resonance in Medicine, 82(1), 126–144. [DOI] [PMC free article] [PubMed] [Google Scholar]
- Gamer, M. , Jim, L. , & Ian Fellows Puspendra Singh . (2019). irr: Various coefficients of interrater reliability and agreement. https://CRAN.R-project.org/package=irr [Google Scholar]
- Goodwin, L. D. , & Leech, N. L. (2006). Understanding correlation: Factors that affect the size of r. Journal of Experimental Education, 74(3), 251–266. [Google Scholar]
- He, Y. , Chen, Z. , & Evans, A. (2008). Structural insights into aberrant topological patterns of large‐scale cortical networks in Alzheimer's disease. The Journal of Neuroscience, 28(18), 4756–4766. [DOI] [PMC free article] [PubMed] [Google Scholar]
- Irimia, A. , & Van Horn, J. D. (2013). The structural, connectomic and network covariance of the human brain. NeuroImage, 66, 489–499. [DOI] [PMC free article] [PubMed] [Google Scholar]
- Kober, T. , Marques, J. P. , Gruetter, R. , & Krueger, G. (2011). Head motion detection using FID navigators. Magnetic Resonance in Medicine, 66(1), 135–143. [DOI] [PubMed] [Google Scholar]
- Latora, V. , & Marchiori, M. (2001). Efficient behavior of small‐world networks. Physical Review Letters, 87(19), 198701. [DOI] [PubMed] [Google Scholar]
- Maclaren, J. , Armstrong, B. S. R. , Barrows, R. T. , Danishad, K. A. , Ernst, T. , Foster, C. L. , Gumus, K. , Herbst, M. , Kadashevich, I. Y. , Kusik, T. P. , Li, Q. , Lovell‐Smith, C. , Prieto, T. , Schulze, P. , Speck, O. , Stucht, D. , & Zaitsev, M. (2012). Measurement and correction of microscopic head motion during magnetic resonance imaging of the brain. PLoS One, 7(11), e48088. [DOI] [PMC free article] [PubMed] [Google Scholar]
- Montembeault, M. , Joubert, S. , Doyon, J. , Carrier, J. , Gagnon, J. F. , Monchi, O. , Lungu, O. , Belleville, S. , & Brambati, S. M. (2012). The impact of aging on gray matter structural covariance networks. NeuroImage, 63(2), 754–759. [DOI] [PubMed] [Google Scholar]
- Montembeault, M. , Rouleau, I. , Provost, J. S. , Brambati, S. M. , & Alzheimer's Disease Neuroimaging Initiative . (2016). Altered gray matter structural covariance networks in early stages of Alzheimer's disease. Cerebral Cortex, 26(6), 2650–2662. [DOI] [PMC free article] [PubMed] [Google Scholar]
- Pardoe, H. R. , Kucharsky Hiess, R. , & Kuzniecky, R. (2016). Motion and morphometry in clinical and nonclinical populations. NeuroImage, 135, 177–185. [DOI] [PubMed] [Google Scholar]
- Pardoe, H. R. , & Martin, S. P. (2021). In‐scanner head motion and structural covariance networks. OpenNeuro. 10.18112/openneuro.ds003639.v1.0.0 [DOI] [PMC free article] [PubMed] [Google Scholar]
- Pardoe, H. R. , Martin, S. P. , Zhao, Y. , George, A. , Yuan, H. , Zhou, J. , Liu, W. , & Devinsky, O. (2021). Estimation of in‐scanner head pose changes during structural MRI using a convolutional neural network trained on eye tracker video. Magnetic Resonance Imaging, 81, 101–108. [DOI] [PubMed] [Google Scholar]
- Pasek, J. (2021). Weights: Weighting and weighted statistics. https://CRAN.R-project.org/package=weights [Google Scholar]
- Reuter, M. , Schmansky, N. J. , Rosas, H. D. , & Fischl, B. (2012). Within‐subject template estimation for unbiased longitudinal image analysis. NeuroImage, 61(4), 1402–1418. [DOI] [PMC free article] [PubMed] [Google Scholar]
- Reuter, M. , Tisdall, M. D. , Qureshi, A. , Buckner, R. L. , van der Kouwe, A. J. W. , & Fischl, B. (2015). Head motion during MRI acquisition reduces gray matter volume and thickness estimates. NeuroImage, 107, 107–115. [DOI] [PMC free article] [PubMed] [Google Scholar]
- Romero‐Garcia, R. , Whitaker, K. J. , Váša, F. , Seidlitz, J. , Shinn, M. , Fonagy, P. , Dolan, R. J. , Jones, P. B. , Goodyer, I. M. , NSPN Consortium , Bullmore, E. T. , & Vértes, P. E. (2018). Structural covariance networks are coupled to expression of genes enriched in supragranular layers of the human cortex. NeuroImage, 171, 256–267. [DOI] [PMC free article] [PubMed] [Google Scholar]
- Rosen, A. F. G. , Roalf, D. R. , Ruparel, K. , Blake, J. , Seelaus, K. , Villa, L. P. , Ciric, R. , Cook, P. A. , Davatzikos, C. , Elliott, M. A. , Garcia de la Garza, A. , Gennatas, E. D. , Quarmley, M. , Schmitt, J. E. , Shinohara, R. T. , Tisdall, M. D. , Craddock, R. C. , Gur, R. E. , Gur, R. C. , & Satterthwaite, T. D. (2018). Quantitative assessment of structural image quality. NeuroImage, 169, 407–418. [DOI] [PMC free article] [PubMed] [Google Scholar]
- Savalia, N. K. , Agres, P. F. , Chan, M. Y. , Feczko, E. J. , Kennedy, K. M. , & Wig, G. S. (2017). Motion‐related artifacts in structural brain images revealed with independent estimates of in‐scanner head motion. Human Brain Mapping, 38(1), 472–492. [DOI] [PMC free article] [PubMed] [Google Scholar]
- Team, R.C . (2020). R: A language and environment for statistical computing. Vienna, Austria.
- Tisdall, M. D. , Reuter, M. , Qureshi, A. , Buckner, R. L. , Fischl, B. , & van der Kouwe, A. J. W. (2016). Prospective motion correction with volumetric navigators (vNavs) reduces the bias and variance in brain morphometry induced by subject motion. NeuroImage, 127, 11–22. [DOI] [PMC free article] [PubMed] [Google Scholar]
- Tzourio‐Mazoyer, N. , Landeau, B. , Papathanassiou, D. , Crivello, F. , Etard, O. , Delcroix, N. , Mazoyer, B. , & Joliot, M. (2002). Automated anatomical labeling of activations in SPM using a macroscopic anatomical parcellation of the MNI MRI single‐subject brain. NeuroImage, 15(1), 273–289. [DOI] [PubMed] [Google Scholar]
- Valk, S. L. , di Martino, A. , Milham, M. P. , & Bernhardt, B. C. (2015). Multicenter mapping of structural network alterations in autism. Human Brain Mapping, 36(6), 2364–2373. [DOI] [PMC free article] [PubMed] [Google Scholar]
- van der Walt, S. , Schönberger, J. L. , Nunez‐Iglesias, J. , Boulogne, F. , Warner, J. D. , Yager, N. , Gouillart, E. , & Yu, T. (2014). Scikit‐image: Image processing in python. PeerJ, 2, e453. [DOI] [PMC free article] [PubMed] [Google Scholar]
- Watson, C.G. (2020). brainGraph: Graph theory analysis of brain MRI data. https://CRAN.R-project.org/package=brainGraph [Google Scholar]
- Watts, D. J. , & Strogatz, S. H. (1998). Collective dynamics of 'small‐world' networks. Nature, 393(6684), 440–442. [DOI] [PubMed] [Google Scholar]
- White, N. , Roddey, C. , Shankaranarayanan, A. , Han, E. , Rettmann, D. , Santos, J. , Kuperman, J. , & Dale, A. (2010). PROMO: Real‐time prospective motion correction in MRI using image‐based tracking. Magnetic Resonance in Medicine, 63(1), 91–105. [DOI] [PMC free article] [PubMed] [Google Scholar]
- Zhang, Y. , Qiu, T. , Yuan, X. , Zhang, J. , Wang, Y. , Zhang, N. , Zhou, C. , Luo, C. , & Zhang, J. (2019). Abnormal topological organization of structural covariance networks in amyotrophic lateral sclerosis. NeuroImage: Clinical, 21, 101619. [DOI] [PMC free article] [PubMed] [Google Scholar]
Associated Data
This section collects any data citations, data availability statements, or supplementary materials included in this article.
Supplementary Materials
Figure S1 The average inter‐node distance between connected nodes as the number of motion‐affected scans included in an analysis increases. The two plots show the same data displayed with different scaling on the y‐axis. The plots show that as the number of motion‐affected scans increases there is a subtle increase in the number of distal connections relative to the number of proximal connections when motion‐affected scans comprise less than 50% of the sample.
Data Availability Statement
The data that support the findings of this study are openly available at https://openneuro.org/datasets/ds003639.


