

Abstract
Background & aims:
Pancreatic ductal adenocarcinoma (PDAC) is characterized by severe metabolic stress due to fibrosis and poor vascularization. BZW1 is an eIF5-mimic protein involved in tumorigenesis and progression. The aim of this study was to investigate the role of BZW1 in metabolic stress resistance in PDAC.
Methods:
BZW1 expression was evaluated in human PDAC tissue microarray and PDAC cells. Glycolysis regulation of BZW1 and its correlation with glycolysis-related genes was analyzed. Tumor growth, cell proliferation and apoptosis were evaluated in mice xenograft tumors and patient-derived organoids.
Results:
The results of bioinformatic screening identified that BZW1 was one of the top three genes favorable for tumor progression in PDAC. The analysis of our cohort confirmed that BZW1 was overexpressed in human PDAC tissues compared with non-tumor tissues, and its abnormal expression was correlated with large tumor size and poor prognosis. BZW1 promoted cell proliferation and inhibited apoptosis in both mouse xenograft models and PDAC derived organoids via facilitating glycolysis in oxygen-glucose deprivation condition. Mechanically, BZW1 serve as an adaptor for PERK, facilitate the phosphorylation of eIF2α, promoted internal ribosome entry site (IRES) - dependent translation of HIF1α and c-Myc, and thereby boosted the Warburg effect. In organoid-based xenografts with high BZW1 levels, both the PERK/eIF2α phosphorylation inhibitor GSK2606414 and ISRIB significantly suppressed tumor growth and prolonged animal survival.
Conclusion:
BZW1 is a key molecule in the IRES-dependent translation of HIF1α/c-Myc and plays crucial roles in glycolysis of PDAC. BZW1 might serve as a therapeutic target for patients with pancreatic cancer.
Keywords: BZW1, glycolysis, eIF2α, PERK, PDAC
Introduction
Pancreatic ductal adenocarcinoma (PDAC) remains one of the most lethal cancers with a 5-year survival rate of less than 7%1. Despite recent progress in diagnostics and therapeutics, the prognosis of PDAC patients was still unsatisfactory2.
From a recent study utilizing systems-level approaches to analyze the genome-wide transcriptomes of 17 major cancer types with respect to clinical outcome, a general pattern emerged: poor survival was associated with the up-regulation of genes involved in cell growth3. PDAC is histologically characterized by significant fibrosis and poor vascularity, causing severe metabolic stress in cancer cells4. Cancer cells predominantly metabolize glucose by aerobic glycolysis (Warburg effect) rather than oxidative phosphorylation even in the presence of sufficient oxygen5, 6. The Warburg effect is controlled by the activation of oncogenic signaling, such as the MAPK, PI3K-AKT pathways and abnormally activated oncogenes (e.g., Ras, HIF1α, c-Myc)7–9.
Metabolic stress elicits adaptive responses in cells that coordinate genes expression to control cell proliferation and survival. In general, these responses inhibit global translation, especially for proteins non-essential for cell survival and proliferation, to preserve energy, while selective translation of essential genes is often prominent instead10, 11. One key player in translation control is the translation initiation factor eIF2α12. Stress-induced phosphorylation of eIF2α at serine 5113 leads to global protein synthesis reduction while paradoxically enhancing the translation of selected mRNAs containing short upstream open reading frames (uORF) in the 5′ Untranslated Regions (UTRs) and Internal Ribosome Entry Site (IRES) in a cap-independent manner14. Many IRES-containing mRNAs encode proteins involved in cell proliferation and survival, such as HIF1α and c-Myc, suggesting the importance of IRES-dependent translation regulation for cells adaption to stress conditions15, 16.
Basic leucine zipper and W2 domain-containing protein 1 (BZW1), containing a N-terminal bZIP and a C-terminal W2 domain, was originally identified as a conserved regulator involved in the control of histone H4 gene during G1/S transition17. BZW1 was overexpressed in certain types of cancers and involved in tumorigenesis and progression18–22. As an eIF5-mimic protein, the BZW1 complex purified from HEK293T cells contained eIF2α, which was also found in the eIF5 partners23. However, the specific effect of BZW1 on eIF2α is unclear yet.
Here we investigated the role of BZW1 in PDAC tumor growth under metabolic stress. Our results demonstrated that BZW1 overexpression in PDAC promoted metabolic stress resistance and glycolysis by controlling eIF2α phosphorylation mediated translation of HIF1α and c-Myc.
Materials and Methods
Cell Culture and Reagents
Pancreatic cancer cell lines and normal pancreatic ductal epithelial cell line HPDE6-C7 were obtained from the Type Culture Collection Committee of the Chinese Academy of Sciences (Shanghai, China). Primary PDAC cell lines PTX0001, PTX0015 and PTX0049 were purchased from WuXi Pharmatech Company (WuXi, China). Cells were cultured in basic medium (DMEM, RPMI-1640 or IMDM) supplemented with 10% (v/v) fetal bovine serum and 1% (v/v) penicillin/streptomycin and incubated at 37°C in a humidified incubator under 5% CO2 condition.
Clinical Specimens
Human PDAC tissues were collected from patients during surgery in Tianjin Medical University Cancer Institute and Hospital (China). Approval to collect specimens and patients’ information include age, gender, TNM stage, etc. was granted by the Ethics Committee of the Tianjin Medical University Cancer Institute and Hospital with a written informed consent giving to the patients.
PDAC organoid construction
PDAC organoids construction was guided by methods previously described24. Briefly, PDAC surgical samples were collected and cut into pieces and mechanically dissociated in Digestion Media in Human Complete Feeding Medium at 37°C with consistent agitation for 5 to 10 minutes. The supernatant was then removed while sedimentary dissociated cells and tissue fragments were washed by Human Wash Medium to terminate digestion. Then the sediments were plated with Matrigel and grown in Human Complete Feeding Medium. Subsequent experiments were performed after at least 5 times of passage.
Glucose uptake and lactate production assay
Glucose uptake and lactate production assay was performed according to the manufacturer’s protocols (Biovision). Briefly, cells were seeded into 6-well plates, and starved them in Krebs–Ringer–Phosphate–Hepes buffer containing 2% BSA for 40 min after adhesion. 10 mM 2-DG was added and incubated for 20 min. Cells were lysed with 90 ml of extraction buffer and then heated at 90°C for 40 min and cool on ice for 5 min. The cell lysates or tumor homogenates were neutralized by adding 10 ml of neutralization buffer. After centrifugation, the supernatant was used for determination of glucose uptake (Biovision). Lactate production in the medium was detected using the Lactate Assay Kit according to the manufacturer’s instruction. Results were normalized to protein concentration of each sample.
IRES-dependent translation
The bicistronic vector pRF was constructed by inserting the firefly luciferase gene from the plasmid pGL-6 (Beyotime) into the linker region of the plasmid pRL-SV4 (Promega), downstream of the Renilla luciferase gene. HIF1A or MYC IRES was inserted upstream of the translation start codon of the firefly luciferase gene in the dual luciferase vector. Tumor cells were transfected with the indicated reporters harboring different IRES. The firefly and Renilla luciferase activities were measured and the ratio of firefly luciferase activity to Renilla was calculated.
Subcutaneous and Orthotopic Xenograft Model
Female athymic male nu/nu mice 4–6 weeks were purchased from Charles River company and housed in a high-efficiency particulate air (HEPA)-filtered animal facility. All procedures were approved by the Ethics Committee of Tianjin Medical University Cancer Institute and Hospital and in accordance to NIH guidelines. A total of 2×10⁶ cells in Matrigel were subcutaneously or orthotopically injected in each mouse to develop tumors. After 4 weeks, mice were partially sacrificed and the tumors were collected and measured after keeping enough mice for survival analysis. The tumor volume was calculated as follows: volume = length × width× width /2. As regard the treatment study, mice were randomly separated into different groups for drug administration. GSK2606414 (100mg/kg) was administrated by gavage, or ISRIB (2.5mg/kg) was intraperitoneally injected into the mice twice a week after the tumor developed.
Statistical Analysis
Statistical analysis was performed using IBM SPSS 19 and Graphpad Prism v7. Data were presented as mean ± SD, and each experiment was performed in triplicate. The student’s t-test or one-way ANOVA was used for comparison between or among groups, respectively. Cumulative survival time was calculated by the Kaplan-Meier curve and analyzed by the log-rank test. For survival analysis, 1/3–2/3 vs 2/3–1/3 was used in TCGA-PDAC datasets to separate into two groups25. Correlation of BZW1 expression with clinicopathological features of PDAC patients was evaluated by χ2 test or Fisher’s exact test. All probability values had a statistical power level of 90%, and a 2-sided level of 5%. P < 0.05 was considered statistically significant.
Results
BZW1 is a candidate tumor-promoting gene in pancreatic cancer.
To identify potential genes oncogenes driving tumor progression in PDAC, we utilized the current public data bases and conducted series filtration process. The genes abundantly expressed in PAAD, and negatively correlated with patients’ prognosis were considered to be candidate genes. Meanwhile, we focused on genes promoting tumor growth which was mostly reflected by T stage in all these clinicopathological parameters. Based on this selection pattern, we first selected 568 significantly up-regulated genes in tumor tissues from three large-scale GEO datasets consisting of 220 pairs of PDAC tumor tissues and non-tumor tissues (Supplementary Table 1). Among these, 206 genes were associated with unfavorable overall survival (OS) and disease-free survival (DFS) based on The Cancer Genome Atlas (TCGA) datasets. To search for potential cell growth related genes, these 206 genes were further analyzed according to the tumor size data of TCGA, highlighting 45 positively correlated genes. Finally, the genome-wide mRNA sequencing was performed to rank their expression levels in 3 primary PDAC cell lines. The top three genes were GAPDH, LDHA and BZW1 (Figure 1A, Supplementary Figure 1A–1D). Glyceraldehyde 3-phosphate dehydrogenase (GAPDH) and Lactate dehydrogenase A (LDHA) were key enzymes in the process of glycolysis, which have been extensively explored in cancer, including pancreatic cancer26–31, However, the roles of BZW1 were rarely explored in tumors. In this study we analyzed the clinical significance and elucidated the roles of BZW1 in pancreatic cancer.
Figure 1. Expression and clinical significance of BZW1 in PDAC tissues and cell lines.
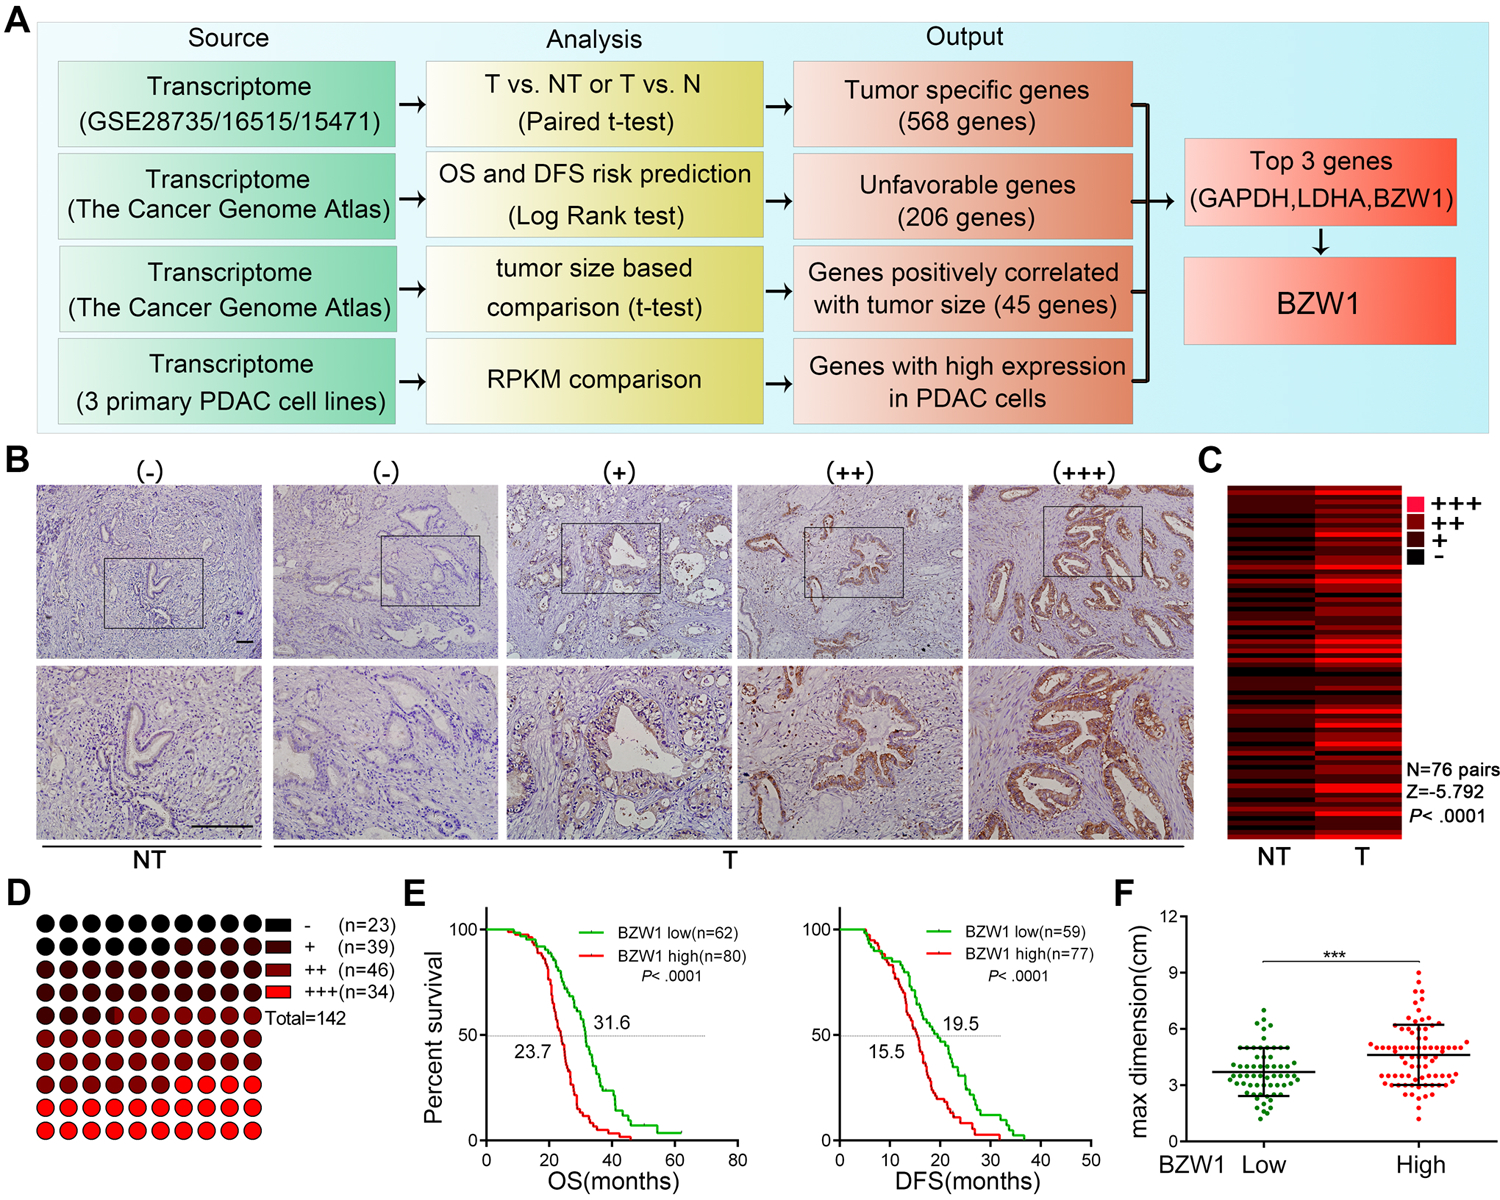
A, schematic illustrate for strategies screening key genes involved in tumor progression of PDAC. GEO datasets were used to determine the up-regulated genes in PDAC tissues (T) compared with normal or non-tumor tissues (N/NT). TCGA datasets were used to select genes related to unfavorable prognosis and tumor size. RNA sequencing profiles of three primary PDAC cell lines (PTX0001, PTX0015 and PTX0049) was used to determine specific genes highly expressed in PDAC cell lines. B-C, representative images of differential BZW1 staining in PDAC tumor and NT tissues: no expression (−), weak (+), moderate (++) and strong expression (+++) (B). The differential expression of BZW1 in 76 pairs of tumors and NT tissues are shown in a heat-map and then statistically analyzed by Wilcoxon signed ranks test (C). D, the distribution of IHC staining intensity in 142 PDAC tissues. E, Kaplan–Meier analysis of OS and DFS of 142 PDAC patients according to different BZW1 expression level. Moderated and strong expression were defined as BZW1 high and others as BZW1 low. F, statistical analysis of the tumor sizes according to different BZW1 expression in our cohort, unpaired t tests were used. Shown are mean ± SD, *P < 0.05. Scale bar, 100μm.
In the TCGA cohort of 179 patients, high mRNA level of BZW1 was significantly correlated with advanced tumor size (Supplementary Table 2), implicating a role of BZW1 in PDAC tumor growth. IHC staining in 76 pairs of PDAC tumor tissues and their matched adjacent non-tumor tissues exhibited that BZW1 was overexpressed in most tumor tissues (Figure 1B–C). In 8 pairs of fresh PDAC tumor tissues and adjacent non-tumor tissues (surgical samples), the expression of BZW1 was also higher in tumor tissues (Supplementary Figure 1E–F). Consistently, BZW1 expression was substantially higher in most PDAC cell lines compared with the normal pancreatic ductal epithelial cell line (Supplementary Figure 1G–H).
The clinical significance of BZW1 expression was further analyzed in a tissue microarray containing 142 PDAC specimens (Figure 1D). Among them, BZW1 was positive expressed in 119 (83.8%) and negative expressed in 23 (16.2%) PDAC specimens. 34 (23.9%) specimens were highly expressed, 46 (32.4%) specimens were moderately expressed and 39 (27.5%) specimens were weakly expressed. Our results showed that BZW1 was positively correlated with TNM staging, lymph node metastasis, tumor size, and predicted a poor prognosis (Figure 1E, 1F and Supplementary Table 3). Meanwhile, BZW1 was an independent prognostic factor using multivariate analysis (Supplementary Table 4). Taken together, our results suggested that BZW1 was overexpressed in PDAC tissues and unfavorable for patients’ survival.
BZW1 facilitates cancer cell survival and proliferation in low oxygen-glucose condition
Since BZW1 expression in PDAC patients was related to tumor size, we explored the effects of BZW1 on PDAC cells survival and proliferation. PDAC stable cell lines with BZW1 overexpression or knockdown were established (Supplementary Figure 2A) and subjected to oxygen-glucose deprivation, a condition mimicking metabolic stress in PDAC. BZW1 knockdown increased apoptosis (Figure 2A–B, Supplementary Figure 2B) and reduced the cell proliferation rate and viability of L3.7-2 and CFPAC-1 cells (Figure 2C–D, Supplementary Figure 2C–D), while BZW1 overexpression in SW1990 and PanC-1 cells showed opposite results (Figure 2A–D, Supplementary Figure 2B–D).
Figure 2. BZW1 promotes tumor growth in pancreatic cancer.

A-B, the indicated cells were cultured in an extremely low oxygen-glucose condition (glucose concentration, 1 mM; oxygen concentration, 1%). Apoptosis was detected by Annexin-V/PI staining followed by flow cytometry 12h after incubation (A) and Caspase-3/7 activity was measured 48h after incubation (B). C-D, the indicated cells were cultured in a low oxygen-glucose condition (glucose concentration, 2.5 mM; oxygen concentration, 1%). the EDU incorporation assay were conducted 24 hours after incubation and detected by flow cytometry (C). CCK8 assay was used to detect the cell viability at the indicated time point (D). E-H, the indicated tumor cells were orthotopically transplanted into nude mice. The tumor volumes of the indicated group were shown in E. Percentages of TUNEL+ (F) and Ki67+ (G) cells were detected in the harvest tumors. Cumulative survival analysis of the indicated group was shown in H. I, BZW1 overexpression or knockdown organoids of equal amounts of cells were passaged (day 0). Cell viability at the indicated time point under relative low glucose (10 mM) and low oxygen (1%) condition was measured by CellTiter-Glo. Representative images under 20× magnification was shown in left. The cell viability detected by the luminescence signal intensity was shown in right. Scale bar, 200μm. J-L, BZW1 overexpression or knockdown organoids were xenografted into the nude mice, and the volumes of the harvested tumor were calculated in J. The percentages of Ki67+ (K) and TUNEL+ (L) cells were also shown. M, correlation analysis of BZW1 with TUNEL+ and Ki67+ cells in human PDAC samples. Representative images of TUNEL+/Ki67+ cells revealed by IF staining were shown in left. Scale bar, 100μm. N, Spearman correlation analysis between mRNA expression level of BZW1 and MKI67 or BAX in 179 PDAC patients from TCGA data. Unpaired t tests were used. Shown are mean ± SD, *P < 0.05.
Genetic silencing of BZW1 significantly reduced the PDAC tumor burden in both subcutaneous and orthotopic xenograft model and prolonged the median survival of orthotopic xenograft mice for several weeks, while BZW1 overexpression increased the tumor burden and shortened the median survival of these mice (Figure 2E, 2H, Supplementary Figure 3A, 3D). In the harvested tumors, BZW1 depletion increased cells apoptosis and reduced proliferation, and vice versa, implicating that BZW1 is essential for PDAC cell survival and proliferation (Figure 2F–G, Supplementary Figure 3B–C, 3E–F).
To more precisely evaluate the function of BZW1 in PDAC, we constructed several organoids derived from different surgical samples of PDAC patients. Based on their background BZW1 expression level (Supplementary Figure 4A–B), we knocked down and overexpressed BZW1 in #3 and #6 organoids, respectively (Supplementary Figure 4C). The viability of organoids was decreased upon BZW1 knockdown and increased after BZW1 overexpression (Figure 2I). We subcutaneously xenografted these organoids into the nude mice, as shown in Figure 2J and Supplementary Figure 4D, the BZW1 knockdown decreased, while BZW1 overexpression aggravated the tumor burden of these nude mice. The TUNEL and Ki67 staining showed BZW1 promote survival and proliferation of the organoid xenograft model (Figure 2K–2L).
Importantly, in clinical samples with high BZW1 expression, the cell proliferation rate was remarkably higher, while cell death rate was lower than that in the low BZW1 expression group (Figure 2M). Simultaneously, in TCGA data, BZW1 mRNA expression were positively correlated with the proliferative marker MKI67 and negatively correlated with the apoptosis marker BAX (Figure 2N), which was another strong evidence in large sample supporting our hypothesis.
BZW1 modulates glycolysis to facilitate PDAC cell survival and proliferation
To explore the mechanism that BZW1 promotes tumor growth, Gene set enrichment analysis (GSEA) was performed using TCGA data of PDAC patients based on BZW1 transcriptional levels. The results showed significant alterations in glycolysis, one of the key processes affecting tumor growth in PDAC’s metabolic stress condition, as well as hypoxia and Myc pathway, which were also highly related with cancer cells proliferation and metabolism, especially glycolysis (Figure 3A). Moreover, BZW1 mRNA expression was positively correlated with most of the glycolytic enzymes in TCGA (Supplementary Figure 5) and this correlation were verified in our PDAC cell lines (Figure 3B). Then we investigated the underlying reprogrammed glucose metabolism modulated by BZW1. We found that BZW1 knockdown significantly inhibited, while BZW1 overexpression promoted glucose uptake, lactate excretion, ECAR and OCR in PDAC cells in oxygen-glucose deprivation condition (Figure 3C, Supplementary Figure 6A–D). Furthermore, liquid chromatography-coupled tandem mass spectrometry (LC-MS/MS)-based analysis indicated a decrease in the intermediate metabolites of glycolysis upon silencing BZW1, such as G6P, F6P, pyruvate and lactate. BZW1 overexpression, conversely, increased their levels (Figure 3D). BZW1 knockdown exhibited same effects on glucose uptake, lactate production and expression level of vital glycolytic genes in xenografted models (Supplementary Figure 6E–H). These in vivo and in vitro experiments suggested the crucial role of BZW1 in regulating Warburg effects.
Figure 3. BZW1 modulates glycolysis to facilitate cancer cell survival and maintain proliferation.

A, indicated GSEA plots based on the TCGA data using Hallmarks gene sets. NES: normalized enrichment score. NOM-p-val: nominal p value. FDR q-val: false discovery rate q-value. B-D, the indicated cells were cultured in a low oxygen-glucose condition. RT-PCR was used to detect relative mRNA expression of glycolysis-related genes (B). Glucose uptake, lactate excretion, ECAR and OCR measurement were shown in C. Major metabolites alteration in the glycolytic pathway detected by LC-MS/MS were shown in D. E-F, the BZW1 knockdown cells were cultured in no glucose medium with additional 2.5mM galactose and low oxygen condition. The apoptosis rate was detected by Annexin V/PI staining (E) and Caspase-3/7 activity (F). Unpaired t tests were used. Shown are mean ± SD, *P < 0.05.
To determine whether the function of BZW1 in PDAC depended on glycolysis, PDAC cells were cultured in medium containing galactose instead of glucose. Replacing glucose with galactose slowed down glycolytic flux and forced the cells to rely on oxidative phosphorylation32, 33, abrogating the anti-apoptotic effect of BZW1 (Figure 3E–F). Collectively, these findings indicated that BZW1 facilitated PDAC cell survival and proliferation under metabolic stress by modulating glycolytic capability.
BZW1 enhances the Warburg effect via selective translation of HIF1α and c-Myc
We speculated that BZW1 might interact with hypoxia and Myc pathways and affect glycolysis through them, since these two pathways were upregulated in the BZW1 high patients (Figure 3A) and vital adjustment of Warburg effect. Thereby, we investigated the effect of BZW1 on HIF1α and c-Myc, core molecules of these two pathways, in PDAC cell lines9, 34, 35. As shown in Figure 4A, knockdown of BZW1 remarkably decreased, whereas BZW1 overexpression significantly increased HIF1α and c-Myc protein level. We also re-expressed BZW1 in BZW1 knockdown cells. The expression levels of HIF1α and c-Myc were also restored, indicating specificity of this effect (Supplementary Figure 7A). Knockdown of BZW1 also significantly reduced HIF1α and c-Myc expression in mouse transplanted tumor tissues (Figure 4B and Supplementary Figure 7B). BZW1 was also co-localized with HIF1α and c-Myc in consecutive sections of PDAC tissues (Figure 4C), implicating their positive correlation in PDAC patients. Overexpression of HIF1α or c-Myc remarkably recovered glycolysis, cell survival and proliferation of BZW1 knockdown cells (Supplementary Figure 8A–F), indicating that BZW1 promoted the glycolysis and metabolic stress resistance through HIF1α and c-Myc.
Figure 4. BZW1 promotes IRES-dependent translation of HIF1α and c-Myc in low oxygen-glucose condition.

A, indicated PDAC cell lines with BZW1 up-regulation or knockdown was subjected to Western blotting (WB). B, L3.7-2 cells with or without BZW1 knockdown were orthotopically transplanted into the nude mice. The harvested tumors were subjected to IHC staining to analyze HIF1α and c-Myc expression. Representative IHC staining images were shown. C, representative IHC staining images of high and low BZW1 and matched HIF1α/c-Myc in consecutive sections of our PDAC surgical specimen cohort. Spearman correlation analysis between BZW1 and HIF1α/c-Myc staining intensity were shown in right. D, indicated PDAC cell lines were subjected to RT-PCR to detect HIF1A and MYC mRNA expression level. E, HIF1α and c-Myc protein degradation curves. L3.7-2 cells with or without BZW1 knockdown treated with cycloheximide were harvested at the indicated time points and subjected to WB to detect HIF1α and c-Myc expression level. The gray scale was measured by ImageJ and normalized to β-Tubulin. F-G, Polysome profiles from the indicated cells. The fractions of polysomes were mixed. The RNA of the mixture was isolated and subjected to RT-PCR to determine the polysomal mRNA expression of HIF1A and MYC (F). Absorbance at 254 nm was shown as a function of sedimentation (G). H, the indicated cells were cultured in OPP containing media, and the OPP incorporated into newly translated proteins was detected by IF. I, BZW1 overexpression or knockdown cells were transfected with the HIF1A or MYC IRES or mutated reporters (up). The ratio of firefly luciferase activity to Renilla was measured. Unpaired t tests were used. Shown are mean ± SD, *P < 0.05. Scale bar, 100μm.
Next, we explored the mechanism by which BZW1 regulated HIF1α or c-Myc expression. We found that HIF1A and MYC mRNA levels were not changed upon BZW1 overexpression or knockdown, suggesting the posttranscriptional regulation by BZW1 (Figure 4D). Meanwhile, BZW1 did not alter the degradation of HIF1α and c-Myc protein (Figure 4E and Supplementary Figure 7C), indicating that BZW1 might affect HIF1α and c-Myc translation. To test our hypothesis, the polysomal mRNA levels of HIF1A and MYC were examined. Knockdown of BZW1 remarkably decreased the polysomal mRNA levels of HIF1A and MYC while increasing the levels of overall polysome fractions, and vice versa (Figure 4F–G). In addition, the O-propargyl-puromycin (OPP) protein synthesis assay showed that the newly translated proteins were increased upon BZW1 knockdown and decreased when BZW1 was overexpressed (Figure 4H). These data demonstrated that BZW1 promoted the selective translation of HIF1α and c-Myc, but reduced global protein synthesis.
To test whether translation of HIF1α and c-Myc might be regulated by BZW1 through IRES they both possessing, we constructed a series of bicistronic reporter systems36. BZW1 overexpression significantly increased the activity of HIF1A and MYC IRES controlled luciferase reporter while BZW1 knockdown decreased (Figure 4I). Meanwhile, mutation of IRES sequence almost abrogated its translational regulation by BZW1 (Figure 4I). These results supported that BZW1 promoted the selective translation of HIF1α and c-Myc, and thus their expression level in an IRES dependent manner.
BZW1 induces eIF2α phosphorylation to regulate selective translation
It was reported that BZW1 and BZW2 were both eIF5 mimic proteins23 and BZW2 could bind to eIF2α, key controller of IRES-dependent translation in integrated stress response37, 38 to regulate global translation39. Hence, there is a reasonable inference that BZW1 might regulate selective translation of HIF1α and c-Myc through eIF2α. As shown in Figure 5A, the phosphorylation of eIF2α-Ser51 was markedly decreased in BZW1 knockdown and increased in BZW1 overexpression cells without altering the total eIF2α level. BZW1 was also co-localized with p-eIF2α in consecutive sections of PDAC tissues (Figure 5B). Moreover, the PDAC patients with low p-eIF2α expression had better prognosis than those with high p-eIF2α expression (Figure 5C). Treating BZW1 knockdown cells with Salubrinal (a selective inhibitor of cellular complexes that dephosphorylate eIF2α40) and Sal003 (a cell-permeable inhibitor of the eIF2α phosphatase GADD3441), markedly increased eIF2α phosphorylation and restored the expression levels of HIF1α and c-Myc (Figure 5D), indicating that eIF2α phosphorylation was involved in BZW1 mediated regulation of HIF1α and c-Myc. The multicolor immunofluorescence staining showed the co-expression of BZW1, HIF1α, c-Myc, and elF2α in the human PDAC cell line and organoids (Supplementary Figure 9A–B). In the meantime, luciferase reporter assay with bicistronic reporters harboring HIF1A and MYC IRES showed that Salubrinal and Sal003 treatment was able to restore the impaired IRES-dependent translation of HIF1α and c-Myc (Figure 5E). The reduced glycolysis capability (Figure 5F) as well as cell survival and proliferation (Figure 5G) could also be regained. Taken together, these findings supported that BZW1 regulated HIF1α and c-Myc, controlled glycolysis and metabolic stress resistance in PDAC by promoting eIF2α phosphorylation.
Figure 5. BZW1 expression induces phosphorylation of eIF2α.

A, the indicated cells were subjected to WB to detect the total and phosphorylated eIF2α. B, Representative IHC staining images of PDAC consecutive sections with high and low BZW1 and matched p-eIF2α. Spearman correlation analysis of BZW1 with p-eIF2α in our cohort were also shown. Scale bar, 100μm. C, Kaplan–Meier analysis of OS and DFS according to different p-eIF2α expression level in our cohort. D, L3.7-2 control and BZW1 knockdown cells were cultured with or without 10 nM Salubrinal or 100 nM Sal003 for 12h, then subjected to WB to detect the expression of p-eIF2α, HIF1α and c-Myc. E-G, L3.7-2 control and BZW1 knockdown cells were incubated with or without Salubrinal or Sal003 for 24h. E, the indicated cells were transfected with the HIF1A or MYC IRES bicistronic reporters before incubation. The ratio of firefly luciferase activity to Renilla was calculated. Glucose uptake and lactate excretion level (F), Cell apoptosis and proliferation rate (G) of the indicated cells was measured after 24h low oxygen-glucose treatment in the meantime of drug administration. Unpaired t tests were used. Shown are mean ± SD, *P < 0.05. H, PDAC cells were transfected with control plasmid or FLAG-tagged BZW1. Cell lysates were then subjected to immunoprecipitation. Immunoblotting was then performed using eIF2α or BZW1 antibody.
The oncogenic Kras mutation is the major event in pancreatic cancer and related to tumor growth8, 42. BZW1 also correlated with HIF1α, c-Myc and p-eIF2α in KPC (LSL-KrasG12D/+, LSL-Trp53R172H/+ and Pdx1-Cre) mouse models and cell line (Supplementary Figure 10A–C). These effects were also observed in both hTERT-HPNE (HPNE) and hTERT HPNE E6/E7 St Kras (HPNE Kras mut) cell lines (Supplementary Figure 10D). BZW1 overexpression promoted the lactate excretion and glucose uptake of these cell lines and vice versa (Supplementary Figure 10E–F), implicating the effects of BZW1 under both mutant and wild type Kras.
We next determined whether BZW1 was also physically associated with eIF2α. The co-immunoprecipitation assay with exogenous Flag-BZW1 or endogenous BZW1 suggested that these two proteins could interact with each other in PDAC cells (Figure 5H). Immunofluorescence staining of cell lines and human PDAC tissues showed their co-localization (Supplementary Figure 11A). The in vitro co-immunoprecipitation assay with purified BZW1 and eIF2α implicated a directly interaction of these two proteins (Supplementary Figure 11B). To further investigated which domain of BZW1, N-terminal bZIP or C-terminal W2 domain, was responsible for interacting with eIF2α, we generated Flag-bZIP and Flag-W2 domains of BZW1. As shown in Supplementary Figure 11C, W2 domain of BZW1, rather than bZIP domain, was able to pull-down eIF2α, suggesting the indispensable role of W2 domain in this interaction.
BZW1 scaffolding function regulates eIF2α phosphorylation by promoting eIF2α-PERK interaction
Next, we explored the deeper molecular mechanisms of BZW1 stimulating eIF2α phosphorylation. Based on the facts that BZW1 could interact with eIF2α, we speculated that BZW1 might be involved in the interaction of some molecules with eIF2α, especially for eIF2α kinase and phosphatase, crucial regulators of eIF2α phosphorylation. Thus, co-immunoprecipitation (CoIP) combined with mass spectrometry was performed to identify possible BZW1 interaction partners (Supplementary Figure 12A). The result showed that PERK was a potential BZW1 interaction partner (Supplementary Table 5), and their interaction was further examined by co-immunoprecipitation (Figure 6A). No interaction between BZW1 and other eIF2α main regulators including GADD34, HRI, PKR or GCN2 was detected (Figure 6A). Immunofluorescence staining showed that BZW1 and PERK also co-localized in PDAC cells and tissues (Supplementary Figure 12B).
Figure 6. BZW1 scaffolding function regulates eIF2α phosphorylation by promoting eIF2α-PERK interaction.

A, up, SW1990 cells were transfected with control plasmids or FLAG-tagged BZW1. Cell lysates were subjected to immunoprecipitation, then Flag, HRI, PKR, PERK, GCN2 and GADD34 in the immunoprecipitation was detected by immunoblotting. Down, the SW1990 cell lysates were immunoprecipitated by control IgG or PERK antibody, then immunoblotted by BZW1 antibody to detected endogenous BZW1 - PERK interaction. B, the lysates from L3.7-2 cells with or without BZW1 knockdown was subjected to immunoprecipitation, and the WB were conducted with the indicated antibodies. C, the purified catalytic domain of PERK (PERK-CD) and eIF2α proteins were incubated together with or without BZW1 in vitro. The PERK-eIF2α interaction was examined by eIF2α IB after immunoprecipitated by PERK. D, SW1990 BZW1 overexpression cells were incubated with or without 10μM GSK2606414 (PERKi) or siRNA against PERK (PERKsi) for 12h, then subjected to WB. E-G, SW1990 BZW1 overexpression cells were incubated with or without GSK2606414 (GSK) or PERK siRNA. E, the cells were transfected with bicistronic reporters before incubation, the ratio of firefly luciferase activity to Renilla was calculated. Under the low oxygen-glucose condition, glucose uptake and lactate excretion of these cells were measured in F, cell apoptosis and proliferation were in G. H-K, the indicated tumor cells were subcutaneously transplanted into nude mice. GSK2606414 or ISRIB were administrated to the mice after the tumor developed. The volume of the harvested tumors was measured (H, I), the apoptosis and proliferation of these tumors were detected (J) and the survival of the indicated group was shown in K. Unpaired t tests were used. Shown are mean ± SD, *P < 0.05.
PERK is a type I ER transmembrane protein consisting of a N-terminal lumenal domain and a C-terminal cytoplasmic catalytic domain which directly interacts with eIF2α43–45. Therefore, we speculated that the interaction between BZW1 and PERK depended on the catalytic domain of PERK. To investigate this hypothesis, we generated a series of domains of PERK. As shown in Supplementary Figure 12C, the catalytic domain of PERK, but not lumenal domain, was able to pull-down BZW1, indicating that BZW1 interact with PERK through its catalytic domain. Since PERK is an ER transmembrane protein, which is difficult to purify in vitro, the purified catalytic domain of PERK was utilized to detect the direct interaction between PERK and BZW1 (Supplementary Figure 12D–E). We also found that the bZIP domain of BZW1 mediated the direct interaction with PERK (Supplementary Figure 12F–H).
These results indicated that BZW1, eIF2α and PERK could form a complex in PDAC cells. BZW1 knockdown decreased the amount of eIF2α immunoprecipiated by PERK in PDAC cell lysates (Figure 6B). Meanwhile, BZW1 directly promoted eIF2α and PERK interaction in vitro. (Figure 6C), suggesting a scaffolding function of BZW1.
To further determine whether BZW1 regulated eIF2α phosphorylation through PERK, we downregulated PERK by using siRNA or inhibited PERK activation by using the PERK inhibitor GSK2606414 (an adenosine triphosphate-competitive inhibitor of PERK46) in PDAC cells overexpressing BZW1. Increased eIF2α phosphorylation and HIF1α and c-Myc expression consequent on BZW1 overexpression were all eliminated by PERK knockdown or inhibition (Figure 6D). The enhanced translational activity of HIF1A and MYC IRES, Warburg effect, cell survival and proliferation were also reversed (Figure 6E–G).
To explore the role of BZW1-PERK-eIF2α complex in vivo, we treated the xenograft model with GSK2606414 or ISRIB (an integrated stress response inhibitor rescuing translation in the presence of p-eIF2α by facilitating the assembly of more active eIF2B47, 48), which markedly reduced the tumor burden, promoted cell apoptosis, inhibited cell proliferation and extended the survival time upon BZW1 overexpression (Figure 6H–K), suggesting the importance of this pathway.
BZW1 is a promising biomarker for predicting the efficacy of PERK-eIF2α inhibitors.
Given importance and hyperactivation of BZW1, we conducted initial translation research. Based on the expression levels of BZW1, we divided our organoid models into BZW1 high and low group (Supplementary Figure 4B). Then we treated these organoids with GSK2606414 or ISRIB. As shown in Figure 7A and supplementary Figure 13A, BZW1 high group was significantly more sensitive to eIF-2α phosphorylation inhibition due to BZW1 high expression. The TUNEL and Ki67 staining showed consistent results (Figure 7B–C, Supplementary Figure 13B–C), implicating that the expression level of BZW1 could be a marker for PERK-eIF2α pathway inhibition therapy. Next, we transplanted these organoids into the nude mice and treated the mice with these inhibitors, the tumor inhibition rate of BZW1 high group was significantly higher than that of BZW1 low group (Figure 7D–E, Supplementary Figure 13D). The Ki67 and TUNEL staining results also strongly proved our conclusion (Figure 7F–G, Supplementary Figure 13E–F). Taken together, targeting BZW1-PERK-eIF2α pathway could greatly inhibit PDAC cells proliferation and survival, and the expression level of BZW1 would predict the therapeutic efficiency of these inhibitors and filtrate benefit population.
Figure 7. BZW1 is a promising biomarker for predicting the efficacy of eIF2α-PERK inhibitors.

A-C, the BZW1 high and low expression organoids (7–10 days after passage) were treated with 10μM GSK2606414 for 0–72h. A, the cell viability was measured by CellTiter-Glo and normalized by 0h. Representative images of the organoids were shown in left, and the relative cell viabilities of each sample at different time points were calculated in right. Scale bar, 200μm. B-C, representative TUNEL (B) and Ki67(C) staining images of the organoids treated with GSK2606414, and the percentage of positive cells was also shown. Scale bar, 100μm. D–G, the BZW1 high and low expression organoids were subcutaneously xenografted into the nude mice and treated with saline (Ctr.) or GSK2606414. The representative images of the harvested tumors were shown in D, and the volume and calculated inhibition rate (GSK versus Ctr.) were shown in E. The representative images and positive rate of TUNEL (F) and Ki67 (G) staining were also shown. Scale bar, 100μm. Unpaired t tests were used. Shown are mean ± SD, *P < 0.05. H, schematic diagram. BZW1 promotes PERK-eIF2α interaction to facilitate eIF2α phosphorylation, thereby increasing HIF1α and c-Myc IRES dependent translation. These two key molecules controlling glycolysis enable cancer cells more resistant to the metabolic stress generated by PDAC microenvironment.
Discussion
Poor patient survival is generally associated with the up-regulation of genes involved in cell growth and down-regulation of genes involved in cellular differentiation3. We utilized multiple sequencing data to search for potential unfavorable tumor size related genes, which is the most intuitive reflects on tumor growth. In the present study, several novel insights into BZW1-mediated malignant phenotype were revealed.
Our study indicated the oncogenic characteristics of BZW1 in PDAC. In previous study, BZW1 was found to promote tumor progression in multiple cancer types18–22. We found that BZW1 was high expressed in PDAC tumor tissues compared with non-tumor tissues. Exogenous BZW1 facilitated cancer cells survival and proliferation under low oxygen-glucose condition mimicking the metabolic stress in PDAC. These results were consistent with its clinicopathological features and supported our screening process. In addition, the pro-survival and pro-proliferation role of BZW1 are dependent on Warburg effect as revealed by the transcriptomic and metabolomic analysis.
Accumulated evidence reveals the increased importance of Warburg effect in promoting tumor growth. HIF-1α and c-Myc are key regulators of the Warburg effect9, which enhance the expression of the majority of the glycolytic genes and thereby stimulating glycolytic influx35, 49. Interestingly, in this study, we found that BZW1’s oncogenic function depended on the IRES-dependent selective translation of HIF1α and c-Myc. It is not a coincidence that both HIF1A and MYC harbored an IRES structure in their mRNA. Although the existence of IRES in viral mRNAs is abundantly studied and accepted, the understanding of the role of cellular IRES is not completely clear. Noteworthily, most IRES-containing cellular mRNAs play crucial roles in cell survival, proliferation, and apoptosis. IRES-mediated translation allows the selective translation of these mRNAs when the global protein synthesis is relatively reduced under stress conditions.
BZW1 was originally identified as a conserved regulator for histone H4 transcription50. However, in our study, BZW1 is mainly expressed in the cytoplasm and rarely detected in the nucleus of PDAC cells. Recently, several studies have defined BZW1 as an eIF5-mimic protein that might interact with eIF2α similar to its homologous protein eIF5 and BZW223. eIF2α is the key regulator of translation efficiency. Many different types of stress triggered the phosphorylation of eIF2α, which leaded to global protein synthesis reduction, paradoxically enhancing the translation of a subset of specific mRNAs especially for mRNAs containing IRES, such as PDGF-2, VEGF and c-Myc10, 51, 52. Thus, we speculated the effect of BZW1 on HIF1α and c-Myc was associated with eIF2α. The results showed that BZW1 directly interacted with eIF2α via W2 domain, and BZW1 overexpression induced phosphorylation of eIF2α, which was indispensable for BZW1 mediated HIF1α and c-Myc translation.
The phosphorylation of eIF2α is regulated by 4 protein kinases: heme-regulated inhibitor kinase (HRI), protein kinase RNA (PKR), PKR-like endoplasmic reticulum kinase (PERK), general control non-derepressible-2 (GCN2) and phosphatase GADD3445, 53, 54. Our results showed that BZW1 directly interacted with PERK. Moreover, the interaction between PERK and eIF2α was decreased when BZW1 was knocked down. These results suggested that BZW1 acted as a scaffolding protein to promote PERK-eIF2α interaction. As expected, the genetic or pharmacological inhibition of PERK impeded BZW1-mediated translational control and glycolytic phenotypes, because phosphorylation of eIF2α during oxygen-glucose deprivation is largely mediated by PERK. Our study revealed that the BZW1-PERK-eIF2α complex played a vital role in metabolic stress microenvironment of PDAC cells.
We assumed that relative high expression of BZW1 in PDAC could result in hyperactivation and reliability of PERK-eIF2α pathways, thus we conducted some initial translation experiments. The results showed BZW1 high patients might benefit more from PERK-eIF2α inhibition. This conclusion was more solid based on our preliminary positive effects on patient-derived organoid model, which was more realistic to the clinical situation. The application of these new inhibitors in PDAC will provide a new thought for treatment since drug combinations are becoming increasingly prevalent in cancer therapy.
In conclusion, we demonstrated that BZW1 facilitated PDAC cells survival and proliferation by increasing glycolysis under metabolic stress. The underlying molecular mechanisms was that BZW1 acted as a scaffolding protein to promote the interaction between eIF2α and PERK, resulting in increased eIF2α phosphorylation, thereby increasing HIF1α and c-MYC IRES-dependent translation. Significantly, BZW1 was highly expressed in PDAC tissues and associated with poor prognosis, which pointed out the potential significance of therapeutic intervention against BZW1 to combat PDAC. Although effective and selective BZW1 inhibitors are not available, PERK and eIF2α inhibitors have already been developed. Our data revealed that BZW1 is a promising biomarker for predicting the efficacy of PERK-eIF2α inhibitors.
Supplementary Material
Financial support:
This work was supported in part by the National Natural Science Foundation of China (grants 81871978, 82072659, 81772633, 81720108028, 81525021, 81502067, 81302082, 81272685, 31301151, 81172355, 31471340, 31470957, 81472264 and 81401957), National Key R&D Program of China (grants 2020YFA0803704), Tianjin Science Foundation for Distinguished Young Scholars (grants 19JCJQJC63100); by the NIH grant R01CA233844 (to Shengyu Yang).
Footnotes
Competing Interests: No potential conflicts of interest were disclosed.
References
- 1.Siegel RL, Miller KD, Fuchs HE, et al. Cancer Statistics, 2021. CA Cancer J Clin 2021;71:7–33. [DOI] [PubMed] [Google Scholar]
- 2.Mazur PK, Siveke JT. Genetically engineered mouse models of pancreatic cancer: unravelling tumour biology and progressing translational oncology. Gut 2012;61:1488–500. [DOI] [PubMed] [Google Scholar]
- 3.Uhlen M, Zhang C, Lee S, et al. A pathology atlas of the human cancer transcriptome. Science 2017;357. [DOI] [PubMed] [Google Scholar]
- 4.Feig C, Gopinathan A, Neesse A, et al. The pancreas cancer microenvironment. Clin Cancer Res 2012;18:4266–76. [DOI] [PMC free article] [PubMed] [Google Scholar]
- 5.Warburg O. On respiratory impairment in cancer cells. Science 1956;124:269–70. [PubMed] [Google Scholar]
- 6.Hanahan D, Weinberg RA. Hallmarks of cancer: the next generation. Cell 2011;144:646–74. [DOI] [PubMed] [Google Scholar]
- 7.Luo J, Manning BD, Cantley LC. Targeting the PI3K-Akt pathway in human cancer: rationale and promise. Cancer Cell 2003;4:257–62. [DOI] [PubMed] [Google Scholar]
- 8.Ying H, Kimmelman AC, Lyssiotis CA, et al. Oncogenic Kras maintains pancreatic tumors through regulation of anabolic glucose metabolism. Cell 2012;149:656–70. [DOI] [PMC free article] [PubMed] [Google Scholar]
- 9.Li L, Liang Y, Kang L, et al. Transcriptional Regulation of the Warburg Effect in Cancer by SIX1. Cancer Cell 2018;33:368–385 e7. [DOI] [PubMed] [Google Scholar]
- 10.Holcik M, Sonenberg N. Translational control in stress and apoptosis. Nat Rev Mol Cell Biol 2005;6:318–27. [DOI] [PubMed] [Google Scholar]
- 11.Silvera D, Formenti SC, Schneider RJ. Translational control in cancer. Nat Rev Cancer 2010;10:254–66. [DOI] [PubMed] [Google Scholar]
- 12.Baird TD, Wek RC. Eukaryotic initiation factor 2 phosphorylation and translational control in metabolism. Adv Nutr 2012;3:307–21. [DOI] [PMC free article] [PubMed] [Google Scholar]
- 13.Wek RC. Role of eIF2alpha Kinases in Translational Control and Adaptation to Cellular Stress. Cold Spring Harb Perspect Biol 2018;10. [DOI] [PMC free article] [PubMed] [Google Scholar]
- 14.Leprivier G, Rotblat B, Khan D, et al. Stress-mediated translational control in cancer cells. Biochim Biophys Acta 2015;1849:845–60. [DOI] [PubMed] [Google Scholar]
- 15.Lin JC, Hsu M, Tarn WY. Cell stress modulates the function of splicing regulatory protein RBM4 in translation control. Proc Natl Acad Sci U S A 2007;104:2235–40. [DOI] [PMC free article] [PubMed] [Google Scholar]
- 16.Dobbyn HC, Hill K, Hamilton TL, et al. Regulation of BAG-1 IRES-mediated translation following chemotoxic stress. Oncogene 2008;27:1167–74. [DOI] [PMC free article] [PubMed] [Google Scholar]
- 17.Yu M, Sha H, Gao Y, et al. Alternative 3’ UTR polyadenylation of Bzw1 transcripts display differential translation efficiency and tissue-specific expression. Biochem Biophys Res Commun 2006;345:479–85. [DOI] [PubMed] [Google Scholar]
- 18.Li S, Chai Z, Li Y, et al. BZW1, a novel proliferation regulator that promotes growth of salivary muocepodermoid carcinoma. Cancer Lett 2009;284:86–94. [DOI] [PubMed] [Google Scholar]
- 19.Chiou J, Chang YC, Jan YH, et al. Overexpression of BZW1 is an independent poor prognosis marker and its down-regulation suppresses lung adenocarcinoma metastasis. Sci Rep 2019;9:14624. [DOI] [PMC free article] [PubMed] [Google Scholar]
- 20.Shi Z, Xiao C, Lin T, et al. BZW1 promotes cell proliferation in prostate cancer by regulating TGF-beta1/Smad pathway. Cell Cycle 2021;20:894–902. [DOI] [PMC free article] [PubMed] [Google Scholar]
- 21.Li Y, Wang X, Zhao Z, et al. LncRNA NEAT1 promotes glioma cancer progression via regulation of miR-98–5p/BZW1. Biosci Rep 2021;41. [DOI] [PMC free article] [PubMed] [Google Scholar]
- 22.Xu H, Sun X, Huang Y, et al. Long noncoding RNA NEAT1 modifies cell proliferation, colony formation, apoptosis, migration and invasion via the miR4500/BZW1 axis in ovarian cancer. Mol Med Rep 2020;22:3347–3357. [DOI] [PMC free article] [PubMed] [Google Scholar]
- 23.Kozel C, Thompson B, Hustak S, et al. Overexpression of eIF5 or its protein mimic 5MP perturbs eIF2 function and induces ATF4 translation through delayed re-initiation. Nucleic Acids Res 2016;44:8704–8713. [DOI] [PMC free article] [PubMed] [Google Scholar]
- 24.Tiriac H, Bucobo JC, Tzimas D, et al. Successful creation of pancreatic cancer organoids by means of EUS-guided fine-needle biopsy sampling for personalized cancer treatment. Gastrointest Endosc 2018;87:1474–1480. [DOI] [PMC free article] [PubMed] [Google Scholar]
- 25.Dang H, Takai A, Forgues M, et al. Oncogenic Activation of the RNA Binding Protein NELFE and MYC Signaling in Hepatocellular Carcinoma. Cancer Cell 2017;32:101–114 e8. [DOI] [PMC free article] [PubMed] [Google Scholar]
- 26.Yun J, Mullarky E, Lu C, et al. Vitamin C selectively kills KRAS and BRAF mutant colorectal cancer cells by targeting GAPDH. Science 2015;350:1391–6. [DOI] [PMC free article] [PubMed] [Google Scholar]
- 27.Zhong XY, Yuan XM, Xu YY, et al. CARM1 Methylates GAPDH to Regulate Glucose Metabolism and Is Suppressed in Liver Cancer. Cell Rep 2018;24:3207–3223. [DOI] [PubMed] [Google Scholar]
- 28.Seidler NW. Basic biology of GAPDH. Adv Exp Med Biol 2013;985:1–36. [DOI] [PubMed] [Google Scholar]
- 29.Miao P, Sheng S, Sun X, et al. Lactate dehydrogenase A in cancer: a promising target for diagnosis and therapy. IUBMB Life 2013;65:904–10. [DOI] [PubMed] [Google Scholar]
- 30.Ooi AT, Gomperts BN. Molecular Pathways: Targeting Cellular Energy Metabolism in Cancer via Inhibition of SLC2A1 and LDHA. Clin Cancer Res 2015;21:2440–4. [DOI] [PMC free article] [PubMed] [Google Scholar]
- 31.Zhao D, Zou SW, Liu Y, et al. Lysine-5 acetylation negatively regulates lactate dehydrogenase A and is decreased in pancreatic cancer. Cancer Cell 2013;23:464–76. [DOI] [PMC free article] [PubMed] [Google Scholar]
- 32.Arroyo JD, Jourdain AA, Calvo SE, et al. A Genome-wide CRISPR Death Screen Identifies Genes Essential for Oxidative Phosphorylation. Cell Metab 2016;24:875–885. [DOI] [PMC free article] [PubMed] [Google Scholar]
- 33.Shares BH, Busch M, White N, et al. Active mitochondria support osteogenic differentiation by stimulating beta-catenin acetylation. J Biol Chem 2018;293:16019–16027. [DOI] [PMC free article] [PubMed] [Google Scholar]
- 34.Xiang S, Gu H, Jin L, et al. LncRNA IDH1-AS1 links the functions of c-Myc and HIF1alpha via IDH1 to regulate the Warburg effect. Proc Natl Acad Sci U S A 2018;115:E1465–E1474. [DOI] [PMC free article] [PubMed] [Google Scholar]
- 35.Shukla SK, Purohit V, Mehla K, et al. MUC1 and HIF-1alpha Signaling Crosstalk Induces Anabolic Glucose Metabolism to Impart Gemcitabine Resistance to Pancreatic Cancer. Cancer Cell 2017;32:392. [DOI] [PubMed] [Google Scholar]
- 36.Gao G, Dhar S, Bedford MT. PRMT5 regulates IRES-dependent translation via methylation of hnRNP A1. Nucleic Acids Res 2017;45:4359–4369. [DOI] [PMC free article] [PubMed] [Google Scholar]
- 37.Bond S, Lopez-Lloreda C, Gannon PJ, et al. The Integrated Stress Response and Phosphorylated Eukaryotic Initiation Factor 2alpha in Neurodegeneration. J Neuropathol Exp Neurol 2020;79:123–143. [DOI] [PMC free article] [PubMed] [Google Scholar]
- 38.Starck SR, Tsai JC, Chen K, et al. Translation from the 5’ untranslated region shapes the integrated stress response. Science 2016;351:aad3867. [DOI] [PMC free article] [PubMed] [Google Scholar]
- 39.Hiraishi H, Oatman J, Haller SL, et al. Essential role of eIF5-mimic protein in animal development is linked to control of ATF4 expression. Nucleic Acids Res 2014;42:10321–30. [DOI] [PMC free article] [PubMed] [Google Scholar]
- 40.Boyce M, Bryant KF, Jousse C, et al. A selective inhibitor of eIF2alpha dephosphorylation protects cells from ER stress. Science 2005;307:935–9. [DOI] [PubMed] [Google Scholar]
- 41.Ohri SS, Mullins A, Hetman M, et al. Inhibition of GADD34, the stress-inducible regulatory subunit of the endoplasmic reticulum stress response, does not enhance functional recovery after spinal cord injury. PLoS One 2014;9:e109703. [DOI] [PMC free article] [PubMed] [Google Scholar]
- 42.Buscail L, Bournet B, Cordelier P. Role of oncogenic KRAS in the diagnosis, prognosis and treatment of pancreatic cancer. Nat Rev Gastroenterol Hepatol 2020;17:153–168. [DOI] [PubMed] [Google Scholar]
- 43.Marciniak SJ, Garcia-Bonilla L, Hu J, et al. Activation-dependent substrate recruitment by the eukaryotic translation initiation factor 2 kinase PERK. J Cell Biol 2006;172:201–9. [DOI] [PMC free article] [PubMed] [Google Scholar]
- 44.Ron D. Translational control in the endoplasmic reticulum stress response. J Clin Invest 2002;110:1383–8. [DOI] [PMC free article] [PubMed] [Google Scholar]
- 45.Harding HP, Zhang Y, Ron D. Protein translation and folding are coupled by an endoplasmic-reticulum-resident kinase. Nature 1999;397:271–4. [DOI] [PubMed] [Google Scholar]
- 46.Axten JM, Medina JR, Feng Y, et al. Discovery of 7-methyl-5-(1-{[3-(trifluoromethyl)phenyl]acetyl}−2,3-dihydro-1H-indol-5-yl)-7H-p yrrolo[2,3-d]pyrimidin-4-amine (GSK2606414), a potent and selective first-in-class inhibitor of protein kinase R (PKR)-like endoplasmic reticulum kinase (PERK). J Med Chem 2012;55:7193–207. [DOI] [PubMed] [Google Scholar]
- 47.Sidrauski C, Acosta-Alvear D, Khoutorsky A, et al. Pharmacological brake-release of mRNA translation enhances cognitive memory. Elife 2013;2:e00498. [DOI] [PMC free article] [PubMed] [Google Scholar]
- 48.Sidrauski C, McGeachy AM, Ingolia NT, et al. The small molecule ISRIB reverses the effects of eIF2alpha phosphorylation on translation and stress granule assembly. Elife 2015;4. [DOI] [PMC free article] [PubMed] [Google Scholar]
- 49.Hsieh AL, Walton ZE, Altman BJ, et al. MYC and metabolism on the path to cancer. Semin Cell Dev Biol 2015;43:11–21. [DOI] [PMC free article] [PubMed] [Google Scholar]
- 50.Mitra P, Vaughan PS, Stein JL, et al. Purification and functional analysis of a novel leucine-zipper/nucleotide-fold protein, BZAP45, stimulating cell cycle regulated histone H4 gene transcription. Biochemistry 2001;40:10693–9. [DOI] [PubMed] [Google Scholar]
- 51.Gerlitz G, Jagus R, Elroy-Stein O. Phosphorylation of initiation factor-2 alpha is required for activation of internal translation initiation during cell differentiation. Eur J Biochem 2002;269:2810–9. [DOI] [PubMed] [Google Scholar]
- 52.Fernandez J, Yaman I, Sarnow P, et al. Regulation of internal ribosomal entry site-mediated translation by phosphorylation of the translation initiation factor eIF2alpha. J Biol Chem 2002;277:19198–205. [DOI] [PubMed] [Google Scholar]
- 53.Hu Z, Xia B, Postnikoff SD, et al. Ssd1 and Gcn2 suppress global translation efficiency in replicatively aged yeast while their activation extends lifespan. Elife 2018;7. [DOI] [PMC free article] [PubMed] [Google Scholar]
- 54.Chambers JE, Dalton LE, Clarke HJ, et al. Actin dynamics tune the integrated stress response by regulating eukaryotic initiation factor 2alpha dephosphorylation. Elife 2015;4. [DOI] [PMC free article] [PubMed] [Google Scholar]
Associated Data
This section collects any data citations, data availability statements, or supplementary materials included in this article.