PLOS ONE logoLink to PLOS ONE
. 2022 Sep 1;17(9):e0273451. doi: 10.1371/journal.pone.0273451

Loaded inter-set stretch may selectively enhance muscular adaptations of the plantar flexors

Derrick W Van Every 1, Max Coleman 1, Avery Rosa 1, Hugo Zambrano 1, Daniel Plotkin 1, Xavier Torres 1, Mariella Mercado 1, Eduardo O De Souza 2, Andrew Alto 1, Douglas J Oberlin 1, Andrew D Vigotsky 3, Brad J Schoenfeld 1,*
Editor: Stephen E Alway4
PMCID: PMC9436038  PMID: 36048793

Abstract

The purpose of this study was to evaluate differences in changes in muscle strength and muscle thickness (MT) of the plantar flexor muscles between traditional resistance training (RT) involving passive rest and RT combined with inter-set stretch in the calf raise exercise. Employing a within-subject design, 21 young, healthy men performed plantar flexion exercises twice per week in both a traditional RT (TRAD) format and combined with a 20-second inter-set stretch (STRETCH). One leg was randomly assigned to the TRAD condition and the contralateral leg performed the STRETCH condition throughout the 8-week study period. Dependent variables included MT of the lateral gastrocnemius (LG), medial gastrocnemius (MG) and the soleus (SOL), and isometric strength of the plantar flexors. Results indicated a potential beneficial hypertrophic effect of STRETCH compared to TRAD for the SOL [0.7 mm, CI90% = (0, 1.6)], while the LG had more ambiguous effects [0.4 mm (−0.4, 1.3)] and MG effects were equivocal [0 mm (−0.6, 0.7)]. In general, LG demonstrated greater standardized growth [z = 1.1 (1, 1.3)] as compared to MG [z = 0.3 (0.2, 0.5)] and SOL [z = 0.3 (0.2, 0.5)]. Measures of isometric strength showed a modest advantage to STRETCH. In conclusion, loaded inter-set stretch may enhance MT of the soleus but effects on the gastrocnemii appear uncertain or unlikely in untrained men; plantar flexor strength appears to be modestly enhanced by the interventional strategy.

Introduction

Stretching a muscle under loaded conditions promotes significant muscular adaptations in animal models when applied consistently over time. Notably, seminal research in quails found muscle mass increases of >50% in the anterior latissimus dorsi after just several weeks of loaded stretch [13]. However, these protocols involve extreme interventions whereby a Velcro tube filled with lead pellets is wrapped around the birds’ stretched wings for days on end. Thus, findings cannot necessarily be extrapolated to humans performing traditional stretching protocols, which generally include brief bouts of stretching held for 15 to 30 seconds [4].

A recent human trial reported that 6-weeks of isolated loaded stretch of the plantar flexors produced significant increases in muscle thickness (MT) [5]. It has been speculated that stretching between sets of resistance exercise may enhance human muscle hypertrophy over and above that achieved with traditional resistance training (RT) or isolated stretching alone [6]. In support of this hypothesis, Evangelista et al. [7] found a potential hypertrophic benefit to performing 30 seconds of static stretching versus passive rest between sets during regimented RT in untrained individuals. Although these results are intriguing, it should be noted that the stretch was unloaded; hence, whether adding resistance to the stretch would have enhanced results remains underdetermined. In this regard, Silva et al. [8] reported markedly greater increases in muscle thickness favoring a group of resistance trained individuals that performed loaded inter-set stretch of the calf muscles compared to a group that rested passively; however, findings were presented as a conference abstract and never published in a peer-reviewed journal, thus precluding the ability to scrutinize methods and results. If these results can be corroborated, loaded stretch would provide practitioners with an intriguing strategy to enhance muscular adaptations in a time-efficient manner.

To our knowledge, only one published study has endeavored to compare the effects of RT involving passive inter-set rest vs. RT that included a loaded stretch protocol between sets. Wadhi et al. [9] randomized resistance-trained men to perform bench press exercises with either a 30-second loaded stretch between sets or a passive inter-set rest. Training was carried out twice per week for 8 weeks. Results showed similar increases in muscle thickness of the pectoralis major between conditions. It should be noted that the inter-set stretch was performed with 15% of their working load from the prior set on a different exercise (cable fly), which may not have imposed a sufficient stimulus to augment hypertrophy. Moreover, given the preliminary findings of Silva et al. [8], it is possible that loaded stretch may confer differential effects on muscular adaptations between the upper and lower body musculature, or perhaps muscles of different architectures and fiber type composition.

Given the paucity of research and contradictory findings on the topic, we aimed to evaluate changes in muscle strength and MT of the calf muscles between traditional RT involving passive rest and RT combined with inter-set stretch in plantar flexion exercises. A secondary aim was to determine if the inclusion of an inter-set stretch has differential effects on MT of the individual plantar flexors (i.e., soleus versus gastrocnemii). We hypothesized that muscular adaptations would be greater in the limb performing RT combined with inter-set stretch [10], and that the lateral gastrocnemius would experience greater MT than the other plantar flexors [11].

Materials and methods

Participants

Twenty-five healthy, untrained but recreationally active males from a university population (height: 175.1 ± 7.0 cm; weight: 80.4 ± 19.6 kg; age: 20.8 ± 6.1 yrs; body fat: 22.7 ± 10.5%) volunteered to participate in this study. Participants had not performed regimented lower-body RT for at least 6 months prior to participation, although some reported limited previous RT experience. The sample size was justified by a priori precision analysis for the minimum detectable change at the 90% level (MDC90%) for medial gastrocnemius thickness (i.e., SEM × z0.05 × √2 = 0.7 mm), such that the compatibility interval (CI) of the between-group effect would be approximately ± MDC90%. Based on data from previous research [11], along with their sampling distributions, Monte Carlo simulation was used to generate 90% CI widths for 1000 random samples of each sample size. To ensure a conservative estimate, as literature values may not be extrapolatable, the sum of each simulated sample size’s 90% CI’s mean and SD was used, and the smallest sample that exceeded MDC90% was chosen; that is, 17 participants. To account for the possibility of attrition, we recruited 25 participants.

Participants were required to meet the following inclusion criteria: 1) between the ages of 18–35; 2) no existing musculoskeletal disorders, neuromuscular disorders, lower extremity pain, or prior traumatic injury to the triceps surae/Achilles complex; 3) self-reportedly free from consumption of anabolic steroids or any other legal or illegal agents known to increase muscle size for the previous year, and; 4) had not performed regimented RT for the lower body musculature in the past 6 months.

The study employed an individually randomized within-subject design where each participant performed both traditional RT (TRAD) and RT combined with inter-set stretch (STRETCH) for the plantar flexors. One leg was randomly assigned to the TRAD condition and the contralateral leg performed the STRETCH condition throughout the study period. A within-participant design allows for increased precision of effect estimation, especially with the high pre-post measurement correlations that are observed in muscle thickness studies [12]. Random allocation as to which limb received which stimulus was carried out using block randomization, with two participants per block, in R [13]. Approval for the study was obtained from the university Institutional Review Board. Written informed consent was obtained from all participants prior to beginning the study. All training was carried out in the college fitness center and testing was performed in a laboratory setting. The methods for this study were preregistered prior to recruitment (https://osf.io/mtw6q).

Resistance training procedures

To ensure involvement of the entire triceps surae musculature [14], the RT protocol consisted of the seated and straight-leg calf raise exercises, performed for 2 weekly sessions on non-consecutive days. The seated calf raise was carried out on a plate-loaded unit (Body Masters, Rayne, LA) and the straight-leg calf raise was carried out on a leg press machine (Life Fitness, Franklin Park, IL). Training times within each participant were consistent across the duration of the study but varied between participants to allow the protocol to fit within each participant’s schedule. A one-week familiarization period was provided prior to the study whereby participants performed these exercises unilaterally over 3 non-consecutive days using their bodyweight and the raw weight of the machine for 3 sets of 5, 10, and 15 repetitions per set on Days 1, 2, and 3, respectively. This was done to promote a repeated bout effect and thus help prevent excessive muscle soreness from interfering with training during the early stages of the training phase [15].

Prior to the training phase, all participants underwent repetition maximum (RM) testing for their 10RM on both the seated and straight-leg calf exercises to determine individual initial training loads. The RM testing was consistent with recognized guidelines as established by the National Strength and Conditioning Association [16]. Thereafter, participants engaged in 8 weeks of intensive training of the plantar flexors, during which the two interventions were provided concurrently. To minimize any potential confounding effects from exercise order, TRAD was performed first in Session 1, STRETCH was performed first in Session 2, and then the conditions continued alternating in this fashion for the duration of the study period.

Participants performed 4 sets per exercise per session with 2-minutes of rest afforded between sets and ~3 minutes of rest afforded between exercises. For STRETCH, participants descended into a loaded stretch immediately following completion of each set using the same load employed during the set. The stretch was held for 20 seconds, and then subjects rested passively for the remaining duration of the rest interval (i.e., a total of 100 seconds rest between each set). Alternatively, TRAD rested passively throughout the duration of each rest interval. Thus, the total time between sets remained identical for each condition. Sets were carried out to the point of momentary concentric muscular failure—herein defined as the inability to perform another concentric repetition while maintaining proper form—with a target repetition range of 8 to 12RM. The load was adjusted for each exercise as needed on successive sets to ensure that participants achieved failure within the target repetition range. Cadence of repetitions was carried out with a ~1 second concentric action and a ~2-second eccentric action. All routines were directly supervised by research assistants experienced with RT to ensure proper performance of the respective routines. Loads were progressively increased each week within the confines of maintaining the target repetition range for each condition. Participants were instructed to refrain from performing any additional resistance-type lower body training for the duration of the study. A timeline of the study is displayed in Fig 1.

Fig 1. Study timeline.

Fig 1

After being accepted into the study, all participants went through a 1-week acclimation phase. Thereafter, the limbs of participants were randomized to their respective conditions and underwent preintervention testing. The intervention lasted 8 weeks, after which participants underwent postintervention testing.

Measurements

Anthropometry

Baseline anthropometric data were collected on the initial visit to the laboratory. Participants were instructed to refrain from eating for at least 8 hours prior to testing, eliminate alcohol consumption for 24 hours, abstain from strenuous exercise for 24 hours, and void immediately before the test. Participants’ height was measured to the nearest 0.1 cm using a stadiometer; weight was assessed to the nearest 0.1 kg on a calibrated scale (InBody 770; Biospace Co. Ltd., Seoul, Korea).

Muscle thickness

Ultrasound imaging was used to obtain measurements of muscle thickness (MT) of the medial gastrocnemius (MG), lateral gastrocnemius (LG), and soleus (SOL) with participants lying prone and ankles maintained in neutral position. A trained sonographer performed all testing using a B-mode ultrasound imaging unit (Sonoscape E1; Shenzhen, China). The technician, who was blinded to limb allocation, applied a water-soluble transmission gel (Aquasonic 100 Ultrasound Transmission gel, Parker Laboratories Inc., Fairfield, NJ) to each measurement site, and a 4–10 MHz ultrasound probe was placed perpendicular to the tissue interface without depressing the skin. Measurements for each respective site were taken with a tape measure on the posterior surface of both legs at 30% of the lower leg length (the distance from the articular cleft between the femur and tibia condyles to the lateral malleolus) on the medial and lateral sides, which were marked with a felt-tip pen to ensure consistency of measures. When the quality of the image was deemed to be satisfactory, the technician saved the image to hard drive and obtained MT dimensions for the MG, LG, and SOL using the machine’s calculation package. Fig 2 displays an example of an ultrasound image obtained from one of the participants.

Fig 2. Example of an ultrasound image: A representative image illustrating the measurement of muscle thickness.

Fig 2

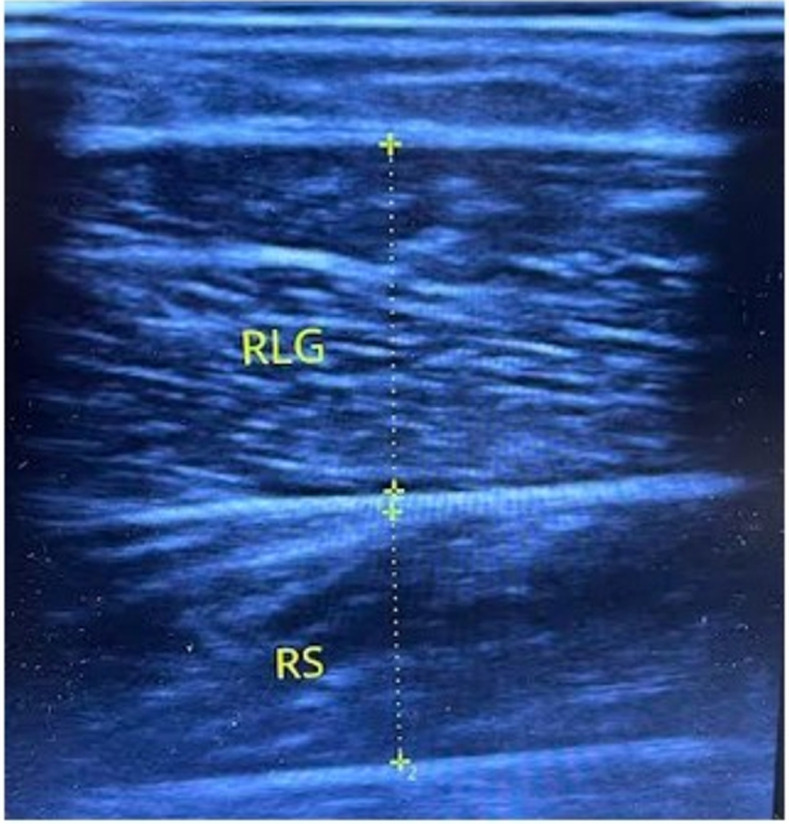
Muscle thickness of the MG and LG was determined as the distance from the superficial to deep aponeuroses that borders the SOL. The SOL was measured from the upper and lower aponeuroses separating the muscle. In an effort to ensure that swelling in the muscles from training did not confound results, images were obtained ≥48 hours after the acclimation phase, as well as ≥ 48 hours after the final training session. This is consistent with research showing that acute increases in MT return to baseline within 48 hours following a RT session [17] and that muscle damage is minimal after repeated exposure to the same exercise stimulus over time [18]. To further ensure accuracy of measurements, 3 images were obtained for each site and their averages were used as the final value for MT. The intraclass correlation coefficients (ICC) from our lab for the MG, LG, and SOL are 0.990, 0.993, and 0.990, with corresponding standard errors of the measurement (SEM) of 0.44, 0.58 and 0.82 mm, respectively.

Maximal strength assessments

Muscle strength

To test isometric ankle plantar flexion strength, each participant was secured in a dynamometer (Biodex Isokinetic Dynamometer System 4 Pro, Shirley, NY) with their hips positioned to 85° flexion and testing ankle to 90° (i.e., foot 90° relative to the tibia). Participants were instructed to extend their leg as forcefully as possible against the machine pad and were then given a practice trial prior to testing for acclimation with the test. Testing was performed with two different knee-joint positions: full extension (0°) and 90° flexion. Knee extension facilitates force production from the LG and MG, in addition to the SOL. Conversely, knee flexion helps to isolate the SOL by placing the LG and MG under active insufficiency [19]; therefore, the difference in net joint moments between the two conditions can be considered the contribution from the gastrocnemii. Each trial consisted of a maximum voluntary isometric effort, which lasted for 5 seconds, and was followed by a 30-second rest interval. A total of 4 trials were performed for each knee-joint position. Participants were verbally encouraged throughout each trial and were allowed to view the screen for biofeedback and increased performance [20]. The highest peak net joint moment from each of the 4 trials for each position was used for analysis. The ICCs from our lab for the isometric plantar flexion strength test with legs straight and in 90° flexion are 0.776 and 0.809, with corresponding SEMs of 12.4 and 20.0 N⋅m, respectively.

Statistical analyses

To assess the differential effects of TRAD versus STRETCH, all data were analyzed in R (version 4.1.1), in which hierarchical linear models (HLM) were constructed [13, 21]. HLMs are similar to linear mixed-effects models, with which readers may be more familiar, but are conceptualized differently since specified in terms of “levels.” HLMs or mixed-effects models are indicated here because of our within-participant design. A single model was constructed to obtain two effects, which followed the form:

Level1postij=β0j+β1j(preij)+β2j(interventionij)+ϵijLevel2βoj=γ00+r0jβ1j=γ10β2j=γ20

for participant i and limb j, where level 1 is hypertrophy (within-participant), level 2 is between-participant, and β2j is the effect of interest, which is the estimate of the differential effect of the intervention on a muscle (e.g., on the medial gastrocnemius). This was estimated separately for MG, LG, and SOL. interventionij was dummy-coded 0 for TRAD and 1 for STRETCH; preij was group mean- (i.e., participant mean-) centered. From a linear mixed-effects modeling perspective, this is simply a model with random intercepts for each participant.

Secondary analyses were carried out to assess within-position strength adaptations. For each analysis, post-intervention score was the dependent variable, intervention (i.e., STRETCH or TRAD) was the independent variable, pre-intervention scores were a covariate, and there were varied intercepts for each participant so that all analyses are within-participant, such that the hierarchical linear model took the following form:

Level1postij=β0j+β1j(preij)+β2j(interventionij)+ϵijLevel2βoj=γ00+r0jβ1j=γ10β2j=γ20

where level 1 is strength or hypertrophy (within-participant), level 2 is between-participant, and β2j is the effect of interest.

Finally, we explored the differences in muscle growth between the muscles by z-scoring each muscle using its pre-intervention scores, and we used these in the hierarchical linear model with muscle interactions,

Level1postijzpreijz=β0j+β1j(preijz)+β2j(interventionij)+β3j(MGij)+β4j(LGij)+β5j(MGijpreijz)+β6j(LGijpreijz)+β7j(MGijinterventionij)+β8j(LGijinterventionij)+ϵijLevel2βoj=γ00+r0jβ[18]j=γ[18]0.

Estimated marginal means were used to obtain the standardized baseline-adjusted change scores, their contrasts, and the 90% CIs using Kenward-Roger degrees of freedom [22]. This model was not pre-registered, but rather was post hoc and used to help contextualize our findings.

For all analyses, the bootstrap was used to obtain bias-corrected and accelerated 90% compatibility intervals (CI) of the point estimate of each effect. We analyzed data per-protocol rather than intention-to-treat since we were interested in the effect of the intervention rather than its prescription. Finally, to avoid dichotomous interpretations of the results, no a priori α-level was set. Rather than interpreting effects from a single test, or set of tests, the results were interpreted on a continuum using all statistical outcomes, in combination with theory and practical considerations [23, 24].

Results and discussion

Of the 25 participants that initially volunteered for participation, 4 dropped out of the study for the following reasons: non-compliance (n = 2), injury unrelated to the study (n = 1), and non-musculoskeletal adverse event experienced during the study (n = 1). Thus, 21 participants completed the entire study protocol, which indicates good statistical precision based on our a priori precision analysis. All participants attended >90% of the RT sessions. Fig 3 displays a CONSORT diagram of the data collection process.

Fig 3. Consort diagram.

Fig 3

Flow chart illustrating the data collection process.

Effect of inter-set stretching on muscle thickness

The LG and SOL had modest estimated effects of STRETCH relative to TRAD, with point estimates of 0.4 mm and 0.7 mm, respectively. However, we observed variability associated with these estimates. For the LG, our data are compatible with values ranging from −0.4 mm (favoring TRAD) to 1.3 mm (favoring STRETCH). For the SOL, our data are compatible with values ranging from 0 to 1.6 mm (favoring STRETCH). In contrast, results for the MG were equivocal—our point estimate was zero and the data were compatible with estimates ranging from −0.6 mm (favoring TRAD) to 0.7 mm (favoring STRETCH) (Table 1 and Fig 4A).

Table 1. Muscle size and strength outcomes.

Traditional (mean ± SD) Stretch (mean ± SD) Between-condition effect estimate (CI90%)
Pre Post Pre Post
Lateral Gastrocnemius (mm) 14.7 ± 3.1 17.7 ± 4.0 14.9 ± 2.2 18.2 ± 3.9 0.4 (−0.4, 1.3)
Medial Gastrocnemius (mm) 18.8 ± 3.1 19.9 ± 3.5 19.0 ± 3.8 20.2 ± 3.7 0 (−0.6, 0.7)
Soleus (mm) 17.0 ± 3.2 17.6 ± 3.2 17.3 ± 3.0 18.5 ± 3.9 0.7 (0, 1.6)
Knee flexed isometric plantar flexion (N⋅m) 126 ± 46 148 ± 37 122 ± 42 155 ± 43 6 (0, 10)
Knee extended isometric plantar flexion (N⋅m) 128 ± 44 161 ± 37 132 ± 34 169 ± 39 7 (0, 20)

Fig 4. Model-adjusted individual outcomes for hypertrophy and strength in the traditional (TRAD) and stretch (STRETCH) conditions.

Fig 4

Each data point represents an individual’s model-predicted outcome for the TRAD (x-axis) and STRETCH (y-axis) conditions. The black, diagonal line is the identity line; a data point on the line indicates an identical expected outcome in TRAD and STRETCH for that individual. (A) Model-adjusted post-intervention outcomes in muscle thickness (mm). (B) Model-adjusted post-intervention outcomes in isometric plantar flexion strength (N⋅m). Individual lines (translucent) were demeaned within each participant and then summed with the grand mean for that exercise to stress the variability in trends rather than intercepts. Bold, opaque lines depict LOESS curves fit to the entire sample. LG = lateral gastrocnemius; MG = medial gastrocnemius; SOL = soleus; EXT = knee extended; FLEX = knee flexed.

Between-muscle growth

We z-scored each muscle to compare growth between muscles. Marginalizing over condition, LG demonstrated greater growth than MG [z = 0.8 (0.6, 1)] and SOL [z = 0.8 (0.6, 1)], and the difference between MG and SOL was equivocal with appreciable variance [MG minus SOL: z = 0 (−0.2,0.3)]. Marginally, LG growth was z = 1.1 (1, 1.3), while MG and SOL were both z = 0.3 (0.2, 0.5). Differential effects of the intervention were estimated to be small but with poor precision [SOL minus MG: z = 0.2 (−0.3, 0.7); SOL minus LG: z = 0.1 (−0.4, 0.6); MG minus LG: −0.1 (−0.6, 0.4)].

Effect of inter-set stretching on isometric plantar flexion strength

Point estimates indicated that isometric plantar flexion strength increases modestly favored STRETCH relative to TRAD. However, CIs indicate the data were also compatible with negligible (~0) to potentially meaningful effects (≳10% of the baseline strength) (Table 1 and Fig 4B).

Our study produced several novel findings that help to fill important gaps in the current literature on the strength- and hypertrophy-related effects of loaded inter-set stretch. Below we discuss these findings in the context of available evidence, as well as speculating on their implications for exercise prescription.

Muscle growth between conditions

Multiple lines of evidence indicate that stretch training may elicit increases in muscle mass. Notably, research in animal models shows marked hypertrophy following relatively brief longitudinal periods of passive [25] and loaded stretch [13]. Moreover, high volume static stretching has been shown to elicit growth of the gastrocnemii in both passive [26] and loaded [5] conditions. Some evidence suggests that integrating stretch training into RT protocols can enhance muscle development. Evangelista et al. [7] found that the summed increases in MT for muscles of the upper and lower limbs were greater for a group of untrained individuals who performed a 30-second inter-set unloaded static stretching regimen versus a group that rested passively between sets (10.5% vs 6.7%, respectively). A conference abstract by Silva et al. [8] reported that the inclusion of a 30-second loaded stretch between sets of the straight-leg calf raise exercise produced a greater than two-fold absolute mean increase in MT compared to performing sets with passive inter-set rest periods (2.3 vs. 0.9 mm, respectively) in resistance-trained individuals. Alternatively, Wadhi et al. [9] reported that the inclusion of a 30-second loaded stretch between sets of bench press exercise did not enhance MT of the pectoralis major in resistance-trained men.

Our findings add to the body of literature on the topic, providing further insights into the potential effects of loaded inter-set stretch on muscle growth. Contrary to the findings of Silva et al. [8], we did not observe appreciable, consistent hypertrophic benefits to loaded stretch for the gastrocnemii. The MG point estimate was zero with a 90% CI that did not include appreciable effects; however, although the LG had a modest point estimate, its CI encapsulated effects ranging from relatively small negative effects to appreciable positive effects for STRETCH. The study by Silva et al. [8] was presented as a conference abstract and never published in a peer-reviewed journal, precluding our ability to reconcile discrepancies between studies. Likewise, our findings for the gastrocnemii complement those of Wadhi et al. [9], who found no benefit to loaded inter-set stretch on MT of the pectoralis major.

In contrast to the gastrocnemius, our results suggest that the addition of loaded inter-set stretch in RT protocols may modestly enhance MT of the SOL. The 90% CIs around the point estimate ranged from a negligible effect to a large positive effect favoring STRETCH (0, 1.6 mm), suggesting a potentially meaningful benefit to the inclusion of loaded inter-set stretch during plantar flexion for the SOL. Although speculative, the greater time-under-tension (TUT) for STRETCH may help to explain differences between adaptations of the individual plantar flexors. Specifically, the SOL was placed under stretch for a longer duration since the gastrocnemii were actively insufficient during the seated calf raise. This may have resulted in the seated stretch preferentially targeting the SOL relative to the gastrocnemii. If the SOL’s outcome can be attributed to its greater TUT, there may exist a stretch stimulus dose-response relationship that remains to be specifically investigated.

In addition to the differences in TUT owing to the uni- vs biarticular nature of the SOL and gastrocnemii, the muscles of the triceps surae also differ in other dimensions. The SOL is a tonic muscle composed predominantly of slow-twitch fibers (>80%) whereas the gastrocnemii have a relatively similar composition of both type I and type II fibers [27]. Intriguingly, research in avian models demonstrates that loaded stretch elicits greater hypertrophy in the predominantly slow-twitch latissimus dorsi compared to the patagialis, which contains a high percentage of fast-twitch fibers [28]. Whether this indicates that type I fibers are more anabolically responsive to higher TUTs compared to type II fibers or perhaps that they may have additional inherent properties predisposed to loaded stretch following performance of eccentric actions [29], such as differences in muscle architecture and geometry, remains undetermined and warrants further investigation. In particular, the SOL and gastrocnemii possess different architectural features: the SOL has shorter fibers and a shorter subtendon; the gastrocnemii have longer fibers and a longer subtendon; and the LG has a thicker subtendon than the SOL [30, 31]. These architectural features affect fiber strain and thus force production in each of the three muscles. Along these same lines, the SOL is a complex muscle with multiple, mechanically distinct compartments [32], meaning our results may not reflect hypertrophy of the whole muscle. It should be noted that the point estimate for MT of the SOL was within the SEM and results therefore should be interpreted with a degree of caution.

Muscle growth between the plantar flexors

All of the plantar flexors analyzed showed increases in MT irrespective of the interventional condition, indicating that these muscles respond relatively well from a hypertrophy standpoint in untrained individuals. Consistent with prior research [11], the LG displayed markedly greater increases in MT compared to the MG and SOL. As previously speculated [11], the superior growth of the LG may be explained by the fact that the LG has greater fast-twitch properties compared to the other calf muscles [27], which possibly indicates a greater growth capacity [33]. Moreover, the LG is less active than the MG during standing balance and ambulation owing to its greater recruitment threshold [34, 35], suggesting it may be underutilized in novice trainees and thus have a greater hypertrophic potential during the early stages of regimented RT.

Given evidence that type II fibers have a greater growth capacity than type I fibers [33], it stands to reason that hypertrophy of the MG, a mixed-fiber muscle [27], would be superior to that of the SOL, a slow-twitch dominant muscle [27]. In support of this hypothesis, research indicates an attenuation of intracellular anabolic signaling and muscle protein synthesis in the SOL compared to muscles with inherently faster twitch properties [36, 37], as well as rodent data showing blunted hypertrophy of the SOL after synergist ablation [38, 39]. Contrarily, recent longitudinal human data found that MT increased similarly in the MG and SOL over an 8-week RT program targeting the plantar flexors [11]. The present study showed similar MT increases between the SOL and MG when results were pooled across conditions (z = 0.3 for both muscles). However, when considering the individual changes in MT between STRETCH and TRAD for the SOL (6.9% vs 3.5%, respectively), our findings indicate a blunted hypertrophic response for this muscle compared to the MG when performing sets in a traditional configuration; alternatively, the inclusion of inter-set stretch equalizes adaptations between the two muscles. Further mechanistic work is recommended to better understand hypertrophic adaptations of the individual human plantar flexors when subjected to RT.

Muscle strength between conditions

We observed robust increases in measures of isometric muscle strength, both when assessed with the legs straight (pooled effect = 27.3%) and flexed at 90° (pooled effect = 20.2%). The point estimates modestly favored STRETCH, and the upper CI indicate the effect may be potentially meaningful; differences were somewhat more pronounced when assessing strength in a straight-leg position. The between-condition point estimates were within the SEM for both measures; thus, some caution is warranted when drawing evidence-based conclusions from these data. Our results expand on those of Wadhi et al. [9] and Silva et al. [8], who found similar increases in 1RM in the bench press and calf raise, respectively, between protocols employing traditional set configurations and sets that integrated 30-second periods of loaded inter-set stretch. Of note, our stretch measures were obtained isometrically whereas previous research on the topic involved dynamic assessment, which may help to explain discrepancies between studies. Moreover, our study included untrained men whereas the studies of Wadhi et al. [9] and Silva et al. [8] involved trained individuals. When taken as a whole, current evidence suggests minimal to modest benefits of inter-set stretch when the goal is to optimize gains in muscular strength. But also, importantly, loaded inter-set stretch does not seem to compromise muscle strength development.

Of note, baseline strength assessment showed relatively equal net plantar flexion moments between the straight and flexed positions. This finding was somewhat surprising given that the gastrocnemius is rendered actively insufficient with the knee flexed, leaving the SOL to be responsible for a majority of the moment against an imposed resistance in this position [19]. We thus would have expected that participants would have generated greater net plantar flexion moments during testing in the straight position due to the combined involvement of the LG, MG and SOL about the ankle joint, as previously demonstrated by Vigotsky et al. [19]. Discrepancies between studies may be related to differences in the dynamometers used for assessment. Namely, the dynamometer employed in the study of Vigotsky et al. [19] (Neurobionics Rotary Dynamometer) maintained subjects in a seated position with the thighs immobilized during testing whereas our unit (Biodex System 4) did not allow for immobilization of the thighs for the flexed assessment. Hence, it is feasible that participants were situated in a position more conducive to generating plantar flexion moments while their knees were flexed.

Limitations

Our study had several limitations that must be considered when attempting to draw practical conclusions as to the implementation of loaded inter-set stretch in RT programs. First, participants were untrained young men; thus, results cannot necessarily be generalized to other populations including older individuals, women, and those with RT experience. Of note, our findings are somewhat in conflict with previous work that employed resistance-trained individuals [7, 8]; potential reasons for these discrepancies are not clear and require further investigation. Second, the experimental condition involved a 20-second stretch using the same absolute load within the confines of a 2-minute rest interval. Although anecdotally this stimulus seemed to impose a substantial challenge to the participants, it is unclear whether/how other configurations of stretch durations, rest interval lengths and/or magnitudes of load may influence results. Third, MT was measured at a single point along the length of the respective calf muscles; whether results may be different at other aspects of the plantar flexors remains undetermined. Fourth, muscle strength was assessed isometrically with a 90° ankle angle; results therefore cannot necessarily be extrapolated to different positions or dynamic conditions. Fifth, findings are specific to adaptations of the plantar flexors and cannot necessarily be generalized to other muscle groups. Sixth, training conditions were not necessarily the same for each participant/session, as training occurred in a commercial fitness setting, whereby research assistants were unable to control the surrounding environment during training sessions, which in turn may compromise internal validity [40]; alternatively, such conditions conceivably have a greater ecological validity than a laboratory setting and thus may provide greater insights into real-world responses. Finally, given that our study employed a within-subject design, we cannot rule out the possibility that strength-related adaptations were confounded by a cross-education effect [41]. However, it should be noted that evidentiary support for such an effect is confined to an untrained contralateral limb; it remains questionable whether cross-education occurs during longitudinal interventions where both limbs perform regimented RT. Cross-education seems to have negligible effects on hypertrophic adaptations [42], making it unlikely that the within-subject design had any influence on this outcome.

Conclusions

Our study suggests that loaded inter-set stretch may be an effective strategy to modestly enhance MT of the SOL in young, untrained men, with unlikely appreciable hypertrophic benefits to the gastrocnemii. Given that the SOL is generally considered less responsive to anabolism compared to other skeletal muscles [36, 37], the inclusion of inter-set stretch may warrant consideration in RT programs targeting the development of this muscle. Moreover, loaded inter-set stretch appears to modestly enhance strength gains in the plantar flexors. Importantly, beneficial effects were achieved without altering session duration, making the strategy a time-efficient option. Whether findings may be related to fiber type-specific differences between muscles requires further investigation.

It is pertinent to note that participants expressed varying levels of discomfort while holding the stretch in both straight- and bent-leg positions. Although we did not employ a perceptual assessment, anecdotally the discomfort was greater overall in STRETCH than TRAD across the study period. Thus, long-term adherence to the inclusion of loaded inter-set stretch in RT programs may be dependent on an individual’s ability to tolerate the heightened discomfort.

Acknowledgments

We are grateful for the help of the following research assistants in conducting data collection: Roberto Arias, Ericka Johnson, Benjiman Mendelovits and Francesca Augustin.

Data Availability

The data for this study are available from the OSF preregistration page (https://osf.io/mtw6q).

Funding Statement

This study was supported by a PSC CUNY grant from the State of New York received by BJS. Award # 63497-00 51. The funding agency played no role in study design, data collection, analysis, decision to publish, or preparation of the manuscript. There was no additional funding received for this study.

References

  • 1.Antonio J, Gonyea WJ. Muscle fiber splitting in stretch-enlarged avian muscle. Med Sci Sports Exerc 1994. August 01;26(8):973–977. [PubMed] [Google Scholar]
  • 2.Antonio J, Gonyea WJ. Role of muscle fiber hypertrophy and hyperplasia in intermittently stretched avian muscle. J Appl Physiol 1993. April 01;74(4):1893–1898. doi: 10.1152/jappl.1993.74.4.1893 [DOI] [PubMed] [Google Scholar]
  • 3.Antonio J, Gonyea WJ. Progressive stretch overload of skeletal muscle results in hypertrophy before hyperplasia. J Appl Physiol (1985) 1993. September 01;75(3):1263–1271. doi: 10.1152/jappl.1993.75.3.1263 [DOI] [PubMed] [Google Scholar]
  • 4.Page P. Current concepts in muscle stretching for exercise and rehabilitation. Int J Sports Phys Ther 2012. February 01;7(1):109–119. [PMC free article] [PubMed] [Google Scholar]
  • 5.Simpson CL, Kim BDH, Bourcet MR, Jones GR, Jakobi JM. Stretch training induces unequal adaptation in muscle fascicles and thickness in medial and lateral gastrocnemii. Scand J Med Sci Sports 2017. December 01;27(12):1597–1604. doi: 10.1111/sms.12822 [DOI] [PubMed] [Google Scholar]
  • 6.Mohamad NI, Nosaka K, Cronin J. Maximizing hypertrophy: possible contribution of stretching in the interset rest period. Strength Cond J 2011;33(1):81–87. [Google Scholar]
  • 7.Evangelista AL, De Souza EO, Moreira DCB, Alonso AC, Teixeira CVS, Wadhi T, et al. Interset Stretching vs. Traditional Strength Training: Effects on Muscle Strength and Size in Untrained Individuals. J Strength Cond Res 2019. January 24. doi: 10.1519/JSC.0000000000003036 [DOI] [PubMed] [Google Scholar]
  • 8.Silva JE, Lowery RP, Antonio J, McClearly S, Rauch J, Ormes J, et al. Weighted post-set stretching increases skeletal muscle hypertrophy (NSCA 2014 annual meeting. J Strength Cond Res 2014;28(12):65. [Google Scholar]
  • 9.Wadhi T, Barakat C, Evangelista AL, Pearson JR, Anand AS, Morrison TEA, et al. Loaded Inter-set Stretching for Muscular Adaptations in Trained Males: Is the Hype Real? Int J Sports Med 2021. August 10. [DOI] [PubMed] [Google Scholar]
  • 10.Nunes JP, Schoenfeld BJ, Nakamura M, Ribeiro AS, Cunha PM, Cyrino ES. Does stretch training induce muscle hypertrophy in humans? A review of the literature. Clin Physiol Funct Imaging 2020. May 01;40(3):148–156. doi: 10.1111/cpf.12622 [DOI] [PubMed] [Google Scholar]
  • 11.Schoenfeld BJ, Vigotsky AD, Grgic J, Haun C, Contreras B, Delcastillo K, et al. Do the anatomical and physiological properties of a muscle determine its adaptive response to different loading protocols? Physiol Rep 2020. May 01;8(9):e14427. doi: 10.14814/phy2.14427 [DOI] [PMC free article] [PubMed] [Google Scholar]
  • 12.Dankel SJ, Kang M, Abe T, Loenneke JP. Resistance training induced changes in strength and specific force at the fiber and whole muscle level: a meta-analysis. Eur J Appl Physiol 2019. January 01;119(1):265–278. doi: 10.1007/s00421-018-4022-9 [DOI] [PubMed] [Google Scholar]
  • 13.R: A language and environment for statistical computing. 2019; Available at: https://www.R-project.org/.
  • 14.Arampatzis A, Karamanidis K, Stafilidis S, Morey-Klapsing G, DeMonte G, Bruggemann GP. Effect of different ankle- and knee-joint positions on gastrocnemius medialis fascicle length and EMG activity during isometric plantar flexion. J Biomech 2006;39(10):1891–1902. doi: 10.1016/j.jbiomech.2005.05.010 [DOI] [PubMed] [Google Scholar]
  • 15.Clarkson PM, Sayers SP. Etiology of exercise-induced muscle damage. Can J Appl Physiol 1999. June 01;24(3):234–248. doi: 10.1139/h99-020 [DOI] [PubMed] [Google Scholar]
  • 16.Haff GG, Triplett NT editors. Essentials of strength and conditioning. 3rd ed. Champaign, IL: Human Kinetics; 2015. [Google Scholar]
  • 17.Ogasawara R, Thiebaud RS, Loenneke JP, Loftin M, Abe T. Time course for arm and chest muscle thickness changes following bench press training. Interventional Medicine and Applied Science 2012;4(4):217–220. doi: 10.1556/IMAS.4.2012.4.7 [DOI] [PMC free article] [PubMed] [Google Scholar]
  • 18.Damas F, Phillips SM, Libardi CA, Vechin FC, Lixandrao ME, Jannig PR, et al. Resistance training-induced changes in integrated myofibrillar protein synthesis are related to hypertrophy only after attenuation of muscle damage. J Physiol 2016. September 15;594(18):5209–5222. doi: 10.1113/JP272472 [DOI] [PMC free article] [PubMed] [Google Scholar]
  • 19.Vigotsky AD, Rouse EJ, Lee SSM. Mapping the relationships between joint stiffness, modeled muscle stiffness, and shear wave velocity. J Appl Physiol 2020;129(3):483–491. doi: 10.1152/japplphysiol.00133.2020 [DOI] [PubMed] [Google Scholar]
  • 20.Toumi A, Jakobi JM, Simoneau-Buessinger E. Differential impact of visual feedback on plantar- and dorsi-flexion maximal torque output. Appl Physiol Nutr Metab 2016. May 01;41(5):557–559. doi: 10.1139/apnm-2015-0639 [DOI] [PubMed] [Google Scholar]
  • 21.Bates D, Mächler M, Bolker B, Walker S. Fitting linear mixed-effects models using lme4. Journal of Statistical Software 2015;67(1): doi: 10.18637/jss.v067.i01 [DOI] [Google Scholar]
  • 22.Lenth RV. Estimated Marginal Means, a.k.a. Least-Squares Means. 2022; Available at: https://CRAN.R-project.org/package=emmeans.
  • 23.McShane BB, Gal D, Gelman A, Robert C, Tackett JL. Abandon statistical significance. The American Statistician 2019;73(Sup1):235–245. [Google Scholar]
  • 24.Gardner MJ, Altman DG. Confidence intervals rather than P values: estimation rather than hypothesis testing. Br Med J (Clin Res Ed) 1986. March 15;292(6522):746–750. [DOI] [PMC free article] [PubMed] [Google Scholar]
  • 25.Wang Y, Ikeda S, Ikoma K. Efficacy of passive repetitive stretching of skeletal muscle on myofiber hypertrophy and genetic suppression on MAFbx, MuRF1, and myostatin. J Muscle Res Cell Motil 2021. December 01;42(3–4):443–451. doi: 10.1007/s10974-021-09609-7 [DOI] [PubMed] [Google Scholar]
  • 26.Panidi I, Bogdanis GC, Terzis G, Donti A, Konrad A, Gaspari V, et al. Muscle Architectural and Functional Adaptations Following 12-Weeks of Stretching in Adolescent Female Athletes. Front Physiol 2021. July 16;12:701338. doi: 10.3389/fphys.2021.701338 [DOI] [PMC free article] [PubMed] [Google Scholar]
  • 27.Vandervoort AA, McComas AJ. A comparison of the contractile properties of the human gastrocnemius and soleus muscles. Eur J Appl Physiol Occup Physiol 1983;51(3):435–440. doi: 10.1007/BF00429079 [DOI] [PubMed] [Google Scholar]
  • 28.Holly RG, Barnett JG, Ashmore CR, Taylor RG, Molé PA. Stretch-induced growth in chicken wing muscles: a new model of stretch hypertrophy. Am J Physiol 1980. January 01;238(1):C62–71. doi: 10.1152/ajpcell.1980.238.1.C62 [DOI] [PubMed] [Google Scholar]
  • 29.Herzog W, Schappacher G, DuVall M, Leonard TR, Herzog JA. Residual Force Enhancement Following Eccentric Contractions: A New Mechanism Involving Titin. Physiology (Bethesda) 2016. July 01;31(4):300–312. doi: 10.1152/physiol.00049.2014 [DOI] [PubMed] [Google Scholar]
  • 30.Ward SR, Eng CM, Smallwood LH, Lieber RL. Are current measurements of lower extremity muscle architecture accurate? Clin Orthop Relat Res 2009. April 01;467(4):1074–1082. doi: 10.1007/s11999-008-0594-8 [DOI] [PMC free article] [PubMed] [Google Scholar]
  • 31.Pękala PA, Henry BM, Ochała A, Kopacz P, Tatoń G, Młyniec A, et al. The twisted structure of the Achilles tendon unraveled: A detailed quantitative and qualitative anatomical investigation. Scand J Med Sci Sports 2017. December 01;27(12):1705–1715. doi: 10.1111/sms.12835 [DOI] [PubMed] [Google Scholar]
  • 32.Knaus KR, Handsfield GG, Blemker SS. A 3D model of the soleus reveals effects of aponeuroses morphology and material properties on complex muscle fascicle behavior. J Biomech 2022. January 01;130:110877. doi: 10.1016/j.jbiomech.2021.110877 [DOI] [PMC free article] [PubMed] [Google Scholar]
  • 33.Fry AC. The role of resistance exercise intensity on muscle fibre adaptations. Sports Med 2004;34(10):663–679. doi: 10.2165/00007256-200434100-00004 [DOI] [PubMed] [Google Scholar]
  • 34.Heroux ME, Dakin CJ, Luu BL, Inglis JT, Blouin JS. Absence of lateral gastrocnemius activity and differential motor unit behavior in soleus and medial gastrocnemius during standing balance. J Appl Physiol (1985) 2014. January 15;116(2):140–148. doi: 10.1152/japplphysiol.00906.2013 [DOI] [PMC free article] [PubMed] [Google Scholar]
  • 35.Duysens J, van Wezel BM, Prokop T, Berger W. Medial gastrocnemius is more activated than lateral gastrocnemius in sural nerve induced reflexes during human gait. Brain Res 1996. July 15;727(1–2):230–232. doi: 10.1016/0006-8993(96)00525-2 [DOI] [PubMed] [Google Scholar]
  • 36.Nader GA, Esser KA. Intracellular signaling specificity in skeletal muscle in response to different modes of exercise. J Appl Physiol (1985) 2001. May 01;90(5):1936–1942. doi: 10.1152/jappl.2001.90.5.1936 [DOI] [PubMed] [Google Scholar]
  • 37.Trappe TA, Raue U, Tesch PA. Human soleus muscle protein synthesis following resistance exercise. Acta Physiol Scand Invalid date Invalid date;182(2):189–196. doi: 10.1111/j.1365-201X.2004.01348.x [DOI] [PubMed] [Google Scholar]
  • 38.Chale-Rush A, Morris EP, Kendall TL, Brooks NE, Fielding RA. Effects of chronic overload on muscle hypertrophy and mTOR signaling in young adult and aged rats. J Gerontol A Biol Sci Med Sci 2009. December 01;64(12):1232–1239. doi: 10.1093/gerona/glp146 [DOI] [PMC free article] [PubMed] [Google Scholar]
  • 39.Roberts MD, Mobley CB, Vann CG, Haun CT, Schoenfeld BJ, Young KC, et al. Synergist ablation-induced hypertrophy occurs more rapidly in the plantaris than soleus muscle in rats due to different molecular mechanisms. Am J Physiol Regul Integr Comp Physiol 2019. December 18. doi: 10.1152/ajpregu.00304.2019 [DOI] [PubMed] [Google Scholar]
  • 40.Halperin I, Pyne DB, Martin DT. Threats to internal validity in exercise science: a review of overlooked confounding variables. Int J Sports Physiol Perform 2015. October 01;10(7):823–829. doi: 10.1123/ijspp.2014-0566 [DOI] [PubMed] [Google Scholar]
  • 41.Beyer KS, Fukuda DH, Boone CH, Wells AJ, Townsend JR, Jajtner AR, et al. Short-Term Unilateral Resistance Training Results in Cross Education of Strength Without Changes in Muscle Size, Activation, or Endocrine Response. J Strength Cond Res 2016. May 01;30(5):1213–1223. doi: 10.1519/JSC.0000000000001219 [DOI] [PubMed] [Google Scholar]
  • 42.Hendy AM, Lamon S. The Cross-Education Phenomenon: Brain and Beyond. Front Physiol 2017. May 10;8:297. doi: 10.3389/fphys.2017.00297 [DOI] [PMC free article] [PubMed] [Google Scholar]

Decision Letter 0

Stephen E Alway

7 Jun 2022

PONE-D-22-00944Loaded inter-set stretch may selectively enhance muscular adaptations of the plantar flexorsPLOS ONE

Dear Dr. Schoenfeld,

Thank you for submitting your manuscript to PLOS ONE. We regret that it has been so difficult obtaining a solid review for your paper, but feel confident that although it has taken far too long, we have some concrete reviews for your manuscript. However, after careful consideration, we feel while the paper certainly has merit and is likely to provide a good review for the literature, currently it does not yet meet PLOS ONE’s publication criteria as it currently stands. Therefore, we invite you to submit a revised version of the manuscript that addresses the points raised during the review process. Specifically, two expert Reviewers found your paper interesting but there were several areas that drew concern. In particular one of the Reviewers was concerned about your approach for statistical analysis. This was challenged as to some of the changes were very  modest regarding PF strength, and potential increases in muscle thickness due to the stretch intervention. Although this was identified as a trend, no trend statistics were presented to make the argument strongly convincing. The Reviewers have other specific comments that I hope that you find helpful in your revision.

Please submit your revised manuscript by Jul 22 2022 11:59PM. If you will need more time than this to complete your revisions, please reply to this message or contact the journal office at plosone@plos.org. When you're ready to submit your revision, log on to https://www.editorialmanager.com/pone/ and select the 'Submissions Needing Revision' folder to locate your manuscript file.

Please include the following items when submitting your revised manuscript:

  • A rebuttal letter that responds to each point raised by the academic editor and reviewer(s). You should upload this letter as a separate file labeled 'Response to Reviewers'.

  • A marked-up copy of your manuscript that highlights changes made to the original version. You should upload this as a separate file labeled 'Revised Manuscript with Track Changes'.

  • An unmarked version of your revised paper without tracked changes. You should upload this as a separate file labeled 'Manuscript'.

If you would like to make changes to your financial disclosure, please include your updated statement in your cover letter. Guidelines for resubmitting your figure files are available below the reviewer comments at the end of this letter.

If applicable, we recommend that you deposit your laboratory protocols in protocols.io to enhance the reproducibility of your results. Protocols.io assigns your protocol its own identifier (DOI) so that it can be cited independently in the future. For instructions see: https://journals.plos.org/plosone/s/submission-guidelines#loc-laboratory-protocols. Additionally, PLOS ONE offers an option for publishing peer-reviewed Lab Protocol articles, which describe protocols hosted on protocols.io. Read more information on sharing protocols at https://plos.org/protocols?utm_medium=editorial-email&utm_source=authorletters&utm_campaign=protocols.

We look forward to receiving your revised manuscript.

Kind regards,

Stephen E Alway, Ph.D.

Academic Editor

PLOS ONE

Journal Requirements:

When submitting your revision, we need you to address these additional requirements.

1. Please ensure that your manuscript meets PLOS ONE's style requirements, including those for file naming. The PLOS ONE style templates can be found at

https://journals.plos.org/plosone/s/file?id=wjVg/PLOSOne_formatting_sample_main_body.pdf and

https://journals.plos.org/plosone/s/file?id=ba62/PLOSOne_formatting_sample_title_authors_affiliations.pdf

2.Thank you for stating in your Funding Statement:

“This study was supported by a PSC CUNY grant from the State of New York received by BJS. Award # 63497-00 51. The funding agency played no role in study design, data collection, analysis, decision to publish, or preparation of the manuscript.”

Please provide an amended statement that declares *all* the funding or sources of support (whether external or internal to your organization) received during this study, as detailed online in our guide for authors at http://journals.plos.org/plosone/s/submit-now.  Please also include the statement “There was no additional external funding received for this study.” in your updated Funding Statement.

Please include your amended Funding Statement within your cover letter. We will change the online submission form on your behalf.

3. Thank you for stating the following in the Competing Interests/Financial Disclosure* (delete as necessary) section:

“I have read the journal's policy and the authors of this manuscript have the following competing interests: BJS serves on the scientific advisory board of Tonal Corporation, a manufacturer of exercise equipment”

We note that one or more of the authors are employed by a commercial company: Tonal Corporation

a. Please provide an amended Funding Statement declaring this commercial affiliation, as well as a statement regarding the Role of Funders in your study. If the funding organization did not play a role in the study design, data collection and analysis, decision to publish, or preparation of the manuscript and only provided financial support in the form of authors' salaries and/or research materials, please review your statements relating to the author contributions, and ensure you have specifically and accurately indicated the role(s) that these authors had in your study. You can update author roles in the Author Contributions section of the online submission form.

Please also include the following statement within your amended Funding Statement.

“The funder provided support in the form of salaries for authors [insert relevant initials], but did not have any additional role in the study design, data collection and analysis, decision to publish, or preparation of the manuscript. The specific roles of these authors are articulated in the ‘author contributions’ section.”

If your commercial affiliation did play a role in your study, please state and explain this role within your updated Funding Statement.

b. Please also provide an updated Competing Interests Statement declaring this commercial affiliation along with any other relevant declarations relating to employment, consultancy, patents, products in development, or marketed products, etc. 

Within your Competing Interests Statement, please confirm that this commercial affiliation does not alter your adherence to all PLOS ONE policies on sharing data and materials by including the following statement: "This does not alter our adherence to  PLOS ONE policies on sharing data and materials.” (as detailed online in our guide for authors http://journals.plos.org/plosone/s/competing-interests) . If this adherence statement is not accurate and  there are restrictions on sharing of data and/or materials, please state these. Please note that we cannot proceed with consideration of your article until this information has been declared.

Please include both an updated Funding Statement and Competing Interests Statement in your cover letter. We will change the online submission form on your behalf.

4. We note that you have stated that you will provide repository information for your data at acceptance. Should your manuscript be accepted for publication, we will hold it until you provide the relevant accession numbers or DOIs necessary to access your data. If you wish to make changes to your Data Availability statement, please describe these changes in your cover letter and we will update your Data Availability statement to reflect the information you provide.

5. Please include a caption for figure 3

[Note: HTML markup is below. Please do not edit.]

Reviewers' comments:

Reviewer's Responses to Questions

Comments to the Author

1. Is the manuscript technically sound, and do the data support the conclusions?

The manuscript must describe a technically sound piece of scientific research with data that supports the conclusions. Experiments must have been conducted rigorously, with appropriate controls, replication, and sample sizes. The conclusions must be drawn appropriately based on the data presented.

Reviewer #1: Yes

Reviewer #2: Partly

**********

2. Has the statistical analysis been performed appropriately and rigorously?

Reviewer #1: N/A

Reviewer #2: No

**********

3. Have the authors made all data underlying the findings in their manuscript fully available?

The PLOS Data policy requires authors to make all data underlying the findings described in their manuscript fully available without restriction, with rare exception (please refer to the Data Availability Statement in the manuscript PDF file). The data should be provided as part of the manuscript or its supporting information, or deposited to a public repository. For example, in addition to summary statistics, the data points behind means, medians and variance measures should be available. If there are restrictions on publicly sharing data—e.g. participant privacy or use of data from a third party—those must be specified.

Reviewer #1: Yes

Reviewer #2: Yes

**********

4. Is the manuscript presented in an intelligible fashion and written in standard English?

PLOS ONE does not copyedit accepted manuscripts, so the language in submitted articles must be clear, correct, and unambiguous. Any typographical or grammatical errors should be corrected at revision, so please note any specific errors here.

Reviewer #1: Yes

Reviewer #2: Yes

**********

5. Review Comments to the Author

Please use the space provided to explain your answers to the questions above. You may also include additional comments for the author, including concerns about dual publication, research ethics, or publication ethics. (Please upload your review as an attachment if it exceeds 20,000 characters)

Reviewer #1: General comments: The paper is an intriguing one that is based on "older" work on the avian stretch model. I like the within-subject design; nice work.

Line 181, 199, and 213 (The figures on the PDF I have shows a bunch of question marks. I have no idea what it is supposed to show).

Otherwise, the design of the study is sound. The limitations mentioned in the paper are on point as well. If anything, this investigation shows how difficult it is to induce hypertrophy of the triceps surae. A study in trained bodybuilders would be interesting.

Reviewer #2: Thank you for the opportunity to review the manuscript titled “Loaded inter-set stretch may selectively enhance muscular adaptations of the plantar flexors.” (PONE-D-22-00944). The authors examined muscle thickness of the plantar flexor muscle group, and isometric plantar flexor strength after an 8-week training study which included resistance training, and resistance training with stretch between sets. The main finding was the soleus demonstrated greater response to the stretch protocol than the LG or MG.

General Comments:

The authors have presented an interesting study, however additional information around methods and interpretation of the results would enhance this paper. This reviewer finds some of the language used mis-conveys the findings and leads to ambiguity in the interpretation of the results, however I feel confident that with some added information and consideration of the below, the story will be strengthened.

The authors choice of the statistical evaluation of the data makes concrete interpretation of the results challenging, particularly in context of other stretch intervention literature. It is difficult to accept the changes noted as important when the authors are able to only suggest modest advantages to the stretch condition regarding PF strength, and potential increases in muscle thickness due to the stretch condition. While the authors state that the results are indicative of an important trend only, I’m not certain this is a strong enough argument to draw some of the conclusions made in this paper. For more specific comments please see below.

Specific Comments:

Abstract:

Line 2 – The word ‘longitudinal’ seems misplaced here (and in other places in the manuscript – Line 55 in the intro for one). Consider deleting as it refers more to the application of the intervention than the results.

Line 3/11/16 (and others) – The authors should consider their use of the word ‘hypertrophy’ in the context of this study. Although a change in muscle size (or thickness) was observed, I do not believe the measurements of true muscle hypertrophy exist in this methodology. Considering the literature, it appears this term is used often in context of stretch interventions, however I believe it is not accurate without a sample of muscle fibre size. At line 9 the authors refer to muscle thickness and this seems a more appropriate description of the outcome.

Introduction:

Line 29 – Simpson et al., (reference number 5) did not use the term ‘hypertrophy’ in their work, again as noted above, the authors should use caution about this in context of this paper. In order to justify this reference I recommend the authors change ‘hypertrophy’ to ‘ increases in muscle thickness’ as this is what was used and discussed in the Simpson et al. paper.

Line 60 – “…that the lateral gastrocnemius would experience greater hypertrophy than the other plantar flexors”. I assume the reference to the Schoenfeld et al. paper, and the work by Silva et al. are meant to serve as justification for as to why the authors believed the LG would show greater adaptation than the rest of the plantar flexors, however the introduction would be enhanced by an argument toward this end made by the authors (particularly when one of the main results relates to a difference between the LG, MG and Soleus).

Methods:

Line 64 – “recreationally active” males vs. “untrained” in Line 17 of the abstract. It is an important distinction when muscle growth is a key outcome.

Line 81 – Why did the authors choose to exclude resistance trained participants (or those that had trained in the past 6 months) particularly when Wadhi et al., and Silva et al. used trained individuals ( Line 36 and 45 of the Introduction). I suggest addition of justification around this point in the methods.

Line 96 – Is ‘stimulation’ the right word here? This conveys neuromuscular connotation. Consider a different word. Maybe ‘involvement’?

Line 97 – Describe the exercises used for this study. Considering these were loaded I would assume standard weight training machines were involved, but it would help evaluate the intervention to know which ones were used in this methodology. Even adding pictures if possible?

Line 98 – Why did the authors choose to use 2 days per week only? With the literature ranging from 1 day to 5 days per week it is worthwhile justifying this choice, particularly in regard to muscle growth.

Line 105 – What exercise was used for the establishment of the 10RM? Was this load kept the same between the seated and standing calf raises? Please add information around this.

Line 113 – How did the authors determine the set, rest and rep ranges, as well as the cadence of repetitions?

Line 116 – Given the literature varies extensively in the recommendations around stretch length and intensity, why did the authors choose a 20 second stretch (particularly when Silva et al. used 30?), and provide such a long rest interval between sets? I suggest this information is added to the paper.

Line 118 – For TRAD, when the subject was resting passively, were they in a loaded position still (ie-if they were performing standing calf raises, assuming the standard machine where weight is applied over the shoulders, did they step out from under the machine and rest standing? Seated? Or did they stay on the machine? For STRETCH, once the stretch was completed, the same question as the above. The authors might consider adding this information in the methods.

Line 126 – “Attempts were made…” does this suggest that not all loads were increased or that ‘attempts’ refers to the rep range? Suggest clarifying or deleting this as it seems to suggest not all participants underwent the same intervention.

Line 128 - Were participants allowed to perform aerobic/anaerobic cardiovascular-based exercises? Such as hill sprints, hurdles, explosive jumping, etc? Feasibly this could impact muscle growth as dramatically as resistance training (recognizing the authors suggested the subject pool was made up of recreationally active participants, I can’t imagine someone suddenly taking up hill sprints, but why make the distinction for resistance training only?)

Line 147 – The US measurements at 30% of the lower leg length needs qualification. At this point, the images are likely not across the widest part of the gastrocs and could be closer to the muscle tendon junction. I suggest the authors add information about this form of data collection as it is primary to their research question. Was each muscle group captured in an individual image at 30% of the lower leg length? If so, approximately where along the muscles was the measurement of depth taken? How did the image account for the difference in depth between the gastrocs and soleus? Was a different field of view used? Was the 30% position marked at the skin for all three muscles? What was the metric for when the quality of the image was ‘satisfactory’? How did the tech ‘obtain dimensions’ for the muscles? Given that even a small change in US probe orientation can produce a very different image, how did the authors/tech ensure the same spot measured pre and post intervention?

Line 147 – What was the position of the foot when the ultrasound images were being collected? How was the subject positioned? Please add this information

Line 151 – ‘Images for the MG and LG were measured as the distance from the superficial to deep aponeuroses…’ This doesn’t quite make sense. I interpret that this was the measure of muscle depth or thickness? If so, I suggest the authors replace the word ‘Images’ with what was actually measured here (muscle depth?) and then add information on how the measurement was done. If there was a software involved it would be ideal to have that information as well. Of particular importance is allowing the reader to understand if this is a depth measure (dropping a line from one aponeurosis to another?), how the same spot was measured each time (ie-did the authors define a measurement point a set distance from an identifiable landmark?). A figure showing these measurement techniques would be useful if possible.

Line 158 – ‘3 images were obtained for each site…’ With clarification of the above points it will become evident where the ‘sites’ are but the information at line 147 seems to indicate there is only one site being measured (30% of the lower leg length).

Line 163 – I suggest the authors include a bit more information around measurement of the MVC. Considering the contraction occurred for 5 seconds, was the maximal torque recorded at a certain point or averaged across the contraction (Line 174 – ‘the highest peak net joint moment…was used for analysis’ was this the highest toque achieved regardless of where in the contraction it occurred?).

Line 163 – Understanding the authors did not report voluntary activation, it may be worthwhile to report the instructions given to the participants as some were naïve to resistance training the contraction pre-intervention might be lower than post simply because the participants were not used to maximal contractions or were unable to recruit efficiently.

Line 173 – consider adding a reference after ‘increased performance’ due to visual feedback of the contraction (this one is good - https://doi.org/10.1139/apnm-2015-0639)

Statistical Analyses

Line 179 – The authors should include justification as to why they chose a hierarchical linear model over a linear regression for these data. Some discussion of variance or a suggestion as to what necessitated using this would help the reader understand the data slightly better. My interpretation of the references given (13 and 20) is they detail to the reader how these tests were done, not why. I believe the authors need to include the ‘why’ considering most of the stretch intervention literature uses different methods to assess similar data.

Line 228 – “…to avoid dichotomous interpretation of the results…” This sentence seems to suggest the authors are looking at trends, more than significant findings (ie-the goal is not to reject the null hypothesis it is to examine it). Which is important in its own way however the language used and conclusions drawn based on some of these findings are at odds with this statement. I encourage the authors to ensure the conclusions drawn are supported by these data and that by choosing the statistical methods they have, the authors may need to reconsider suggesting ‘change’ or ‘growth’ between muscles and conditions and instead suggest only trends. I am not convinced the findings are actually indicative of change but may simply be a trend in that direction (as I said, still important but needs to be carefully discussed).

Results:

Line 262 – This appears to be the only place the Volume Load measure appears in the paper (aside from Figure 2). I understand it likely links to the loading protocol described in the methods, but as it is not used in the discussion or to support the results, the authors might consider deleting it or using it for additional support of strength gains? (Same suggestion for the Figure)

Discussion:

Line 276 – 289 – This information may be better suited to the introduction and could aid in setting up the purpose statement and hypothesis more so than a description of the results.

Line 325 – “…may not reflect a global hypertrophying of the muscle.” I’m not sure what the authors mean here. Are the authors suggesting the protocol in this study created regional muscle growth? Is there additional evidence from this study to support this? It is an interesting idea but difficult to interpret from this statement. Consider rephrasing this.

Line 384 – the authors may consider the difference in findings comparing their untrained participants to those that were not naïve to resistance training. This seems to be a notable difference in this study and those the authors are drawing comparisons to!

Note – did the authors employ a measurement for the mobility of the ankle joint pre/post STRETCH intervention relative to TRAD? My though is perhaps some additional mobility could allow the ankle to plantar flex further in the eccentric phase of the calf-raise movement and facilitate greater utility of the muscle over the course of the protocol, thus enhancing size/strength. Just a thought here!

**********

6. PLOS authors have the option to publish the peer review history of their article (what does this mean?). If published, this will include your full peer review and any attached files.

If you choose “no”, your identity will remain anonymous but your review may still be made public.

Do you want your identity to be public for this peer review? For information about this choice, including consent withdrawal, please see our Privacy Policy.

Reviewer #1: No

Reviewer #2: No

**********

[NOTE: If reviewer comments were submitted as an attachment file, they will be attached to this email and accessible via the submission site. Please log into your account, locate the manuscript record, and check for the action link "View Attachments". If this link does not appear, there are no attachment files.]

While revising your submission, please upload your figure files to the Preflight Analysis and Conversion Engine (PACE) digital diagnostic tool, https://pacev2.apexcovantage.com/. PACE helps ensure that figures meet PLOS requirements. To use PACE, you must first register as a user. Registration is free. Then, login and navigate to the UPLOAD tab, where you will find detailed instructions on how to use the tool. If you encounter any issues or have any questions when using PACE, please email PLOS at figures@plos.org. Please note that Supporting Information files do not need this step.

PLoS One. 2022 Sep 1;17(9):e0273451. doi: 10.1371/journal.pone.0273451.r002

Author response to Decision Letter 0


16 Jun 2022

Reviewers' comments:

Reviewer's Responses to Questions

Comments to the Author

5. Review Comments to the Author

Please use the space provided to explain your answers to the questions above. You may also include additional comments for the author, including concerns about dual publication, research ethics, or publication ethics. (Please upload your review as an attachment if it exceeds 20,000 characters)

Reviewer #1: General comments: The paper is an intriguing one that is based on "older" work on the avian stretch model. I like the within-subject design; nice work.

AUTHOR RESPONSE: We appreciate your positive feedback and thank you for taking the time to review our paper.

Line 181, 199, and 213 (The figures on the PDF I have shows a bunch of question marks. I have no idea what it is supposed to show).

Otherwise, the design of the study is sound. The limitations mentioned in the paper are on point as well. If anything, this investigation shows how difficult it is to induce hypertrophy of the triceps surae. A study in trained bodybuilders would be interesting.

AUTHOR RESPONSE: I believe the issue with the figures was because the editorial manager did not recognize the special characters in Word. We have revised and it appears this is now correct on the resubmission.

Reviewer #2: Thank you for the opportunity to review the manuscript titled “Loaded inter-set stretch may selectively enhance muscular adaptations of the plantar flexors.” (PONE-D-22-00944). The authors examined muscle thickness of the plantar flexor muscle group, and isometric plantar flexor strength after an 8-week training study which included resistance training, and resistance training with stretch between sets. The main finding was the soleus demonstrated greater response to the stretch protocol than the LG or MG.

General Comments:

The authors have presented an interesting study, however additional information around methods and interpretation of the results would enhance this paper. This reviewer finds some of the language used mis-conveys the findings and leads to ambiguity in the interpretation of the results, however I feel confident that with some added information and consideration of the below, the story will be strengthened.

The authors choice of the statistical evaluation of the data makes concrete interpretation of the results challenging, particularly in context of other stretch intervention literature. It is difficult to accept the changes noted as important when the authors are able to only suggest modest advantages to the stretch condition regarding PF strength, and potential increases in muscle thickness due to the stretch condition. While the authors state that the results are indicative of an important trend only, I’m not certain this is a strong enough argument to draw some of the conclusions made in this paper. For more specific comments please see below.

AUTHOR RESPONSE: Thank you for your detailed comments; they have helped to improve the quality of our manuscript. We have addressed your comments on a point-by-point basis below, and made corresponding revisions in the manuscript highlighted in red text.

Specific Comments:

Abstract:

Line 2 – The word ‘longitudinal’ seems misplaced here (and in other places in the manuscript – Line 55 in the intro for one). Consider deleting as it refers more to the application of the intervention than the results.

AUTHOR RESPONSE: Fair point. We have deleted as requested.

Line 3/11/16 (and others) – The authors should consider their use of the word ‘hypertrophy’ in the context of this study. Although a change in muscle size (or thickness) was observed, I do not believe the measurements of true muscle hypertrophy exist in this methodology. Considering the literature, it appears this term is used often in context of stretch interventions, however I believe it is not accurate without a sample of muscle fibre size. At line 9 the authors refer to muscle thickness and this seems a more appropriate description of the outcome.

AUTHOR RESPONSE: We would note that muscle thickness is considered a valid measure of muscle size in the literature (see: https://www.frontiersin.org/articles/10.3389/fphys.2019.00247/full). That said, we understand your distinction here and thus have revised the paper to reflect changes in MT as opposed to hypertrophy where applicable.

Introduction:

Line 29 – Simpson et al., (reference number 5) did not use the term ‘hypertrophy’ in their work, again as noted above, the authors should use caution about this in context of this paper. In order to justify this reference I recommend the authors change ‘hypertrophy’ to ‘ increases in muscle thickness’ as this is what was used and discussed in the Simpson et al. paper.

AUTHOR RESPONSE: Change made as requested.

Line 60 – “…that the lateral gastrocnemius would experience greater hypertrophy than the other plantar flexors”. I assume the reference to the Schoenfeld et al. paper, and the work by Silva et al. are meant to serve as justification for as to why the authors believed the LG would show greater adaptation than the rest of the plantar flexors, however the introduction would be enhanced by an argument toward this end made by the authors (particularly when one of the main results relates to a difference between the LG, MG and Soleus).

AUTHOR RESPONSE: Correct, we referenced the Schoenfeld et al. study as reason for our speculation. This was a secondary outcome of interest and thus, in trying to keep the introduction concise, we prefer to focus on the primary outcomes in this session.

Methods:

Line 64 – “recreationally active” males vs. “untrained” in Line 17 of the abstract. It is an important distinction when muscle growth is a key outcome.

AUTHOR RESPONSE: We have revised to state “untrained but recreationally active” as the subjects did not participate in regimented resistance training

Line 81 – Why did the authors choose to exclude resistance trained participants (or those that had trained in the past 6 months) particularly when Wadhi et al., and Silva et al. used trained individuals ( Line 36 and 45 of the Introduction). I suggest addition of justification around this point in the methods.

AUTHOR RESPONSE: The study involved training just the calf muscles (without training the other lower limb muscles to control for potential confounding), and it would have been virtually impossible to get resistance trained subjects to give up training their lower body muscles for several months. Thus, by default we chose to employ untrained individuals for the sample.

Line 96 – Is ‘stimulation’ the right word here? This conveys neuromuscular connotation. Consider a different word. Maybe ‘involvement’?

AUTHOR RESPONSE: Changed as requested

Line 97 – Describe the exercises used for this study. Considering these were loaded I would assume standard weight training machines were involved, but it would help evaluate the intervention to know which ones were used in this methodology. Even adding pictures if possible?

AUTHOR RESPONSE: Good point. We have provided a description of the equipment.

Line 98 – Why did the authors choose to use 2 days per week only? With the literature ranging from 1 day to 5 days per week it is worthwhile justifying this choice, particularly in regard to muscle growth.

AUTHOR RESPONSE: Two days per week appears to be sufficient for optimizing results in hypertrophy-oriented programs (https://pubmed.ncbi.nlm.nih.gov/30558493/); there is not good evidence that additional frequencies promote better results.

Line 105 – What exercise was used for the establishment of the 10RM? Was this load kept the same between the seated and standing calf raises? Please add information around this.

AUTHOR RESPONSE: Good catch. We have added the info as requested.

Line 113 – How did the authors determine the set, rest and rep ranges, as well as the cadence of repetitions?

AUTHOR RESPONSE: The program aligns with typical hypertrophy-oriented RT programs and is consistent with general guidelines in the literature (see: https://pubmed.ncbi.nlm.nih.gov/27433992/; https://pubmed.ncbi.nlm.nih.gov/30558493/; https://pubmed.ncbi.nlm.nih.gov/33671664/)

Line 116 – Given the literature varies extensively in the recommendations around stretch length and intensity, why did the authors choose a 20 second stretch (particularly when Silva et al. used 30?), and provide such a long rest interval between sets? I suggest this information is added to the paper.

AUTHOR RESPONSE: There are no guidelines as yet as to optimal inter-set stretch duration. We carried out pilot testing and determined that subjects generally started to experience high levels of discomfort after 20 seconds and thus decided to employ this duration. We do in fact note in our limitations section that other durations may have provided an alternative outcome and thus this area requires future research.

Line 118 – For TRAD, when the subject was resting passively, were they in a loaded position still (ie-if they were performing standing calf raises, assuming the standard machine where weight is applied over the shoulders, did they step out from under the machine and rest standing? Seated? Or did they stay on the machine? For STRETCH, once the stretch was completed, the same question as the above. The authors might consider adding this information in the methods.

AUTHOR RESPONSE: The straight leg calf raise was performed in a leg press. All subjects rested passively in the respective units during the rest periods, but were in an unloaded state so this had no bearing on results.

Line 126 – “Attempts were made…” does this suggest that not all loads were increased or that ‘attempts’ refers to the rep range? Suggest clarifying or deleting this as it seems to suggest not all participants underwent the same intervention.

AUTHOR RESPONSE: Change made as requested.

Line 128 - Were participants allowed to perform aerobic/anaerobic cardiovascular-based exercises? Such as hill sprints, hurdles, explosive jumping, etc? Feasibly this could impact muscle growth as dramatically as resistance training (recognizing the authors suggested the subject pool was made up of recreationally active participants, I can’t imagine someone suddenly taking up hill sprints, but why make the distinction for resistance training only?)

AUTHOR RESPONSE: We did not make the distinction for aerobic activities, but we asked about their general activity levels and none of the subjects reported carrying out intense anaerobic exercise

Line 147 – The US measurements at 30% of the lower leg length needs qualification. At this point, the images are likely not across the widest part of the gastrocs and could be closer to the muscle tendon junction. I suggest the authors add information about this form of data collection as it is primary to their research question. Was each muscle group captured in an individual image at 30% of the lower leg length? If so, approximately where along the muscles was the measurement of depth taken? How did the image account for the difference in depth between the gastrocs and soleus? Was a different field of view used? Was the 30% position marked at the skin for all three muscles? What was the metric for when the quality of the image was ‘satisfactory’? How did the tech ‘obtain dimensions’ for the muscles? Given that even a small change in US probe orientation can produce a very different image, how did the authors/tech ensure the same spot measured pre and post intervention?

AUTHOR RESPONSE: The 30% measure was within the level of the muscle belly; we have done extensive experimentation in this regard and within 25% to 30% seems to provide the most consistent evaluation of the belly of the muscle. As noted in the methods, we employed a range of frequencies to evaluate the muscle based on interindividual differences. We have added information to indicate that measurements were taken using a tape measure and that sites were marked with a felt-tip pen. Our ICC’s are ~0.99 for measurement of the respective muscles, indicating a very high inter-session reliability.

Line 147 – What was the position of the foot when the ultrasound images were being collected? How was the subject positioned? Please add this information

AUTHOR RESPONSE: The ankle was held in neutral position; this info has been added to the manuscript.

Line 151 – ‘Images for the MG and LG were measured as the distance from the superficial to deep aponeuroses…’ This doesn’t quite make sense. I interpret that this was the measure of muscle depth or thickness? If so, I suggest the authors replace the word ‘Images’ with what was actually measured here (muscle depth?) and then add information on how the measurement was done. If there was a software involved it would be ideal to have that information as well. Of particular importance is allowing the reader to understand if this is a depth measure (dropping a line from one aponeurosis to another?), how the same spot was measured each time (ie-did the authors define a measurement point a set distance from an identifiable landmark?). A figure showing these measurement techniques would be useful if possible.

AUTHOR RESPONSE: We have revised for clarity. We also have added a representative image to illustrate the measurements.

Line 158 – ‘3 images were obtained for each site…’ With clarification of the above points it will become evident where the ‘sites’ are but the information at line 147 seems to indicate there is only one site being measured (30% of the lower leg length).

AUTHOR RESPONSE: We evaluated both the lateral and medial gastrocnemius so there were 2 sites along the width of the muscle; we have clarified this in the text.

Line 163 – I suggest the authors include a bit more information around measurement of the MVC. Considering the contraction occurred for 5 seconds, was the maximal torque recorded at a certain point or averaged across the contraction (Line 174 – ‘the highest peak net joint moment…was used for analysis’ was this the highest toque achieved regardless of where in the contraction it occurred?).

AUTHOR RESPONSE: Maximal torque was determined by the unit as the highest torque at any point during the MVC. This is reflected in the sentence: “The highest peak net joint moment from each of the 4 trials for each position was used for analysis”

Line 163 – Understanding the authors did not report voluntary activation, it may be worthwhile to report the instructions given to the participants as some were naïve to resistance training the contraction pre-intervention might be lower than post simply because the participants were not used to maximal contractions or were unable to recruit efficiently.

AUTHOR RESPONSE: Good suggestion. We have included a sentence to describe the instructions as well as the fact that participants were provided with a practice trial prior to testing.

Line 173 – consider adding a reference after ‘increased performance’ due to visual feedback of the contraction (this one is good - https://doi.org/10.1139/apnm-2015-0639)

AUTHOR RESPONSE: Thank you for the suggestion. We have included the reference as requested.

Statistical Analyses

Line 179 – The authors should include justification as to why they chose a hierarchical linear model over a linear regression for these data. Some discussion of variance or a suggestion as to what necessitated using this would help the reader understand the data slightly better. My interpretation of the references given (13 and 20) is they detail to the reader how these tests were done, not why. I believe the authors need to include the ‘why’ considering most of the stretch intervention literature uses different methods to assess similar data.

AUTHOR RESPONSE: We’ve added text to elaborate that these models are indicated due to the within-subject nature of our study. In principle, one could use OLS regression like they do in econometrics (treating subjects as “fixed-effects”), but this has some interpretation issues. We’ve also provided some explanation linking our models to linear mixed-effects models, with which some readers may be more familiar.

Line 228 – “…to avoid dichotomous interpretation of the results…” This sentence seems to suggest the authors are looking at trends, more than significant findings (ie-the goal is not to reject the null hypothesis it is to examine it). Which is important in its own way however the language used and conclusions drawn based on some of these findings are at odds with this statement. I encourage the authors to ensure the conclusions drawn are supported by these data and that by choosing the statistical methods they have, the authors may need to reconsider suggesting ‘change’ or ‘growth’ between muscles and conditions and instead suggest only trends. I am not convinced the findings are actually indicative of change but may simply be a trend in that direction (as I said, still important but needs to be carefully discussed).

AUTHOR RESPONSE: To hopefully address your concerns more formally, we are unsure what you mean by “trend,” but our rationale is grounded in statistics and decision theory. Significance testing is designed to be a decision process, and since drawing knowledge or inferences from studies is not a decision process (see Section 3, especially 3.2, in Greenland 2017), we are not interested in testing the (or a specific) null hypothesis. Rather, our primary interest is to obtain estimates of the effects along with the uncertainty of those estimates. The CI provides us with a range of values that are compatible with our data—to this end, we are quite careful to discuss the implications of the full range of values contained by the CI. After all, the lower bound of the CI is just as compatible with the data as the upper bound of the CI. Thus, we think it’s important for readers to appreciate all potential implications of our data rather than making dichotomous decisions based on whether the CI crosses zero.

Some references that expand on this viewpoint:

• Greenland, S. (2017). Invited Commentary: The Need for Cognitive Science in Methodology. American Journal of Epidemiology, 186(6), 639-645.

• Amrhein, V., Greenland, S., & McShane, B. (2019). Scientists rise up against statistical significance. Nature, 567(7748), 305-307.

• Greenland, S. (2021). Analysis goals, error‐cost sensitivity, and analysis hacking: Essential considerations in hypothesis testing and multiple comparisons. Paediatric and Perinatal Epidemiology, 35(1), 8-23.

We have tried to be cautious in our interpretation of findings throughout the manuscript when attempting to draw evidence-based conclusions. If there are specific instances where you believe we’ve overinterpreted the data, please let us know and we’d be happy to adjust our language or discuss as needed.

Results:

Line 262 – This appears to be the only place the Volume Load measure appears in the paper (aside from Figure 2). I understand it likely links to the loading protocol described in the methods, but as it is not used in the discussion or to support the results, the authors might consider deleting it or using it for additional support of strength gains? (Same suggestion for the Figure)

AUTHOR RESPONSE: Fair point. We have deleted the volume load data and removed its inclusion in the figure.

Discussion:

Line 276 – 289 – This information may be better suited to the introduction and could aid in setting up the purpose statement and hypothesis more so than a description of the results.

AUTHOR RESPONSE: We did cover these topics in the intro. We are simply reiterating the info to set up the discussion of results, so we feel it is better suited here as it would be rather redundant in the intro.

Line 325 – “…may not reflect a global hypertrophying of the muscle.” I’m not sure what the authors mean here. Are the authors suggesting the protocol in this study created regional muscle growth? Is there additional evidence from this study to support this? It is an interesting idea but difficult to interpret from this statement. Consider rephrasing this.

AUTHOR RESPONSE: We agree this was a bit ambiguous. We have revised for clarity. Thanks.

Line 384 – the authors may consider the difference in findings comparing their untrained participants to those that were not naïve to resistance training. This seems to be a notable difference in this study and those the authors are drawing comparisons to!

AUTHOR RESPONSE: Fair point. We have added a sentence to reflect potential discrepancies between trained and untrained participants.

Note – did the authors employ a measurement for the mobility of the ankle joint pre/post STRETCH intervention relative to TRAD? My though is perhaps some additional mobility could allow the ankle to plantar flex further in the eccentric phase of the calf-raise movement and facilitate greater utility of the muscle over the course of the protocol, thus enhancing size/strength. Just a thought here!

AUTHOR RESPONSE: This is an interesting hypothesis, as it is possible the intervention may have had additional flexibility benefits. However, this was not a predetermined outcome and thus unfortunately we did not measure ROM changes.

Decision Letter 1

Stephen E Alway

9 Aug 2022

Loaded inter-set stretch may selectively enhance muscular adaptations of the plantar flexors

PONE-D-22-00944R1

Dear Dr. Schoenfeld,

After careful review of your revision, we are pleased to inform you that your manuscript has been judged scientifically suitable for publication and will be formally accepted for publication once it meets all outstanding technical requirements.

Within one week, you’ll receive an e-mail detailing the required amendments. When these have been addressed, you’ll receive a formal acceptance letter and your manuscript will be scheduled for publication.

An invoice for payment will follow shortly after the formal acceptance. To ensure an efficient process, please log into Editorial Manager at http://www.editorialmanager.com/pone/, click the 'Update My Information' link at the top of the page, and double check that your user information is up-to-date. If you have any billing related questions, please contact our Author Billing department directly at authorbilling@plos.org.

If your institution or institutions have a press office, please notify them about your upcoming paper to help maximize its impact. If they’ll be preparing press materials, please inform our press team as soon as possible -- no later than 48 hours after receiving the formal acceptance. Your manuscript will remain under strict press embargo until 2 pm Eastern Time on the date of publication. For more information, please contact onepress@plos.org.

Kind regards,

Stephen E Alway, Ph.D.

Academic Editor

PLOS ONE

Additional Editor Comments (optional):

Reviewers' comments:

Reviewer's Responses to Questions

Comments to the Author

1. If the authors have adequately addressed your comments raised in a previous round of review and you feel that this manuscript is now acceptable for publication, you may indicate that here to bypass the “Comments to the Author” section, enter your conflict of interest statement in the “Confidential to Editor” section, and submit your "Accept" recommendation.

Reviewer #2: All comments have been addressed

**********

2. Is the manuscript technically sound, and do the data support the conclusions?

The manuscript must describe a technically sound piece of scientific research with data that supports the conclusions. Experiments must have been conducted rigorously, with appropriate controls, replication, and sample sizes. The conclusions must be drawn appropriately based on the data presented.

Reviewer #2: Yes

**********

3. Has the statistical analysis been performed appropriately and rigorously?

Reviewer #2: Yes

**********

4. Have the authors made all data underlying the findings in their manuscript fully available?

The PLOS Data policy requires authors to make all data underlying the findings described in their manuscript fully available without restriction, with rare exception (please refer to the Data Availability Statement in the manuscript PDF file). The data should be provided as part of the manuscript or its supporting information, or deposited to a public repository. For example, in addition to summary statistics, the data points behind means, medians and variance measures should be available. If there are restrictions on publicly sharing data—e.g. participant privacy or use of data from a third party—those must be specified.

Reviewer #2: Yes

**********

5. Is the manuscript presented in an intelligible fashion and written in standard English?

PLOS ONE does not copyedit accepted manuscripts, so the language in submitted articles must be clear, correct, and unambiguous. Any typographical or grammatical errors should be corrected at revision, so please note any specific errors here.

Reviewer #2: Yes

**********

6. Review Comments to the Author

Please use the space provided to explain your answers to the questions above. You may also include additional comments for the author, including concerns about dual publication, research ethics, or publication ethics. (Please upload your review as an attachment if it exceeds 20,000 characters)

Reviewer #2: Thank you for your thorough explanations and thoughtful revisions to the paper. I am interested to see where this work will go from here, and additional studies to come from it.

**********

7. PLOS authors have the option to publish the peer review history of their article (what does this mean?). If published, this will include your full peer review and any attached files.

If you choose “no”, your identity will remain anonymous but your review may still be made public.

Do you want your identity to be public for this peer review? For information about this choice, including consent withdrawal, please see our Privacy Policy.

Reviewer #2: No

**********

Acceptance letter

Stephen E Alway

16 Aug 2022

PONE-D-22-00944R1

Loaded inter-set stretch may selectively enhance muscular adaptations of the plantar flexors

Dear Dr. Schoenfeld:

I'm pleased to inform you that your manuscript has been deemed suitable for publication in PLOS ONE. Congratulations! Your manuscript is now with our production department.

If your institution or institutions have a press office, please let them know about your upcoming paper now to help maximize its impact. If they'll be preparing press materials, please inform our press team within the next 48 hours. Your manuscript will remain under strict press embargo until 2 pm Eastern Time on the date of publication. For more information please contact onepress@plos.org.

If we can help with anything else, please email us at plosone@plos.org.

Thank you for submitting your work to PLOS ONE and supporting open access.

Kind regards,

PLOS ONE Editorial Office Staff

on behalf of

Dr. Stephen E Alway

Academic Editor

PLOS ONE

Associated Data

    This section collects any data citations, data availability statements, or supplementary materials included in this article.

    Data Availability Statement

    The data for this study are available from the OSF preregistration page (https://osf.io/mtw6q).


    Articles from PLoS ONE are provided here courtesy of PLOS

    RESOURCES