

Abstract
We study the COVID-19 epidemic in emerging markets that face financial frictions and its mitigation through social distancing and vaccination. We find that restricted vaccine availability in emerging markets, as captured by limited quantities and high prices, renders the pandemic exceptionally costly in these countries, compared with economies without financial frictions. Improved access to financial markets enables a better response to the delay in vaccine supplies, as it supports more stringent social distancing measures before wider vaccine availability. We show that financial assistance programs to such financially constrained countries can increase vaccinations and lower fatalities, at no present-value cost to the international community.
Keywords: COVID-19, Vaccination, Fiscal space, Financial market conditions
Introduction
In many emerging markets, vaccination campaigns against COVID-19 have lagged behind those of developed economies, with mounting human and economic costs from the pandemic. In managing the pandemic, countries first relied on mitigation measures to limit social interactions and later focused on the acquisition and administration of scarce vaccines. Governments have implemented fiscal transfers to support consumption and the unemployed.1 However, such fiscal programs and vaccine imports were limited for emerging markets, because of tight fiscal space and a constrained supply of vaccines. A leading reason for these countries’ limited fiscal space is their precarious access to financial markets. We study quantitatively the consequences of vaccine scarcity and its interaction with access to financial markets and use our findings to evaluate international assistance.
To motivate our work, in Figure 1, we plot COVID-19 vaccination rates, cumulative excess deaths, and mobility against a measure of financial market access for over 100 countries. We use the private credit to output ratio, a common measure of financial development, to proxy for the countries’ financial market access.2 The figure shows that better financial market access is associated with a higher fraction of the population being vaccinated against COVID-19, a lower excess mortality, and greater social distancing efforts (proxied by lower mobility). The magnitudes are sizable. A 100% difference in private credit to GDP, such as the one between France and Nigeria, is associated with a lower death rate of about 0.13% of the population, an increase in vaccination of 38% of the population, and a higher social distancing measures of 8%. As we document in the Appendix, the correlations are robust to an additional set of controls, including GDP per capita, the demographic structure of the country, and the degree of trade openness. We acknowledge, however, that these empirical relations should be interpreted as correlations that are statistically significant and not as causal effects.
Fig. 1.

Vaccinations, Deaths, and Financial Development. Notes: COVID-19 vaccinations and cumulative excess deaths are as of December 2021. Mobility is average monthly mobility for March 2020 to December 2021. The figures plot these series against private credit to GDP in 2019, residualized with continent and island nation dummies. We also report the slope coefficients, which are significant at the 1% level. Table 5 in the Appendix reports regression results with additional controls
We build a framework that relates financial market access to vaccination uptake and the overall death toll from the epidemic. As in Arellano et al. (2020a), we integrate standard epidemiological dynamics into a model of a small open economy facing financial frictions. We modify that framework to study endogenous vaccination uptake and its impact on epidemic and economic outcomes. Vaccinations are useful because they provide immunity, but they are costly in terms of resources and may arrive too late, when a large fraction of the population is already immune as a result of having contracted the disease. The epidemic exhibits multiple waves of infections, which trigger ongoing health crises, with associated time paths of infected and deceased individuals. In our model, the economy responds to the epidemic through endogenous social distancing measures and vaccination campaigns, while the government issues debt to smooth the impact of costly mitigation measures and vaccine expenditure on consumption. The economy faces financial frictions in the form of tightly constrained borrowing. These financial market frictions increase the welfare cost of the epidemic, because by depressing consumption, they increase the cost of social distancing measures and the usefulness of vaccines, which arrive too late. With lower vaccination rates, fatalities are higher, which in turn further increases the cost of the epidemic. We find that international financial assistance programs can increase vaccinations and lower fatalities because they provide a lifeline before the vaccines arrive.
The epidemiological block of the model is the standard Susceptible-Infected-Recovered (SIR) framework, as in Atkeson (2020). New infections are the result of contacts between individuals who are susceptible to the disease and those currently infected. All infected individuals eventually transition to either a recovered or deceased state. Social distancing limits infections because it temporarily reduces the contact rate between individuals who might be infected and those susceptible. Vaccinations permanently reduce the measure of susceptible individuals, who could otherwise become infected and thus risk death during the epidemic. The international borrowing block of the model follows a standard small open bond economy subject to a borrowing constraint. We consider a centralized problem with a sovereign that values the lives and consumption of its population. The sovereign decides on borrowing, social distancing measures, and vaccine acquisitions to support consumption and to manage the dynamics of infection and prevent deaths. Importantly, the economy faces constraints on the supply of vaccines that it may acquire at different points in time.
In our baseline results, the epidemic leads to multiple waves of social distancing, which are associated with reduced consumption. These occur because the availability of vaccines is delayed by a year from the start of the epidemic, with a slow ramp up in capacity. Interestingly, we find that not all the vaccine supplies that eventually become available are used up, as a large fraction of the population is already immune because of infections predating vaccine availability. To tease out the role of financial frictions for these outcomes, we compare our baseline results with financial constraints with the results of an environment with perfect financial markets. As in Arellano et al. (2020a), better access to financial markets allows the economy to engage in more intense social distancing measures to manage the epidemic, because these costs do not translate contemporaneously to reductions in consumption. With the possibility of vaccination, we also find that better access to financial markets results in higher vaccination rates. The complementarity between financial market access and vaccinations arises because having financial resources available at the outbreak of the epidemic reduces infections early on and causes a larger fraction of the population to eventually need a vaccine when capacity ramps up. The time-buying role of financial markets is quantitatively significant, increasing vaccinations by about 10%.
We evaluate how the supply of vaccines, encoded in the vaccine price and quantity constraints the economy faces, affects the country’s outcomes and its interactions with financial market conditions. With higher prices and tighter quantity constraints, a restricted supply worsens epidemic and economic outcomes. With limited options for vaccination, the economy manages the epidemic mainly through social distancing policies which are associated with deeper recessions and more sizable reductions in consumption. In contrast, when there is an ample supply of vaccines, the epidemic is resolved more quickly, and the economic crisis from a late wave of infections can be avoided or substantially shortened.
We find that epidemic outcomes, such as fatalities, are more sensitive to vaccine capacity the more constrained financial conditions are. In our baseline economy, fatalities would be 12% lower if vaccines were widely available after a year, as opposed to after a lengthy two year ramp-up in the quantity of available vaccines. The same acceleration of vaccine deliveries is associated with a more modest 2.2% reduction in fatalities under perfect financial markets. This experiment suggests that expediting the ramp-up in vaccine capacity can support a much quicker end to the pandemic and a much shallower recession, especially in countries that face more severe financial frictions.3 These results again highlight the time-buying role of financial market access: with perfect financial markets, what matters most is the eventual availability of vaccines, while under financial frictions, the timing of vaccine arrival shapes outcomes.
Finally, we use our framework to evaluate counterfactual international financial assistance loans. As in Arellano et al. (2020a), we consider long-term loans extended upon the outbreak of the epidemic. These additional loans relax financial constraints for the small open economy. We find that such international assistance tends to increase vaccinations by allowing more robust mitigation measures before vaccines are widely available. With fewer infections, vaccines are more useful later on and endogenously employed more heavily. The quantitative impact is sizable: a loan of 7% of output increases vaccinations by 5% and reduces deaths by 28%, while lowering the welfare costs of the epidemic by 35%. We also evaluate loans extended later, at the onset of the second wave. These late loans have a limited impact on vaccinations but also improve welfare substantially, because they are well timed to help support consumption during unexpected waves of infection.
Our paper contributes to the fast-growing literature that studies the COVID-19 epidemic and its economic impact. Alvarez et al. (2021) and Eichenbaum et al. (2021) study optimal mitigation policies in simple production economies in which the epidemic dynamics follow a SIR model. Their results highlight the trade-off inherent in social distancing: it saves lives but is costly in terms of economic output. Our framework contains a similar trade-off but emphasizes the role of financial frictions and vaccine constraints.
A few papers share our focus on the impact of COVID-19 on emerging markets. Hevia and Neumeyer (2020) highlight the multifaceted nature of the pandemic, a tremendous external shock for emerging markets that includes collapsing export demand, tourism, remittances, and capital flows. Çakmaklı et al. (2020) focus on international input-output linkages and sectoral heterogeneity by constructing a SIR-macro model calibrated to the Turkish input-output structure. Arellano et al. (2020a) focus instead on the interaction between financial market conditions and epidemic outcomes by explicitly modeling default risk as a source of financial frictions, while abstracting from endogenous vaccination uptake. We share with this work the emphasis on financial frictions, but we uncover a new channel: better financial market access increases the benefits from and use of delayed vaccine availability.
Our paper is also related to the literature studying optimal social distancing and vaccination using extended SIR models. Makris and Toxvaerd (2020) argue that social distancing measures are optimally tightened in anticipation of the arrival of a vaccine. Glover et al. (2022) focus on the optimal allocation of vaccines across a population that is heterogeneous in age. Like us, they find that vaccines and social distancing are complements, as early social distancing increases the benefits of late vaccinations. In contrast, Garriga et al. (2022) find that the possibility of vaccine arrival matters little for early social distancing. When available, vaccines substitute for social distancing, as is the case in our paper too. Most of the existing literature focuses on the USA and assumes costless vaccination. Our work, on the other hand, studies emerging markets and highlights the importance of financial frictions for vaccination policies.
Model
We study a small open economy with a continuum of agents and a government that borrows internationally, subject to constraints. The economy is unexpectedly hit by an epidemic, COVID-19, which results in time paths of infections and deaths. The epidemic dynamics follow a standard epidemiological Susceptible-Infected-Recovered (SIR) model augmented with endogenous social distance and vaccination measures. Vaccination uptake is subject to constraints: vaccines become available with a delay, and the capacity ramps up with time. During the epidemic, a subset of the population endogenously transitions from being susceptible to being infected or vaccinated. Infected individuals eventually either recover or die. The fatality rate is endogenous, to reflect limited healthcare capacity. With the vaccine, susceptible individuals transition directly to the recovered state, and the vaccine eliminates the risk of dying from the disease. The eventual outcome of the epidemic for the economy can be altered with social distancing measures and vaccinations.
Preferences, Technology, and Borrowings
We consider preferences over consumption and lives. As in Alvarez et al. (2021), the flow payoff increases in consumption per capita and decreases in fatalities . We assume each fatality imposes a loss of value . The lifetime value is given by
| 1 |
where is the discount factor. The utility from consumption is concave and equals , with controlling the intertemporal elasticity of substitution.
Output in the economy, , is produced using labor, possibly constrained by social distancing measures. Agents are endowed with one unit of time, and hence, total labor supply equals population . Social distance measures of intensity reduce each agent’s labor input to . The economy’s output equals
| 2 |
where the parameter is between 0 and 1.
The country has an international debt level and can borrow at the international rate r up to a borrowing limit . The country uses its output resources and new borrowing to service its debt and spend on aggregate consumption and vaccines . The country faces a time-varying quota or capacity constraint on its vaccine roll-out and a unit price for each vaccine course of p, both of which are determined in world markets. The resource constraint for the economy is given by
| 3 |
Epidemic, Social Distancing, and Vaccination
The epidemic dynamics are modeled using the classic SIR setup of Kermack and McKendrick (1927). After the outbreak of the disease, a subset of the population transitions endogenously from being susceptible to being infected and, eventually, to being either recovered or deceased. Thus, during the epidemic, the population is divided into three epidemiological groups: susceptible, infected, and recovered. The mass of each group is denoted by , , and , respectively. We assume that the initial population size is 1. The total mass of the deceased is . The epidemic starts when an initial subset of the population becomes infected exogenously: . The rest of the population is susceptible, except possibly for a measure of agents already recovered , so that . The presence of some already recovered individuals captures the idea that policymakers become aware of the infection after it has already spread to some extent through the population.
The spread of the epidemic can be mitigated with social distancing and vaccination . As in Alvarez et al. (2021), social distancing reduces labor input by a fraction and social interactions by , where the parameter controls the imperfect effectiveness of social distancing measures for prevention of infection.4 Eventually, the country will be able to buy vaccine courses with a unit price p.5 Each course can render one susceptible individual immune to the disease. The country faces a time-varying quota or capacity constraint on its vaccine roll-out.
In modeling how transmissible the disease is, we follow the standard approach, according to which the probability of infection of the currently susceptible depends on the mass of infected individuals and effective social distancing measures . The mass of newly infected individuals is denoted by , and we assume that it is determined by
| 4 |
The presence of twice in this expression reflects the idea that reduced social interactions are in effect for both the infected and the susceptible. The parameter captures the degree to which the disease is contagious, and it can be time varying. The mass of susceptible individuals in period is that of period t minus any new infections and individuals vaccinated in period t, :
| 5 |
Individuals remain infected with probability each period. The mass of infected individuals in period equals a share of the infected in period t plus any new infections. The resulting law of motion is
| 6 |
With complementary probability , the infection resolves, and the individual either recovers or dies. Like Alvarez et al. (2021), we assume that the probability of death, conditional on being infected, is a function of current infections, resulting in fatalities every period. To capture the role of health care capacity for the fatality rate, we assume that is an increasing function; a large number of simultaneous infections puts a strain on the healthcare system, reducing its ability to successfully treat cases. The resolution of infections into recoveries or deaths induces the following laws of motion for these two groups:
| 7 |
| 8 |
The above evolution of types induces a law of motion for population ,
| 9 |
Dynamic Problem
We study a centralized problem in which a government makes all choices for the economy. The government learns about the epidemic in period 0. The outbreak changes the prospects for the economy, since the epidemic will lead to loss of life as well as disruptions in production and consumption. The government borrows from international financial markets and chooses social distance policies and vaccine purchases to maximize the lifetime value (1).
The state variables consist of population measures and the debt level .6 The value function for the government depends on these states and on time. The government can borrow from international lenders at an interest rate r, subject to a borrowing limit . The government chooses optimal borrowing , social distancing , and vaccines to maximize its objective, given by
| 10 |
subject to the resource constraint (3) the borrowing and vaccine limits,
| 11 |
and the SIR laws of motion (4)–(8), which map current population measures, social distance and vaccination policies to future measures , and overall population in (9).
When choosing and , the government trades off the potential benefits from saving lives against the costs of social distance policies and vaccinations in terms of output and consumption. Consumption is lowered by production disruptions from social distancing measures and from spending on vaccines, and this response is amplified by financial frictions. If financing opportunities are ample, under a loose limit, any reduction in current income from social distancing and vaccine purchases matters for consumption only through a reduction in lifetime income. Consumption adjusts modestly to this lower permanent income, but the period-by-period consumption decline need not necessarily mirror the contemporaneous declines in output. With tight borrowing limits, in contrast, the consumption costs from social distancing and vaccine purchases cannot be smoothed out.
To emphasize the role of financial frictions in vaccine and social distance policies, we will compare our baseline model with financial frictions to a setup with perfect financial markets, in which the government makes choices subject to a lifetime budget constraint for the country:
| 12 |
where is the initial level of debt for the country upon the outbreak of the epidemic, as well as the vaccine constraints and the SIR laws of motion.
Quantitative Analysis
We proceed to the quantitative analysis of our model. We first discuss the choice of parameters, including those controlling the SIR dynamics and supply conditions for vaccines. We then describe the time paths of the baseline economy and compare them with those under perfect financial markets. Next, we evaluate how the evolution of the supply of vaccines impacts the epidemic outcomes and its interdependence with financial markets. Finally, we study counterfactual financial assistance programs and show that these can greatly enhance the usefulness of vaccination.
Parameterization
The period length is one week, to capture the fast dynamics of infection. The epidemic outbreak is timed at the start of April 2020. Table 1 collects all parameter values and their interpretation.
Table 1.
Parameters
| Preferences/Technology | |||||
| 0.5 | Intertemporal elasticity of substitution | ||||
| Discounting | |||||
| 4025 | Value of statistical life | ||||
| 0.67 | Labor share | ||||
| Epidemics and Vaccination | |||||
| 0.67 | 18 days to expected infection resolution | ||||
| 2.6 | Initial | ||||
| Time-varying | |||||
| 0.5 | Effectiveness of social distancing | ||||
| 12 | Months until the start of vaccine distribution | ||||
| 12 | Months to ramp up to full vaccine capacity | ||||
| 0.035 | Maximum weekly vaccine capacity | ||||
| p | 0.2 | Vaccine unit price | |||
| Financial Markets | |||||
| r | Interest rate | ||||
| 31.2 | 60% initial debt-to-GDP level | ||||
| Epidemic parameters set jointly | Moment | Data | Model | ||
|---|---|---|---|---|---|
| 0.0059 | Baseline fatality rate | Case fatality rate | 0.64 | 0.62 | |
| 0.0824 | Healthcare congestion | Cum. death 2020 | 0.15 | 0.16 | |
| 1.2 | Asymptotic | Cum. death 2021 | 0.35 | 0.25 | |
| 0.9 | Decay rate of | Max SD 2020 | 0.68 | 0.55 | |
| 1.6 | Second wave | Max SD 2021 | 0.30 | 0.30 | |
| Average SD | 0.22 | 0.20 | |||
Note: “Cum. death” denotes cumulative deaths; the unit is percent. “SD” denotes social distancing. The data source is IHME: https://www.healthdata.org/
Epidemiological parameters
Infections resolve in 18 days on average, implying a value of 0.67 for . Concerning the effectiveness of social distancing measures, we set to reflect the possibility of infection away from work, school, or travel. This possibility dampens the impact of social distance policies on the spread of the epidemic, in line with the evidence in Mossong et al. (2008).
The parameter relates to the effective “reproduction number” , which measures the expected number of additional infections caused by one infected person over the entire course of his or her illness, with . Arellano et al. (2020a) allow for a time-varying to reproduce the otherwise puzzling disconnect between the timing of fatalities and social distancing measures in the data and also to introduce the second wave. At the outbreak of the epidemic, starts at . This number is from early studies of COVID-19 based on the cases on the Diamond Princess ship. During this first wave of infections, decays at rate towards a level of . Formally, during the first wave. An unexpected second wave of infections, plausibly caused by a new variant of the virus, raises permanently to about one year from the start of the epidemic. Fatalities are quadratic in the measure of infected, , where captures healthcare infrastructure congestion.
We pin down the remaining path parameters , , and the fatality parameters , by matching moments in the data. We consider six statistics of COVID death and social distancing: the case fatality rate, cumulative deaths at the end of 2020 and 2021, the maximum levels of social distancing in 2020 and 2021, and the overall average level of social distancing. Social distancing is measured with the negative of the mobility. The case fatality rate is the ratio of the number of deaths from COVID to the number of infections over a period of time, which corresponds to in our model. Our data source is the IHME, which reports the case fatality rate, excess death, and a measure of social distancing during the COVID-19 pandemic. We follow Arellano et al. (2020a) and consider the weighted average of each series across eight Latin American countries—namely, Argentina, Brazil, Chile, Colombia, Ecuador, Mexico, Paraguay, Peru, and Uruguay—using their 2019 populations as weights. The bottom panel of Table 1 reports moments in the data and in the model.
All the five parameters are jointly determined. The fatality parameter helps us generate the case fatality rate of 0.64. In the first wave, falls from a level of 2.6 to , reflecting heightened awareness and behavioral changes in the population, such as the use of masks and hygiene practices. The decay rate of and help us generate the 2021 measures for mobility and deaths. See Appendix B for the time path of . Our model resembles the observed death and social distancing measures. The cumulative deaths in 2020 are 0.15 in the data and 0.16 in the model. For 2021, the model generates somewhat fewer deaths: cumulative deaths are 0.35 in the data and 0.25 in the model. In the data, the largest decline in social distancing measures is 68% in 2020 and 30% in 2021, while in the model, the maximum is 55% and 30% in 2020 and 2021, respectively. The model also matches well average social distancing over the last two years, which is 22% in the data and 20% in the model.
Preferences, production, and debt. Preferences exhibit a constant elasticity of intertemporal substitution in consumption with a standard value of , while the parameter is set to 4025, following the value of statistical life measures for emerging markets in Viscusi and Masterman (2017) and the calculations in Arellano et al. (2020a). The coefficient in the production is set to the standard labor share value of 0.67. The discount factor is consistent with a 2% domestic real rate in emerging markets, and the international rate r is annualized, as in Arellano et al. (2020b). Initial debt to annual output at the outbreak of the epidemic is , which is the average government debt to output ratio in Latin American in 2019. We also set the borrowing constraint for this economy equal to the initial level of debt.
Vaccine capacity. Vaccine capacity is characterized by its start date, months after the epidemic outbreak, the length of time required for the program to ramp up to full capacity, months, and the peak weekly capacity . Vaccine capacity can be summarized by the following schedule
| 13 |
The vaccine becomes available one year into the epidemic, . Its weekly peak is of the population, which we base on the highest level achieved in the USA, and its ramp-up speed is 12 months, with . We will perform comparative statics over vaccine ramp-up timing.
The price for vaccines varies across time and countries, as documented by Dyer (2021) and UNICEF (2021).7 We use a value of for two doses, which is within the range of estimates. We then set by expressing the price relative to weekly output per capita, using the 2019 value for Mexico. In Section 3.3, we explore the impact of varying vaccine prices, as observed in cross-country data.
Vaccination and Financial Market Conditions
The epidemic in our model exhibits two waves of infections: the first wave is caused by the initial outbreak in April 2020, while the second wave is due to the unexpected emergence of a new variant one year later, in April 2021. We assume that upon the outbreak of the epidemic, agents are aware of the eventual availability of vaccines and the speed at which vaccine capacity will be ramped up, but they do not expect the second wave.
Figure 2 plots time paths for vaccination, social distancing policies, consumption, and population measures by infection status for our baseline economy with constrained financial markets. We also plot the same paths for the reference economy facing perfect financial markets. We start by discussing the paths of the baseline economy, depicted using solid blue lines. Panel (a) captures vaccination outcomes. Vaccines are not available before April 2021, at which time capacity ramps up linearly, reaching a weekly peak of 3.5% of the population in June 2022. The country chooses to use all available vaccines before January 2022 and then to halt vaccination once the measure of susceptible individuals has reached a herd immunity threshold, after which the number of infections quickly dwindles. Without immunization options, the country uses social distancing measures to battle the outbreak of the first wave. It starts with an aggressive 55% reduction in activity and gradually loosens restrictions. Given the limited availability of vaccines, the country begins a renewed set of social distancing measures when the second wave of infections arrives in April 2021. When vaccination becomes more readily available, social distancing is phased out. In Panel (c), we plot the consumption path relative to the level before the epidemic. Consumption closely resembles a mirror image of social distancing, with two big declines during both the first and second waves, because the country faces tight borrowing constraints throughout. In the second wave, consumption falls slightly more than labor input alone would entail, that is, its fall exceeds output losses associated with social distance measures owing to vaccine purchases.
Fig. 2.

Time Paths: Baseline and Perfect Financial Markets. Note: Simulated time paths for the baseline economy with constrained financial markets (solid, blue) and the economy with perfect financial markets (dashed, red). The epidemic outbreak is timed at the start of April 2020. Both the second wave and vaccinations begin in April 2021. The vertical dashed black line marks the start of the second wave
Both social distance measures and vaccinations help the country fight against the epidemic. The measure of susceptible individuals decreases over time and reaches about 20% in January 2022. Between July 2021 and January 2022, vaccination significantly reduces the number of susceptible individuals in danger of infection. Social distance measures, on the other hand, are less effective than vaccination, as shown by the flatter slope in the first wave in Panel (d). The evolution of infections is plotted in Panel (e). The two humps in the picture reflect the two waves of the pandemic. Panel (f) depicts the cumulative death tolls in this economy. It grows over time, reaching 0.25% of the population by the end of the episode.
The red dashed lines in Figure 2 show the time paths for the case of perfect financial markets. The government adopts more severe social distance measures for both the first and second waves than it does in the baseline, owing to ample access to international borrowing. Before the availability of vaccines, stricter social distance measures significantly lower infection rates. However, before the second wave, the number of susceptible individuals remains high, as fewer people have undergone infection and recovery by this time. While the country cannot ramp up its vaccine purchases faster than in the case of the baseline economy, it administers vaccinations for a longer period of time. Consumption is not constrained to follow the path of output and social distance measures in this case: over time the country can maintain a smoother path of consumption by aggressively relying on international borrowing.8 The end result is that the country experiences many fewer fatalities than in the financially constrained baseline economy, owing to its stricter social distance measures and additional vaccinations.
We summarize the health and economic outcomes for these two economies in Table 2. For the baseline economy with financial constraints, about 64% of people receive a vaccine. The country chooses social distance measures that cumulatively depress output by about 26% of its annual level.9 In contrast, the present value of expenditure on vaccines is substantially smaller, accounting for only 0.2% of annual output. Although they are inexpensive, vaccines are delayed and in limited supply. The epidemic is costly, it lowers welfare by 1.08% in terms of consumption equivalence, and the country would be willing to forgo 1.08% of pre-pandemic consumption every period forever to avoid the outbreak entirely.
Table 2.
Vaccination and Financial Markets
| With Vaccine | No Vaccine | Unexpected Vaccine | ||||
|---|---|---|---|---|---|---|
| Constr’d | Perfect | Constr’d | Perfect | Constr’d | Perfect | |
| Health | ||||||
| Vaccinations | 64 | 70 | – | – | 55 | 70 |
| Fatalities | 0.25 | 0.06 | 0.83 | 0.08 | 0.39 | 0.07 |
| Mitigation Costs (% output) | ||||||
| Social Distancing | 26 | 37 | 27 | 127 | 21 | 36 |
| Vaccine Expenditure | 0.2 | 0.3 | – | – | 0.2 | 0.3 |
| Welfare Cost of Pandemic | ||||||
| Consumption Equiv. | ||||||
Note: The columns labeled “Constr’d” (“Constrained”) are our baseline model with financial frictions, while the columns labeled “Perfect” are the model with perfect financial markets. The “No Vaccines” scenario is implemented as for all t and corresponds to the results in Arellano, Bai, and Mihalache (2020a, Section 4.6) augmented with a second wave. Under the “Unexpected Vaccine” scenario, agents are unaware of the eventual availability of the vaccine
Outcomes under perfect financial market are better. The economy can more easily afford social distancing and immunizations, with vaccines reaching 70% of the overall population. As a result of longer and more intense social distancing, the cumulative loss of income is about 37% of pre-pandemic annual output. The resulting epidemic welfare cost under perfect financial markets is approximately half that of the financially constrained baseline, with a 0.48% consumption equivalent welfare cost from the epidemic.
For additional context, we compare our results with those of the case of a second wave without access to vaccines, as in Arellano, Bai, and Mihalache (2020a, Section 4.6). Without vaccination, the country’s only option to contain the outbreak is to impose harsher social distance measures. The financially constrained economy enforces prolonged but less severe measures to strike a balance between lowering the mortality toll and smoothing consumption, but on net, the present value of output costs is similar to that of the economy with vaccines. Mortality rates are much higher without vaccination, around 0.83% in the constrained economy and 0.08% for the case of perfect financial markets. Vaccines reduce deaths, and this reduction is much greater for the economy with constrained financial markets: 0.25% versus 0.83%, a decrease of about 70%. In the perfect financial market, the decrease in the death toll is less significant, about 25%. Vaccines can reduce the welfare cost of the pandemic by 0.8% for the financially constrained economy and by 0.9% for the one with perfect financial markets.
To further isolate the role of vaccine availability, we also analyze a scenario under which, upon the outbreak of the epidemic, agents are unaware of the ramped-up availability of the vaccine in one year’s time. This alters behavior and key outcomes, including fatalities, during the first wave. Under this scenario, the financially constrained economy implements less social distancing, reducing the overall output cost from 26% to 21%. This more modest social distancing early on results in fewer susceptible individuals at the outbreak of the second wave. The economy has a lower immunization rate of 55% compared to 64% in the benchmark. As a result, the number of deaths rises from 0.25% to 0.39% of the population. With perfect financial markets, expectation concerning the availability of a vaccine has little impact on health and economic consequences.
In summary, access to vaccines is highly valuable to financially constrained economies. Vaccination helps the economy mitigate the pandemic without the need for harsh and prolonged social distancing measures. Even just the prospect of future vaccine availability increases the benefits from early social distance and reduces eventual mortality in the country.
In light of the global nature of the COVID-19 epidemic, one potential challenge for this mechanism is that financial markets might be less useful than our findings suggest, because each country might need credit at the same time. Although from a theoretical point of view, financial markets cannot smooth global shocks in settings with symmetric countries, such a pessimistic conclusion does not necessarily carry over to environments with heterogeneous countries. In practice, during the COVID-19 epidemic, savings rates of richer households skyrocketed, especially in wealthier countries like the USA. These savings can constitute a potential source of funding for all countries in the world. We leave these important considerations for future work.
Vaccine Ramp-Up, Prices, and Financial Markets
Having established vaccine availability’s importance and interaction with financial market conditions, we now examine the effect of vaccine ramp-up speed and pricing on pandemic outcomes. The top panel of Table 3 summarizes the health and economic consequences of alternative vaccine scenarios. We consider two additional timings for the ramp-up: in the “Quick” case, we assume vaccinations are immediately available at their peak weakly capacity of 3.5%, while the “Slow” case takes 24 months to reach this level. With a “Quick” ramp-up, the government chooses to max out its capacity for three months when facing constrained financial markets, resulting in an increase in total immunization from 64% to 70%. This reduces total fatalities from 0.25% to 0.22%; despite the fact that the country engages in less aggressive social distance policies. Additionally, it results in a smaller output costs from social distancing and welfare losses. In comparison, the “Slow” scenario, with a more gradual ramp-up, exhibits reduced immunization rates, increased mortality, and lower welfare.
Table 3.
Vaccination Scenarios
| Quantity ramp-up | Constrained Fin Markets | Perfect Fin Markets | ||||
|---|---|---|---|---|---|---|
| Quick | Baseline | Slow | Quick | Baseline | Slow | |
| Vaccinations | 70 | 64 | 56 | 77 | 70 | 65 |
| Fatalities | 0.22 | 0.25 | 0.26 | 0.07 | 0.06 | 0.06 |
| Social Distance Cost | 19 | 26 | 29 | 27 | 37 | 41 |
| Welfare (CE) | ||||||
| Price | Low | Baseline | High | Low | Baseline | High |
| Vaccinations | 77 | 64 | 36 | 84 | 70 | 43 |
| Fatalities | 0.24 | 0.25 | 0.27 | 0.06 | 0.06 | 0.06 |
| Social Distance Cost | 26 | 26 | 26 | 37 | 37 | 37 |
| Welfare (CE) | ||||||
Note: Quantity ramp-up: “Quick” corresponds to ; our baseline has . “Slow” reports months. Vaccine price comparison: “Low” is ; our baseline has . “High” corresponds to . The price is expressed in weekly income per capita. The consumption equivalent (“CE”) measure reports the welfare comparison of the various vaccine scenarios to a timeline without the epidemic
With perfect financial markets, the ramp-up speed has qualitatively similar effects. In this case, the country benefits less from the faster ramp-up because the increase in immunizations, the reduction in fatalities, and savings in terms of output are all smaller, owing in large part to better outcomes in the baseline scenario. Moreover, as previously highlighted, the economy with perfect financial markets can rely on its lifetime income to smooth consumption and therefore finds it much easier to engage in aggressive social distancing, even if vaccines are slower to arrive.
In the bottom panel of Table 3, we examine the impact of vaccine prices on health and economic outcomes. We set out baseline price to 0.2 in line with our calculation based on a unit price relative to a weekly income per capita in Mexico in 2019. We consider two alternative prices, a “Low” price of based on a country with weekly income per capita in the range of that of the USA and a “High” price of based on weekly income per capita in the range of Burundi.10 The “Low” price is also consistent with weekly income in Mexico and purchases of AstraZeneca at about $4 per dose.
With a higher vaccine price and constrained financial markets, the relevant case for many highly impoverished countries, the epidemic outcomes are worse: fatalities increase by 8%, and the number of vaccinated individuals is about 40% lower than in our baseline. The substantial cost of vaccines discourages their use, even under perfect financial markets, yet the overall health and economic outcomes are only modestly altered. When vaccine prices are lower than in the baseline, the country acquires vaccines and immunizes a greater number of people; however, this has a negligible effect on deaths and welfare for both the constrained economy and the perfect financial markets. The reason is that the country is always subject to a binding capacity constraint early in the vaccination campaign. Even if the country were to inoculate more people later with a more ample available supply, these extra vaccines would arrive too late to save additional lives.
In summary, from the comparisons reported in this section, we find that the speed with which a country can obtain and administer vaccines is far more critical than their acquisition price, except for highly impoverished countries. We also find that outcomes for the financially constrained economy are more responsive to both prices and ramp-up speed than under perfect financial markets, where outcomes are quite favorable even under baseline conditions.
International Financial Assistance
We now examine the impact of international financial assistance programs on the vaccination efforts and epidemic outcomes.11 We consider programs that take the form of long-term loans. We assume that international organizations extend a loan of size F that is repaid with perpetual coupons of size rF. The international organization, therefore, breaks even in present value. We analyze the implications of an early loan that is extended upon the outbreak of the epidemic and a late loan that is extended at the beginning of the second wave. We consider a loan of 7% of the economy’s annual output and will perform comparative statics for other loan sizes.
When the economy receives the loan, it can choose to either consume it or save it, by reducing its debt towards private lenders. In equilibrium, the economy saves most of it because the inflow from the financial assistance loan is large compared with income or consumption in that week. By adjusting its debt, the economy makes flexible use of this financial assistance. Importantly, these funds effectively enable the country to move away from its borrowing constraint, and as we saw in previous sections, such forces potentially have great implications for vaccination, fatalities, and welfare.
Table 4 compares outcomes across financial assistance scenarios.12 The early loan increases the vaccination rate from 64% to 67% and reduces fatalities by almost 30%. The economy uses the early loan to engage in more aggressive social distancing policies and prevent early infections. With fewer early infections, vaccines are more useful when they eventually arrive, and the economy can vaccinate more people, resulting in fewer fatalities. The welfare costs from the epidemic are substantially reduced from 1.08% to 0.7% in terms of consumption equivalence. Hence, the welfare gain from the financial assistance is 0.4%. These welfare gains come from both smoother consumption and fewer deaths.13
Table 4.
International Financial Assistance Programs
| Baseline | Loan | ||
|---|---|---|---|
| Early | Late | ||
| Health | |||
| Vaccinations | 64 | 67 | 63 |
| Fatalities | 0.25 | 0.18 | 0.22 |
| Mitigation Costs (% output) | |||
| Social Distancing | 26 | 29 | 27 |
| Vaccine Expenditure | 0.24 | 0.25 | 0.24 |
| Welfare Cost of Pandemic | |||
| Consumption Equivalent | |||
Note: The loans are perpetuity loans of 7% of pre-pandemic annual output. The “Early Loan” is given upon the outbreak of the epidemic, while the “Late Loan” is timed with the beginning of the second wave
The late loan program, disbursed during the second wave in April 2021, is also beneficial to the economy. The economy uses this late loan to support consumption during the second wave and implement more stringent social distance measures, which help reduce fatalities. Even though it generates smaller reductions in deaths than the early program, the late program cuts the welfare costs from the epidemic more than the early one does. The reason is that the second wave is unexpected in our exercises; the late financial assistance loan is useful, as it helps support consumption around this unexpected shock.
The impact of the late loan on vaccinations, however, does depend on the timing of the supply of vaccines. We find that such a late loan can in fact increase vaccinations for economies that face higher vaccine prices or tighter quantity constraints. For example, the late loan increases vaccination rates by 1% in our high price economy and by 2% in the low ramp-up case. Nevertheless, the more potent effects on vaccinations from financial assistance loans occur by allowing better mitigation before vaccines become available, and this is most important during the first wave.
We now perform comparative statics to the size of the financial assistance loan, and we focus on the early loan, extended at the outbreak of the epidemic. In Figure 3, we plot the change in vaccinations and welfare gains induced by loans of varying sizes, expressed as percentages of pre-pandemic annual output. Welfare is reported relative to the baseline economy with no financial assistance. The vertical line corresponds to the 7% loan that we analyzed above. Larger loans are associated with a greater increase in vaccinations and higher welfare. For example, relative to the case with no financial assistance, the loan of 20% of output increases the vaccination rate by about 10% and welfare by 0.8%. In summary, bigger loan programs are always weakly better because they increasingly eliminate the constraints imposed by financial frictions and support outcomes close to those previously discussed in the perfect financial markets reference.
Fig. 3.
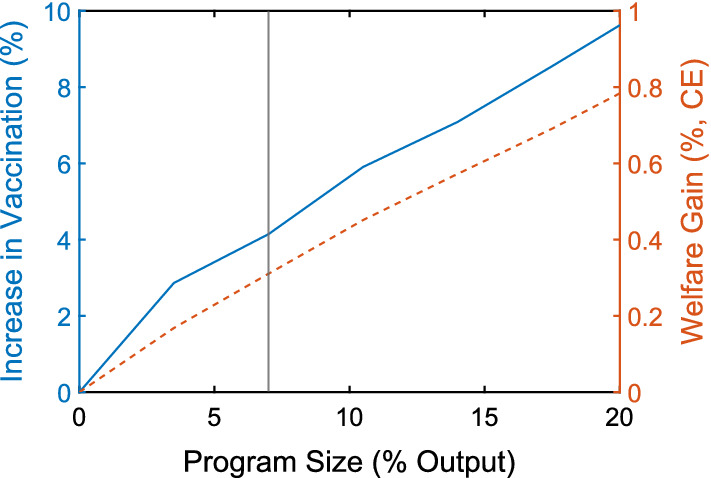
Loan Size, Vaccination, Welfare
Conclusion
Vaccination is an essential component of the worldwide fight against the COVID-19 epidemic. To study the uptake in vaccination and its impact on epidemic and economic outcomes, we have integrated standard epidemiological dynamics into a small open economy that borrows internationally, subject to financial frictions. We have shown that financial frictions impede the usefulness of vaccines that arrive too late, because they limit the early social distancing policies needed to buy time. With financial frictions, the welfare cost of the epidemic is higher because of fewer vaccinations, higher death rates, and more severe declines in consumption. We find that financial assistance programs can increase vaccinations because they provide a lifeline before the vaccines arrive. Our work, therefore, supports the emphasis of many international organizations on the importance of ample vaccine availability for developing countries and on financial assistance programs.
Appendix
Additional Controls
Table 5 documents the robustness of the evidence presented in Figure 1 to the inclusion of additional controls measured in 2019, including median age, GDP per capita, trade openness, and the share of agriculture in GDP.
Table 5.
Regression Results with Additional Controls
| Vaccinations | Excess Deaths | Mobility | |
|---|---|---|---|
| Private Credit to GDP | |||
| (4.724) | (0.061) | (0.021) | |
| Geography Controls | |||
| Additional Controls | |||
| N | 123 | 123 | 123 |
| Adj-R2 | 0.77 | 0.31 | 0.43 |
Note: “Geography controls” include continent dummies and a dummy for island nations. Additional controls consist of median age, GDP per capita, trade openness, and the share of agriculture in GDP, all measured in 2019. Robust standard errors reported in parentheses. , ,
Time Path of Reproduction Number
Figure 4 plots the time path of implied by our parameters, based on matching 6 fatalities and social distancing moments in the data. It features two waves. In the first wave, starts with 2.6 and then decays at the rate of 0.9 until it reaches 1.2 on March 2021, when the second wave ensues.
Fig. 4.
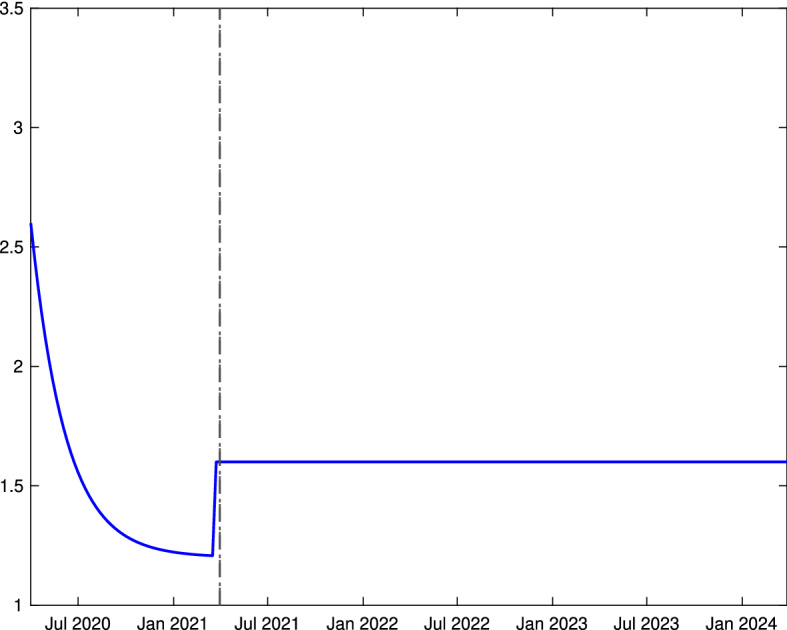
Time Path
Time Paths under Various Scenarios
Figure 5 documents the impact of vaccine availability under constrained financial markets while Figure 6 reports the case of perfect financial markets. Under both scenarios, vaccines prevent a large share of eventual fatalities and hasten the end of the epidemic. Figure 7 compares the time paths under international financial assistance resulting from the early and late loan programs.
Fig. 5.

Constrained Fin Markets: Vaccine Availability. Note: Simulated time paths for the economy with vaccination (solid, blue) and without (dashed, red), for the equilibrium of the economy facing constrained financial markets, i.e., a comparison of the baseline parameters with the case of for all t
Fig. 6.

Perfect Fin Markets: Vaccine Availability. Note: Simulated time paths for the economy with vaccination (solid, blue) and without (dashed, red), for the equilibrium of the economy facing perfect financial markets, i.e., a comparison of the baseline parameters with the case of for all t
Fig. 7.

International Financial Assistance. Note: Simulated time paths for the economy receiving either an early international loan program (solid, blue) or a late program (dashed, red)
Footnotes
The International Monetary Fund (2022) compiles comprehensive data on each country’s policy response to the pandemic. Cantú et al. (2021) focus on the role of monetary policy in creating fiscal space.
Vaccination rates and cumulative excess deaths are taken from https://ourworldindata.org/ and correspond to December 2021 values; mobility is from the IHME https://www.healthdata.org/, which uses aggregate mobility data from Google–lower mobility indicates greater social distancing. Private credit to GDP for 2019 is taken from the Global Financial Development Indicators. The figure plots residualized measures, with continent and island nation dummies, scaled with the overall means. The number of observations is 123 and is based on data availability.
Our results support the emphasis of the World Health Organization’s COVAX program, which aims to provide vaccines to developing countries and is funded by donor contributions, as discussed by, e.g., Wouters et al. (2021).
Following Alvarez et al. (2021), we abstract from explicitly modeling private incentives to reduce consumption and/or labor supply in order to mitigate the risk of infection, as studied by Eichenbaum et al. (2021) and Farboodi et al. (2020), among others. Such incentives could be weakened in emerging markets, where financial conditions are tight and a substantial share of households may be thought of as “hand-to-mouth.” The absence of such a mechanism, though, could potentially bias upwards our findings on the benefits of financial market access.
For tractability, we assume that vaccination requires a one-time dose, thereby abstracting from vaccine courses requiring multiple doses with some time lag between them. Allowing for such a lag would require us to keep track of at least one other state variable, the measure of agents with an incomplete vaccine course.
Fatalities can always be computed as residual: , given initial population .
According to UNICEF (2021), the average price per dose is $14 for Pfizer, $25 for Moderna, $5 for AstraZeneca, $18 for Sinovac, and $21 for Sinopharm.
With perfect financial markets, consumption has a slight downward trend, even without shocks. This is because in our parameterization, the country is relatively impatient compared with its lenders: .
The decline in output is the present value of output’s deviation from its pre-pandemic level.
For these calculations, the relevant measure of income per capita is not the purchasing power parity (PPP) adjusted one but rather the income expressed in US dollars at the current exchange rate.
This analysis complements the one of Arellano, Bai, and Mihalache (2020a, Section 4.5), which studied debt relief programs for addressing the health crisis through social distance measures only.
See Figure 7 in Appendix C for the time paths of vaccination, social distancing, SIR dynamics, and consumption under the early and late loan programs.
Without the epidemic, the country would also gain from financial assistance because it relaxes the borrowing constraints, but by about half of our baseline gain.
This paper was prepared for the 2021 IMF Jacques Polak Annual Research Conference. We are grateful to Pierre Yared for his insightful discussion. We also thank Chang Liu and Simeng Zeng for exceptional research assistance. The authors would like to thank Stony Brook Research Computing and Cyberinfrastructure, and the Institute for Advanced Computational Science at Stony Brook University for access to the innovative high-performance Ookami computing system, which was made possible by the National Science Foundation with grant #1927880. The views expressed herein are those of the authors and not necessarily those of the Federal Reserve Bank of Minneapolis or the Federal Reserve System.
Publisher's Note
Springer Nature remains neutral with regard to jurisdictional claims in published maps and institutional affiliations.
Contributor Information
Cristina Arellano, Email: arellano.cristina@gmail.com.
Yan Bai, Email: yanbai06@gmail.com.
Gabriel Mihalache, Email: mihalache@gmail.com.
References
- Alvarez Fernando, Argente David, Lippi Francesco. A simple planning problem for COVID-19 lock-down, testing, and tracing. American Economic Review: Insights. 2021;3(3):367–82. [Google Scholar]
- Arellano, Cristina, Yan Bai, and Gabriel P Mihalache. 2020a. Deadly Debt Crises: COVID-19 in Emerging Markets. Technical report 27275. National Bureau of Economic Research. 10.3386/w27275. http://www.nber.org/papers/w27275. (Cited on pages 3–6, 13, 15, 16, 20, 22, 24).
- Arellano, Cristina, Yan Bai, and Gabriel P Mihalache. 2020b. Monetary Policy and Sovereign Risk in Emerging Economies (NK-Default). Working Paper 26671. National Bureau of Economic Research, January. 10.3386/w26671. http://www.nber.org/papers/w26671. (Cited on page 16).
- Atkeson, Andrew. 2020. What Will Be the Economic Impact of COVID-19 in the US? Rough Estimates of Disease Scenarios. Working Paper 26867. National Bureau of Economic Research, March (Cited on page 3).
- Cantú, Carlos, Paolo Cavallino, Fiorella De Fiore, and James Yetman. 2021. A Global Database on Central Banks’ Monetary Responses to COVID-19. BIS Working Papers 934. Bank for International Settlements, March. https://www.bis.org/publ/work934.htm(Cited on page 1).
- Çakmaklı, Cem, Selva Demiralp, Sebnem Kalemli-Özcan, Sevcan Yesiltas, and Muhammed A Yildirim. 2020. COVID-19 and Emerging Markets: A SIR Model, Demand Shocks and Capital Flows. Working Paper 27191. National Bureau of Economic Research, May. 10.3386/w27191. http://www.nber.org/papers/w27191. (Cited on page 6).
- Dyer Owen. Covid-19: countries are learning what others paid for vaccines. Bmj. 2021;372:16–21. doi: 10.1136/bmj.n16. [DOI] [PubMed] [Google Scholar]
- Eichenbaum, Martin S, Sergio Rebelo, and Mathias Trabandt. 2021. The Macroeconomics of Epidemics. The Review of Financial Studies 34,no. 11 (April): 5149–5187. issn:0893–9454. 10.1093/rfs/hhab040. eprint: https://academic.oup.com/rfs/article-pdf/34/11/5149/40724161/hhab040.pdf. (Cited on pages 6, 9).
- Farboodi, Maryam, Gregor Jarosch, and Robert Shimer. 2020. Internal and External Effects of Social Distancing in a Pandemic. Working Paper 27059. National Bureau of Economic Research, April. 10.3386/w27059. http://www.nber.org/papers/w27059. (Cited on page 9).
- Garriga, Carlos, Rody Manuelli, and Siddhartha Sanghi. 2022. Optimal Management of an Epidemic: Lockdown, Vaccine and Value of Life. COVID-19 Economics, Journal of Economic Dynamics and Control 140:104351. issn: 0165-1889. 10.1016/j.jedc.2022.104351. https://www.sciencedirect.com/science/article/pii/S0165188922000562. (Cited on page 7).
- Glover, Andrew, Jonathan Heathcote, and Dirk Krueger. 2022. Optimal Age-Based Vaccination and Economic Mitigation Policies for the Second Phase of the COVID-19 Pandemic. COVID-19 Economics, Journal of Economic Dynamics and Control 140: 104306. issn: 0165-1889. 10.1016/j.jedc.2022.104306. https://www.sciencedirect.com/science/article/pii/S0165188922000112. [DOI] [PMC free article] [PubMed]
- Hevia Constantino, Neumeyer Andy. A Conceptual Framework for Analyzing the Economic Impact of COVID-19 and its Policy Implications. Technical report, Policy Document Series. UNDP Latin American and the Cribbean. 2020;1:29–32. [Google Scholar]
- International Monetary Fund. 2022. Policy Responses to COVID-19. Accessed June 20, 2022. https://www.imf.org/en/Topics/imf-and-covid19/Policy-Responses-to-COVID-19. (Cited on page 1).
- Kermack, William Ogilvy, and Anderson G McKendrick. 1927 A contribution to the mathematical theory of epidemics Proceedings of the Royal Society of London Series A, Containing papers of a mathematical and physical character 115(772): 700–721
- Makris Miltiadis, Toxvaerd Flavio. Great Expectations: Social Distancing in Anticipation of Pharmaceutical Innovations. Cambridge: Faculty of Economics, University of Cambridge; 2020. [Google Scholar]
- Mossong Joël, Hens Niel, Jit Mark, Beutels Philippe, Auranen Kari, Mikolajczyk Rafael, Massari Marco, et al. Social contacts and mixing patterns relevant to the spread of infectious diseases. PLOS Medicine. 2008;5(3):1–1. doi: 10.1371/journal.pmed.0050074. [DOI] [PMC free article] [PubMed] [Google Scholar]
- UNICEF. 2021. COVID-19 Vaccine Market Dashboard. https://www.unicef.org/supply/covid-19-vaccine-market-dashboard.
- Viscusi W. Kip, Masterman Clayton J. Income elasticities and global values of a statistical life. Journal of Benefit-Cost Analysis. 2017;8(2):226–250. doi: 10.1017/bca.2017.12. [DOI] [Google Scholar]
- Wouters Olivier J, Shadlen Kenneth C, Salcher-Konrad Maximilian, Pollard Andrew J, Larson Heidi J, Teerawattananon Yot, Jit Mark. Challenges in ensuring global access to COVID-19 vaccines: production, affordability, allocation, and deployment. The Lancet. 2021;397:1023–1034. doi: 10.1016/S0140-6736(21)00306-8. [DOI] [PMC free article] [PubMed] [Google Scholar]