

Abstract
Background
Endobronchial ultrasound‐guided transbronchial needle aspiration (EBUS‐TBNA) is used to evaluate hilar/interlobar/lobar lymph nodes. This study aimed to assess the clinical utility of EBUS‐TBNA for station 10/11/12 lymph nodes (LNs) in patients with primary lung cancer.
Methods
This was a retrospective analysis of a prospectively collected database of patients with primary lung cancer who underwent EBUS‐TBNA for station 10/11/12 LNs from January 2015 to December 2019. Patients with benign results from EBUS‐TBNA who did not undergo surgical sampling/clinical follow‐up or who received radiotherapy/chemotherapy were excluded.
Results
The analyses were conducted on 889 LNs from 797 patients. The overall diagnostic sensitivity, specificity, accuracy, negative predictive value (NPV), and positive predictive value of EBUS‐TBNA were 95.7, 100, 97.3, 93.2, and 100%, respectively. Diagnostic sensitivity was significantly lower for LNs <10 mm than ≥10 mm in size (90.1% vs. 97.8%; p < 0.001). There was no significant difference in diagnostic performance according to the nodal station (10 vs. 11/12) and left‐ versus right‐sided LNs. The diagnostic sensitivity (100 vs. 95.5%; p = 0.221) and specificity (100 vs. 100%) of N3 LNs was not significantly different from those of N1 LNs. In this study, eight (8/91, 8.8%) patients with cN1 NSCLC received neoadjuvant treatment based on the results of EBUS‐TBNA.
Conclusion
EBUS‐TBNA accurately evaluates station 10/11/12 LNs of both N1 and N3 disease. The diagnostic performances of EBUS‐TBNA for station 10/11/12 LNs seem to be comparable to those of EBUS‐TBNA for mediastinal LNs.
Keywords: endobronchial ultrasound‐guided transbronchial needle aspiration, hilar lymph nodes, lung cancer, mediastinum, staging
Among 889 LNs from 797 patients, the overall diagnostic sensitivity, specificity, accuracy, negative predictive value, and positive predictive value of EBUS‐TBNA for station 10/11/12 LNs were 95.7, 100, 97.3, 93.2, and 100%, respectively. EBUS‐TBNA accurately evaluates station 10/11/12 LNs of both N1 and N3 disease. The diagnostic performances of EBUS‐TBNA for station 10/11/12 LNs seem to be comparable to those of EBUS‐TBNA for mediastinal LNs.

INTRODUCTION
Primary lung cancer is the most common cause of cancer‐related death and has a 5‐year survival rate of only 19%. 1 Evaluation of nodal status in patients with primary lung cancer is an important step in the selection of appropriate treatment and in the prognosis. 2 However, noninvasive imaging studies such as chest computed tomography (CT) and positron emission tomography (PET)/CT are of low sensitivity and specificity and do not allow accurate nodal staging in patients with primary lung cancer. 3
Endobronchial ultrasound‐guided transbronchial needle aspiration (EBUS‐TBNA) is a minimally invasive technique that allows nodal staging under real‐time endobronchial ultrasonic guidance. 4 , 5 , 6 , 7 , 8 , 9 It is able to access not only the mediastinal lymph nodes (LNs) but also the hilar, interlobar, and lobar LNs, which are inaccessible by mediastinoscopy. 10 , 11 A prospective study performed by our group demonstrated that EBUS‐TBNA was superior to mediastinoscopy in terms of its diagnostic performance in mediastinal staging. 12 Moreover, in the preoperative staging of non‐small cell lung cancer, EBUS‐TBNA is the technique of choice for invasive mediastinal staging according to the joint guidelines of the European Society of Gastrointestinal Endoscopy, the European Respiratory Society, and the European Society of Thoracic Surgeons. 13 , 14
Invasive staging of hilar region LNs (stations 10/11/12) can be conducted by video‐associated thoracic surgery or open surgery with the patient under general anesthesia. 3 In contrast, EBUS‐TBNA enables access to the hilar regions in patients administered local anesthesia and conscious sedation, resulting in a lower complication rate than with surgical modalities. Nonetheless, few studies have examined the diagnostic performance of EBUS‐TBNA in the hilar region and the exact role of EBUS‐TBNA in patients with N1 or N3 disease is unclear. This study investigated the clinical utility and safety of EBUS‐TBNA in the diagnosis and staging of hilar, interlobar, and lobar LNs in patients with primary lung cancer.
METHODS
Design and patients
This was a retrospective analysis of a prospectively collected database compiled from patients with confirmed or suspected primary lung cancer who underwent EBUS‐TBNA for hilar, interlobar, and lobar LN assessment from January 2015 to December 2019 at Samsung Medical Center, a tertiary referral center in South Korea. This study includes the data of 10 patients which were previously published in 2020. 15 All patients underwent routine diagnostic evaluation, including physical examination, chest x‐ray, and laboratory tests, as well as either chest CT or integrated PET/CT prior to EBUS‐TBNA.
Among patients with benign (or nondiagnostic) LNs as determined using EBUS‐TBNA, (1) those who did not undergo surgical sampling or clinical follow‐up >6 months, or (2) who received chemotherapy, radiotherapy, and concurrent chemoradiotherapy were excluded from the final analyses.
All LNs were categorized into groups according to their station on the IASLC lymph node map, 16 their size, and their classifications with respect to the location of the primary tumor. The short and long axis diameters of the LNs was measured on a chest CT just before the EBUS‐TBNA procedure.
The study was approved by the Institutional Review Board of Samsung Medical Center (IRB No. 2020–07–160). The requirement for informed consent from patients was waived due to the retrospective nature of the study.
EBUS‐TBNA
EBUS‐TBNA procedures were performed by trained operators using a convex probe‐EBUS bronchoscope (BF‐UC260F‐OL8; Olympus) and a dedicated 22‐gauge needle (NA‐201SX‐4022; Olympus). The patients were under moderate sedation, achieved with intravenous midazolam and fentanyl. 12 , 17 Lidocaine was used for local anesthesia. Hilar, interlobar, and lobar LNs recognized by real‐time ultrasound were examined by the operator. When possible, we conducted three passes per node. When core tissue was obtained, at least two passes were conducted when possible. However, when we obtained enough core tissue at the first pass and the patient's condition was unstable, we prematurely terminated the procedure after the first pass.
Once the tissue core had been secured, it was blotted in filter paper to remove excess blood, fixed in formalin, and then the tissue coagulum clot was sent for histological examination. 18 Aspirate specimens were expelled onto glass slides, smeared, immediately fixed, and sent for cytological and/or histological examination. 17 Rapid on‐site cytopathological evaluation was not performed.
Information on EBUS‐TBNA‐related adverse events (e.g., bleeding, hypoxemia, etc) was also collected.
Pathological results of EBUS‐TBNA
All specimens sent for histological examination were analyzed by an experienced lung pathologist (JH). Malignancy was reported based on the presence of malignant cells or cells highly suspicious for malignancy. Benignancy was reported based on the absence of tumor cells on a background of lymphoid tissue. Samples showing only blood, mucus, benign bronchial epithelial cells, or lacking lymphoid tissue were considered inadequate and nondiagnostic. 17
Diagnostic standards
Malignancy was defined as cytopathological confirmation of a malignant finding using EBUS‐TBNA or mediastinal lymph node dissection. A benign finding determined via EBUS‐TBNA that nonetheless increased during follow‐up was also considered a malignancy.
Benignancy was defined as no evidence of malignancy in EBUS‐TBNA, with the results confirmed either surgically or, in the absence of surgical confirmation, by the absence of increase in size of LNs on chest CT scans during follow‐up period after EBUS‐TBNA.
Inadequate and nondiagnostic results in EBUS‐TBNA that were not subsequently assessed by surgical sampling or follow‐up were excluded from the analyses. Data on clinical outcomes were last updated on December 2021.
Statistical analysis
All data are reported as the number (%) for categorical variables and as the median (interquartile range [IQR]) for continuous variables. The diagnostic sensitivity, specificity, accuracy, positive predictive value (PPV), and NPV of EBUS‐TBNA were analyzed on a per‐nodal‐station basis using standard definitions. Comparison between nodal stations (10 vs. 11, 12), nodal sizes (<10 mm vs. ≥10 mm), and nodal classifications according to the primary tumor position (N1 vs. N3) were performed using Fishers' exact test or a chi‐square test. p‐values <0.05 were considered to indicate statistical significance. All statistical analyses were conducted using IBM SPSS Statistics version 27.0 (SPSS Inc.).
RESULTS
Baseline characteristics
Among the 1156 patients with confirmed or suspected primary lung cancer diagnosed between January 2015 and December 2019, 1344 hilar, interlobar, and lobar LNs were examined via EBUS‐TBNA. According to the inclusion and exclusion criteria, 889 LNs in 797 patients were ultimately included in the analyses. Among the LNs that were not determined to be malignant by EBUS‐TBNA, 244 LNs were underwent systemic LN dissection to determine the final pathological nodal staging (243 cases from “Benignancy by EBUS‐TBNA” and one case from “Nondiagnostic result by EBUS‐TBNA”) (Figure 1). Of 109 LNs with benign EBUS‐TBNA results which were not confirmed by systemic LN dissection and underwent clinical follow‐up with periodic chest CT scans, only one case had an increase in size of LN during a median follow‐up duration of 40.8 month (IQR, 25.3–54.8). Table 1 presents the baseline characteristics of 797 study patients. The median age was 65.3 (60–72) years and 72.6% were male. Adenocarcinoma was the most common histopathology (61.6%), followed by squamous cell carcinoma (25.5%). No serious complications occurred during any procedure in all patients.
FIGURE 1.
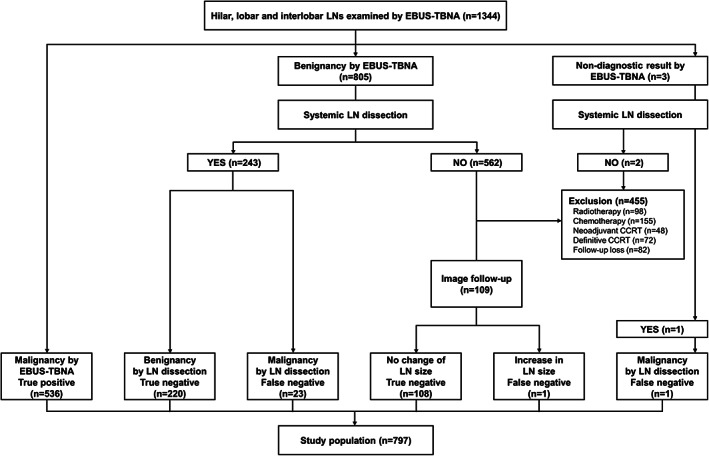
Flow diagram of hilar, lobar, and interlobar lymph nodes examined by EBUS‐TBNA in patients with primary lung cancer. CCRT, concurrent chemoradiotherapy; EBUS‐TBNA, endobronchial ultrasound‐guided transbronchial needle aspiration; LN, lymph node
TABLE 1.
Baseline characteristics of the study patients
| Variables | Total (N = 797) |
|---|---|
| Age, years | 65.3 (60–72) |
| Sex (male/female) | 579 (72.6)/218 (27.4) |
| Smoking history | |
| Nonsmoker | 234 (29.4) |
| Ex‐smoker | 323 (40.5) |
| Current smoker | 240 (30.1) |
| Tumor histology | |
| Adenocarcinoma | 491 (61.6) |
| Squamous cell carcinoma | 203 (25.5) |
| NSCLC, others a | 28 (3.5) |
| SCLC | 67 (8.4) |
| NSCLC + SCLC | 8 (1.0) |
| Clinical TNM stage b | |
| T stage | |
| T1 | 250 (31.4) |
| T2 | 337 (43.3) |
| T3 | 131 (16.4) |
| T4 | 79 (9.9) |
| N stage | |
| N0 | 29 (3.6) |
| N1 | 290 (36.4) |
| N2 | 255 (32.0) |
| N3 | 223 (28.0) |
| M stage | |
| M0 | 556 (69.8) |
| M1 | 241 (30.2) |
| Clinical stage | |
| Stage I | 17 (2.1) |
| Stage II | 210 (26.4) |
| Stage III | 329 (41.3) |
| Stage IV | 241 (30.2) |
Note: Data are presented as n (%) or as median (interquartile range).
Abbreviations: NSCLC, non‐small cell lung carcinoma; SCLC, small cell lung carcinoma.
Adenosquamous carcinoma, large cell carcinoma, pleomorphic carcinoma, and spindle cell carcinoma.
The eighth edition of the American Joint Committee on Cancer TNM staging system was used for patients with SCLC.
Characteristics of examined LNs
The characteristics of the 889 LNs included in the analyses are listed in Table 2. The right superior interlobar LNs (11Rs) were the most commonly involved (36.2%), followed by the left interlobar LNs (11L) (33.8%). Among the 889 LNs, 556 were located on the right side (62.6%) and 333 were on the left side (37.4%). In relation to the primary tumor location, ipsilateral hilar, interlobar, or lobar LNs were classified as N1 (n = 756, 85%) and contralateral hilar, interlobar, or lobar LNs were N3 (n = 133, 15%). The median short‐axis diameter of the LNs was 11.4 (8–14) mm and the median number of needle passes per LN was 1.7 (1, 2). Core tissues were obtained in 99.2% of the LNs examined via EBUS‐TBNA.
TABLE 2.
Characteristics of the lymph nodes included in the diagnostic performance analyses
| Variables | Total (n = 889) |
|---|---|
| Nodal station | |
| 10L | 23 (2.6) |
| 10R | 32 (3.6) |
| 11L | 300 (33.8) |
| 11Ri | 195 (21.9) |
| 11Rs | 322 (36.2) |
| 12L | 10 (1.1) |
| 12R | 7 (0.8) |
| Left vs. right‐sided lymph nodes | |
| Left | 333 (37.5) |
| Right | 556 (62.5) |
| N1 vs. N3 position in relation to primary tumor location | |
| N1 position | 756 (85) |
| N3 position | 133 (15) |
| Size of lymph node, mm | |
| Short‐axis diameter | 11.40 (8–14) |
| Long‐axis diameter | 15.25 (10–19) |
| Number of needle passes per lymph node | 1.72 (1–2) |
| Acquisition of tissue core | 882 (99.2) |
Note: Data are presented as n (%) or as median (interquartile range).
Diagnostic performance analyses
The overall diagnostic sensitivity, specificity, accuracy, NPV, and PPV of EBUS‐TBNA for hilar, interlobar, and lobar LNs were 95.7, 100, 97.3, 93.2, and 100%, respectively. The NPVs of the left and right hilar LNs (10L, 10R) were relatively low, 83.3 and 81.8%, respectively (Table 3).
TABLE 3.
Diagnostic performances of EBUS‐TBNA at each nodal station
| Nodal station | Number | Sensitivity (%) (n/N) | Specificity (%) (n/N) | Accuracy (%) (n/N) | NPV (%) (n/N) | PPV (%) (n/N) | Prevalence of metastasis (%) (n/N) |
|---|---|---|---|---|---|---|---|
| Total | 889 | 95.7 (536/560) | 100 (329/329) | 97.3 (865/889) | 93.2 (329/353) | 100 (536/536) | 63.0 (560/889) |
| 10L | 23 | 94.4 (17/18) | 100 (5/5) | 95.7 (22/23) | 83.3 (5/6) | 100 (17/17) | 78.3 (18/23) |
| 10R | 32 | 91.3 (21/23) | 100 (9/9) | 93.8 (30/32) | 81.8 (9/11) | 100 (21/21) | 71.9 (23/32) |
| 11L | 300 | 95.6 (175/183) | 100 (117/117) | 97.3 (292/300) | 93.6 (117/125) | 100 (175/175) | 61.0 (183/300) |
| 11Ri | 195 | 96.9 (125/129) | 100 (66/66) | 97.9 (191/195) | 94.3 (66/70) | 100 (125/125) | 66.2 (129/195) |
| 11Rs | 322 | 95.3 (181/190) | 100 (132/132) | 97.2 (313/322) | 93.6 (132/141) | 100 (181/181) | 59.0 (190/322) |
| 12L | 10 | 100 (10/10) | N/A | 100 (10/10) | N/A | 100 (10/10) | 100 (10/10) |
| 12R | 7 | 100 (7/7) | N/A | 100 (7/7) | N/A | 100 (7/7) | 100 (7/7) |
Abbreviations: EBUS‐TBNA, endobronchial ultrasound‐guided transbronchial needle aspiration; N/A, not applicable; NPV, negative predictive value; PPV, positive predictive value.
When LNs were categorized into the hilar node group (10) and interlobar/lobar node group (11/12), the two groups did not significantly differ with respect to the diagnostic performances of EBUS‐TBNA (Table 4). Moreover, there were no significant differences in the diagnostic sensitivity, accuracy, and NPV of EBUS‐TBNA between LNs on the left versus the right side LNs (Table 4). Among 133 contralateral station 10/11/12 LNs in 125 patients, 32 malignant LNs were identified in 32 patients via EBUS‐TBNA. N3 disease was confirmed via EBUS‐TBNA for station 10/11/12 LNs in 4.0% (32/797) of the study patients. The diagnostic sensitivity and specificity were not significantly different between N3 disease (100 and 100%) and N1 disease (95.5 and 100%) (p = 0.221 and N/A, respectively) (Table 4).
TABLE 4.
Diagnostic performances of EBUS‐TBNA according to nodal group
| Nodal groups | Number | Sensitivity (%) (n/N) | Specificity (%) (n/N) | Accuracy (%) (n/N) | NPV (%) (n/N) | PPV (%) (n/N) | Prevalence of metastasis (%) (n/N) |
|---|---|---|---|---|---|---|---|
| Nodal station 10 vs. 11/12 | |||||||
| 10 | 55 | 95.7 (38/41) | 100 (14/14) | 94.5 (52/55) | 82.4 (14/17) | 100 (38/38) | 74.5 (41/55) |
| 11/12 | 834 | 96.0 (498/519) | 100 (315/315) | 97.5 (813/834) | 93.8 (315/336) | 100 (498/498) | 62.2 (519/834) |
| p value | 0.925 | N/A | 0.183 | 0.068 | N/A | 0.067 | |
| Left‐ vs. right‐sided lymph nodes | |||||||
| Left | 333 | 95.7 (202/211) | 100 (122/122) | 97.3 (324/333) | 93.1 (122/131) | 100 (202/202) | 63.4 (211/333) |
| Right | 556 | 95.7 (334/349) | 100 (207/207) | 97.3 (541/556) | 93.2 (207/222) | 100 (334/334) | 62.8 (349/556) |
| p‐value | >0.999 | N/A | >0.999 | 0.971 | N/A | 0.858 | |
| N1 vs. N3 position | |||||||
| N1 position | 756 | 95.5 (504/528) | 100 (228/228) | 96.8 (732/756) | 90.5 (228/252) | 100 (504/504) | 69.8 (528/756) |
| N3 position | 133 | 100 (32/32) | 100 (101/101) | 100 (133/133) | 100 (101/101) | 100 (32/32) | 24.1 (32/133) |
| p‐value | 0.221 | N/A | 0.037 | 0.001 | N/A | <0.001 | |
Abbreviations: EBUS‐TBNA, endobronchial ultrasound‐guided transbronchial needle aspiration; N/A, not applicable; NPV, negative predictive value; PPV, positive predictive value.
Diagnostic performances according to nodal size were assessed by categorizing the LNs according to their short‐axis diameter. Only one false‐negative result was determined in the ≥20 mm group, and the diagnostic sensitivity and accuracy were 98.9 and 98.9%, respectively. The diagnostic sensitivity was significantly lower for LN <10 mm (90.1%) than for those ≥10 mm (97.8%) (p < 0.001) (Table 5).
TABLE 5.
Diagnostic performances of EBUS‐TBNA according to nodal size
| Short axis diameter of lymph node | Number | Sensitivity (%) (n/N) | Specificity (%) (n/N) | Accuracy (%) (n/N) | NPV (%) (n/N) | PPV (%) (n/N) | Prevalence of metastasis (%) (n/N) |
|---|---|---|---|---|---|---|---|
| Size < 10 mm | 380 | 90.1 (136/151) | 100 (229/229) | 96.1 (365/380) | 93.9 (229/244) | 100 (136/136) | 39.7 (151/380) |
| 10 mm ≤ size < 20 mm | 419 | 97.5 (311/319) | 100 (100/100) | 98.1 (411/419) | 92.6 (100/108) | 100 (311/311) | 76.1 (319/419) |
| Size ≥ 20 mm | 90 | 98.9 (89/90) | N/A | 98.9 (89/90) | 0 (0/1) | 100 (89/89) | 100 (90/90) |
| p‐value | <0.001ac | N/A | 0.128 | 0.062 | N/A | <0.001 a , b , c | |
| Size <10 mm | 380 | 90.1 (136/151) | 100 (229/229) | 96.1 (365/380) | 93.9 (229/244) | 100 (136/136) | 39.7 (151/380) |
| Size ≥10 mm | 509 | 97.8 (400/409) | 100 (100/100) | 98.2 (500/509) | 91.7 (100/109) | 100 (400/400) | 80.4 (409/509) |
| p‐value | <0.001 | N/A | 0.056 | 0.48 | N/A | <0.001 |
Abbreviations: EBUS‐TBNA, endobronchial ultrasound‐guided transbronchial needle aspiration; N/A, not applicable; NPV, negative predictive value; PPV, positive predictive value.
Size < 10 mm vs. 10 mm ≤ size < 20 mm.
10 mm ≤ Size < 20 mm vs. size ≥ 20 mm.
Size < 10 mm vs. size ≥ 20 mm.
Impact of EBUS‐TBNA results on treatment decision
In this study, among 91 subjects with cN1 NSCLC which were confirmed by EBUS‐TBNA, eight (8/91, 8.8%) patients received neoadjuvant therapy before surgery. Among 32 histologically proven cN3 LNs, 18 were confirmed only by EBUS‐TBNA. In two patients without distant metastasis, a change in treatment from surgery to definitive chemoradiation therapy was made after the confirmation of cN3 by EBUS‐TBNA.
DISCUSSION
This study investigated the diagnostic performances of EBUS‐TBNA for hilar, interlobar, and lobar LNs in patients with primary lung cancer. The overall diagnostic sensitivity, specificity, accuracy, NPV, and PPV of EBUS‐TBNA for station 10/11/12 LNs were 95.7, 100, 97.3, 93.2, and 100%, respectively. Diagnostic sensitivity was significantly associated with nodal size (<10 mm vs. ≥10 mm). However, diagnostic sensitivity was not significantly different between the N3 vs. N1 status. To the best of our knowledge, our study, based on an assessment of 887 LNs, is the largest to investigate the diagnostic performances of EBUS‐TBNA for hilar, interlobar, and lobar LNs.
EBUS‐TBNA has been widely used for the diagnosis and staging of mediastinal LNs since its introduction. Pooled diagnostic sensitivity, specificity, NPV and PPV of EBUS‐TBNA for the mediastinal LNs including both prospective and retrospective studies are 89, 100, 86 and 100%, respectively. 3 Therefore, the diagnostic performances of EBUS‐TBNA for hilar, interlobar, and lobar LNs in our study seem to be comparable to those of EBUS‐TBNA for mediastinal LNs in historical controls. Ernst et al. also showed similar results in a previous study that exclusively evaluated the diagnostic performance of EBUS‐TBNA for 229 hilar or interlobar LNs; the diagnostic sensitivity and specificity were 91 and 100%. 11
The diagnostic sensitivity differed depending on the nodal size and was lower for LNs <10 mm than for those ≥10 mm. However, in a previous study that evaluated a total of 485 mediastinal and hilar LNs using EBUS‐TBNA, the similar diagnostic sensitivity was reported for LNs <10 mm, 10–20 mm, and >20 mm (all >92%). 19 In our study, the diagnostic sensitivity of <10 mm LNs was still >90% and LNs ≥20 mm in size (n = 90) were all malignant, including one false‐negative result. In this study, the NPV of station 10 LNs (82.4%) was lower than that of station 11/12 LNs (93.8%). There were 24 false‐negative results in our cohort, occurring in three (5.4%) of 55 LNs at station 10 and 21 (2.5%) of 834 LNs at station 11/12. The lower NPV of station 10 LNs can be partly explained by the greater technical difficulty accessing station 10 than station 11 or 12.
The diagnostic sensitivity, specificity, accuracy, and NPV for the N1 nodal group were 95.5, 100, 96.8, and 90.5%, respectively. Patients with multiple N1 disease have a worse prognosis than those with a single N1 nodal metastasis. 20 A previous study found that hilar pN1 disease had a worse prognosis than peripheral pN1 disease and that intralobar pN1 behaved similar to pN0, while the prognosis for hilar pN1 disease was similar to that of single‐station pN2 disease. 21 Accurate assessment of the hilar, interlobar, and lobar LNs may therefore guide the selection of appropriate treatments and predict prognosis. 22 , 23
EBUS‐TBNA for ipsilateral hilar area LNs can be used to differentiate cN1 from cN0 and to guide neoadjuvant therapy before surgery in patients with NSCLC. In this study, eight of 91 patients with cN1 NSCLC received neoadjuvant treatment based on the results of EBUS‐TBNA. Further prospective studies are need in the future to elucidate the exact role of EBUS‐TBNA in the neoadjuvant therapy of patients with cN1 NSCLC.
EBUS‐TBNA has been used to evaluate contralateral hilar, interlobar, and lobar LNs 10 , 11 although its exact role in the evaluation of the contralateral hilar region (N3 disease) is unclear. During surgical LN dissection, only the ipsilateral mediastinal and hilar LNs are typically examined, not the contralateral hilar LNs. In previous comparisons of the diagnostic performances of EBUS versus that of mediastinoscopy, stations 2, 4, and 7 but not stations 10, 11, and 12 LNs were examined. 12 , 24 , 25 , 26 However, N3 disease was confirmed via EBUS‐TBNA in 4.0% (32/797) of our patients. Among the 133 contralateral hilar regions LNs, 32 were determined to be malignant and 101 were benign. Malignant N3 LNs had a median short‐axis diameter of 10.7 (8–12) mm, and 53.1% (17/32) of LNs confirmed as N3 were <10 mm in their short‐axis diameter. Three (9.7%) of 31 malignant N3 LNs evaluated by PET/CT had no 18F‐fluorodeoxyglucose (FDG) uptake. Among 32 malignant N3 LNs, 18 were histologically confirmed as N3 disease only by EBUS‐TBNA. In two patients without distant metastasis, a change in treatment from surgery to definitive chemoradiation therapy was made after the confirmation of hilar regions N3 disease by EBUS‐TBNA. Based on these results, the examination of the contralateral stations 10/11/12 LNs which are enlarged on CT scans or had FDG uptake on PET/CT scans should be considered to exclude N3 disease in patients undergoing EBUS‐TBNA for nodal staging purposes.
There were several limitations to our study. First, it was conducted at a tertiary referral center with a large volume of patients, and our group has >10 years of experience for EBUS‐TBNA (>9000 cases). Therefore, our data should be interpreted conservatively, as the diagnostic performance of EBUS‐TBNA may be lower at smaller centers or with less experienced groups. Moreover, the prevalence of LNs metastasis was as high as 63% in our study. Therefore, the results of our study may not be generalized to populations with low prevalence of metastasis. Second, in this study, among the LNs of benign or nondiagnostic results via EBUS‐TBNA (n = 808), we only included the LNs which underwent surgical sampling (n = 244) or clinical follow‐up (n = 109) (Figure 1). Therefore, there is a possibility of selection bias due to excluded LNs (n = 455). However, 109 LNs with negative EBUS‐TBNA results and clinical follow‐up underwent periodic chest CT scans to exclude the possibility of false negative results. One LN was determined as benign via EBUS‐TBNA but increased in size from 8*9 mm (short and long axis diameter) at the time of EBUS‐TBNA to 17*25 mm after 9 months after EBUS‐TBNA. This case was thus classified as a false‐negative. Third, the role of routine sampling for LNs in the contralateral hilar region during nodal staging in EBUS‐TBNA is still uncertain and remains to be determined in a multicenter prospective study. Fourth, although accuracy and NPV were statistically higher in N3 LNs (100.0 and 100.0%) than N1 LNs (96.8 and 90.5%) (p = 0.037 and p = 0.001, respectively), a caution is needed in the interpretation of these results. In this study, the benignity of N3 position (n = 101) was judged by the clinical follow‐up only (n = 101) since surgical evaluation of N3 position was not possible. However, the benignity of N1 position (n = 228) was judged by the surgical lymph node dissection (n = 220) and the clinical follow‐up (n = 8). Although we tried our best to find the false negative case at N3 position, there was a possibility that NPV and accuracy of EBUS‐TBNA for N3 position might be slightly overestimated. When we only included the cases with “Malignancy by EBUS‐TBNA (n = 536)” and “Benignancy and nondiagnostic results by EBUS‐TBNA which were further verified by systemic LN dissection (n = 244),” the diagnostic performances were as follows; sensitivity 95.7%, specificity 100.0%, accuracy 96.9%, PPV 100%, and NPV 90.2%. Diagnostic sensitivity, specificity, accuracy, and PPV were similar to those of an original analysis which also included clinical follow‐up cases. However, NPV were slightly lower than that of the original analysis (90.2 vs. 93.2%). The difference in false‐negative results between surgical LN dissection and clinical follow‐up with chest CT scans seems to stem from their different abilities to determine the malignancy of intrathoracic LNs. In previous studies, NPVs of chest CT scans in the diagnosis of intrathoracic LN metastasis were only 70.0%–87.5%, which were relatively lower than those of invasive diagnostic modalities. 27 , 28
In conclusion, EBUS‐TBNA is an excellent modality for evaluating hilar, interlobar, and lobar LNs with N1 and N3 status in patients with primary lung cancer. The diagnostic performances of EBUS‐TBNA for hilar, interlobar, and lobar LNs seem to be comparable to those of EBUS‐TBNA for mediastinal LNs.
FUNDING INFORMATION
This work was supported by the National Research Foundation of Korea (NRF) grant funded by the Korea government (MSIT) (2020R1A2C2006282).
CONFLICT OF INTEREST
The authors have no conflicts of interest to declare.
ACKNOWLEDGMENTS
The authors would like to thank the Statistics and Data Center, Research Institute for Future Medicine of Samsung Medical Center for the statistical analysis.
Wi S, Kim B‐G, Shin SH, Jhun BW, Yoo H, Jeong B‐H, et al. Clinical utility of EBUS‐TBNA of hilar, interlobar, and lobar lymph nodes in patients with primary lung cancer. Thorac Cancer. 2022;13(17):2507–2514. 10.1111/1759-7714.14587
Seungbum Wi and Bo‐Guen Kim contributed equally to this article.
Funding information National Research Foundation of Korea (NRF), Grant/Award Number: 2020R1A2C2006282
REFERENCES
- 1. Siegel RL, Miller KD, Jemal A. Cancer statistics, 2020. CA Cancer J Clin. 2020;70:7–30. [DOI] [PubMed] [Google Scholar]
- 2. Asamura H, Chansky K, Crowley J, Goldstraw P, Rusch VW, Vansteenkiste JF, et al. The International Association for the Study of Lung Cancer lung cancer staging project: proposals for the revision of the N descriptors in the forthcoming 8th edition of the TNM classification for lung cancer. J Thorac Oncol. 2015;10:1675–84. [DOI] [PubMed] [Google Scholar]
- 3. Silvestri GA, Gonzalez AV, Jantz MA, Margolis ML, Gould MK, Tanoue LT, et al. Methods for staging non‐small cell lung cancer: diagnosis and management of lung cancer, 3rd ed: American College of Chest Physicians evidence‐based clinical practice guidelines. Chest. 2013;143:e211S–e50S. [DOI] [PubMed] [Google Scholar]
- 4. Yasufuku K, Chiyo M, Sekine Y, Chhajed PN, Shibuya K, Iizasa T, et al. Real‐time endobronchial ultrasound‐guided transbronchial needle aspiration of mediastinal and hilar lymph nodes. Chest. 2004;126:122–8. [DOI] [PubMed] [Google Scholar]
- 5. Herth FJ, Eberhardt R, Vilmann P, Krasnik M, Ernst A. Real‐time endobronchial ultrasound guided transbronchial needle aspiration for sampling mediastinal lymph nodes. Thorax. 2006;61:795–8. [DOI] [PMC free article] [PubMed] [Google Scholar]
- 6. Varela‐Lema L, Fernández‐Villar A, Ruano‐Ravina A. Effectiveness and safety of endobronchial ultrasound‐transbronchial needle aspiration: a systematic review. Eur Respir J. 2009;33:1156–64. [DOI] [PubMed] [Google Scholar]
- 7. Fujiwara T, Yasufuku K, Nakajima T, Chiyo M, Yoshida S, Suzuki M, et al. The utility of sonographic features during endobronchial ultrasound‐guided transbronchial needle aspiration for lymph node staging in patients with lung cancer: a standard endobronchial ultrasound image classification system. Chest. 2010;138:641–7. [DOI] [PubMed] [Google Scholar]
- 8. Lee K, Um S‐W. Minimally invasive mediastinal staging of non‐small cell lung cancer. Precis Future Med. 2018;2:18–26. [Google Scholar]
- 9. Lee HS, Lee GK, Lee HS, Kim MS, Lee JM, Kim HY, et al. Real‐time endobronchial ultrasound‐guided transbronchial needle aspiration in mediastinal staging of non‐small cell lung cancer: how many aspirations per target lymph node station? Chest. 2008;134:368–74. [DOI] [PubMed] [Google Scholar]
- 10. Yasufuku K, Nakajima T, Chiyo M, Sekine Y, Shibuya K, Fujisawa T. Endobronchial ultrasonography: current status and future directions. J Thorac Oncol. 2007;2:970–9. [DOI] [PubMed] [Google Scholar]
- 11. Ernst A, Eberhardt R, Krasnik M, Herth FJ. Efficacy of endobronchial ultrasound‐guided transbronchial needle aspiration of hilar lymph nodes for diagnosing and staging cancer. J Thorac Oncol. 2009;4:947–50. [DOI] [PubMed] [Google Scholar]
- 12. Um SW, Kim HK, Jung SH, Han J, Lee KJ, Park HY, et al. Endobronchial ultrasound versus mediastinoscopy for mediastinal nodal staging of non‐small‐cell lung cancer. J Thorac Oncol. 2015;10:331–7. [DOI] [PubMed] [Google Scholar]
- 13. De Leyn P, Dooms C, Kuzdzal J, Lardinois D, Passlick B, Rami‐Porta R, et al. Revised ESTS guidelines for preoperative mediastinal lymph node staging for non‐small‐cell lung cancer. Eur J Cardiothorac Surg. 2014;45:787–98. [DOI] [PubMed] [Google Scholar]
- 14. Vilmann P, Clementsen PF, Colella S, Siemsen M, de Leyn P, Dumonceau JM, et al. Combined endobronchial and esophageal endosonography for the diagnosis and staging of lung cancer: European Society of Gastrointestinal Endoscopy (ESGE) guideline, in cooperation with the European Respiratory Society (ERS) and the European Society of Thoracic Surgeons (ESTS). Endoscopy. 2015;47:545–59. [DOI] [PubMed] [Google Scholar]
- 15. Shin SH, Jeong BH, Jhun BW, Yoo H, Lee K, Kim H, et al. The utility of endosonography for mediastinal staging of non‐small cell lung cancer in patients with radiological N0 disease. Lung Cancer. 2020;139:151–6. [DOI] [PubMed] [Google Scholar]
- 16. Giroux DJ, Rami‐Porta R, Chansky K, Crowley JJ, Groome PA, Postmus PE, et al. The IASLC lung cancer staging project: data elements for the prospective project. J Thorac Oncol. 2009;4:679–83. [DOI] [PubMed] [Google Scholar]
- 17. Jhun BW, Park HY, Jeon K, Koh WJ, Suh GY, Chung MP, et al. Nodal stations and diagnostic performances of endobronchial ultrasound‐guided transbronchial needle aspiration in patients with non‐small cell lung cancer. J Korean Med Sci. 2012;27:46–51. [DOI] [PMC free article] [PubMed] [Google Scholar]
- 18. Ko RE, Jeong BH, Huh HJ, Lee NY, Yoo H, Jhun BW, et al. Clinical usefulness of fungal culture of EBUS‐TBNA needle rinse fluid and Core tissue. Yonsei Med J. 2020;61:670–8. [DOI] [PMC free article] [PubMed] [Google Scholar]
- 19. Marchand C, Medford ARL. Relationship between endobronchial ultrasound‐guided (EBUS)‐transbronchial needle aspiration utility and computed tomography staging, node size at EBUS, and positron emission tomography scan node standard uptake values: a retrospective analysis. Thorac Cancer. 2017;8:285–90. [DOI] [PMC free article] [PubMed] [Google Scholar]
- 20. Rusch VW, Crowley J, Giroux DJ, Goldstraw P, Im JG, Tsuboi M, et al. The IASLC lung cancer staging project: proposals for the revision of the N descriptors in the forthcoming seventh edition of the TNM classification for lung cancer. J Thorac Oncol. 2007;2:603–12. [DOI] [PubMed] [Google Scholar]
- 21. Obiols C, Call S, Rami‐Porta R, Trujillo‐Reyes JC, Saumench R, Iglesias M, et al. Survival of patients with unsuspected pN2 non‐small cell lung cancer after an accurate preoperative mediastinal staging. Ann Thorac Surg. 2014;97:957–64. [DOI] [PubMed] [Google Scholar]
- 22. Yasufuku K, Nakajima T, Waddell T, Keshavjee S, Yoshino I. Endobronchial ultrasound‐guided transbronchial needle aspiration for differentiating N0 versus N1 lung cancer. Ann Thorac Surg. 2013;96:1756–60. [DOI] [PubMed] [Google Scholar]
- 23. Murgu SD. Diagnosing and staging lung cancer involving the mediastinum. Chest. 2015;147:1401–12. [DOI] [PubMed] [Google Scholar]
- 24. Ernst A, Anantham D, Eberhardt R, Krasnik M, Herth FJ. Diagnosis of mediastinal adenopathy‐real‐time endobronchial ultrasound guided needle aspiration versus mediastinoscopy. J Thorac Oncol. 2008;3:577–82. [DOI] [PubMed] [Google Scholar]
- 25. Annema JT, van Meerbeeck JP, Rintoul RC, Dooms C, Deschepper E, Dekkers OM, et al. Mediastinoscopy vs endosonography for mediastinal nodal staging of lung cancer: a randomized trial. JAMA. 2010;304:2245–52. [DOI] [PubMed] [Google Scholar]
- 26. Yasufuku K, Pierre A, Darling G, de Perrot M, Waddell T, Johnston M, et al. A prospective controlled trial of endobronchial ultrasound‐guided transbronchial needle aspiration compared with mediastinoscopy for mediastinal lymph node staging of lung cancer. J Thorac Cardiovasc Surg. 2011;142:1393–400.e1. [DOI] [PubMed] [Google Scholar]
- 27. Fritscher‐Ravens A, Bohuslavizki KH, Brandt L, Bobrowski C, Lund C, Kno¨fel WT, et al. Mediastinal lymph node involvement in potentially resectable lung cancer: comparison of CT, positron emission tomography, and endoscopic ultrasonography with and without fine‐needle aspiration. Chest. 2003;123:442–51. [DOI] [PubMed] [Google Scholar]
- 28. Yasufuku K, Nakajima T, Motoori K, Sekine Y, Shibuya K, Hiroshima K, et al. Comparison of endobronchial ultrasound, positron emission tomography, and CT for lymph node staging of lung cancer. Chest. 2006;130:710–8. [DOI] [PubMed] [Google Scholar]