

Abstract
Objectives
To systematically review studies using remote ischemia postconditioning (RIPostC) for ischemic stroke in experimental models and obtain factors that significantly influence treatment outcomes.
Materials and Methods
Peer‐reviewed studies were identified and selected based on the eligibility criteria, followed by extraction of data on potentially influential factors related to model preparation, postconditioning, and measure time based on outcome measures including infarct size, neurological scales, and cell tests with autophagy, apoptosis, normal‐neuron, and damaged‐neuron counting. Then, all data were preprocessed, grouped, and meta‐analyzed with the indicator of the standardized mean difference.
Results
Fifty‐seven studies with 224 experiments (91 for infarct size, 92 for neurological scales, and 41 for cell‐level tests) were included. There was little statistical difference between different model preparations, treated body parts, number of treatments, and sides. And treatment effect was generally a positive correlation with the duration of conditioning time to stroke onset with exceptions at some time points. Based on infarct size, the number of cycles per treatment, duration of occlusion, and release per cycle showed significant differences. Combined with the effect sizes by other measures, the occlusion/release duration of 8–10 min per cycle is better than 5 min, and three cycles per treatment were most frequently used with good effects. Effect also varied when measuring at different times, showing statistical differences in infarct size and most neurological scales. RIPostC is confirmed as an effective therapeutic intervention for ischemic stroke, while the RIPostC‐mediated autophagy level being activated or inhibited remained conflicting.
Conclusions
Conditioning time, number of cycles per treatment, duration of occlusion, and release per cycle were found to influence the treatment effects of RIPostC significantly. More studies on the relevant influential factors and autophagy mechanisms are warranted.
Keywords: experimental models, ischemia, meta‐analysis, remote ischemic postconditioning, stroke
Studies on remote ischemia postconditioning (RIPostC) for ischemic stroke have been conducted in experimental models for over a decade, but lacking a systematic review makes it unclear which combination of conditioning parameters achieves better efficacy and which measures better reflect treatment effect and disease progression. Our study focused on the therapeutic effect of RIPostC on acute ischemic stroke based on experimental models, using meta‐analysis to quantitatively assess as many potential influencing factors as possible by various outcome measures.

1. INTRODUCTION
The strategy of ischemic postconditioning (IPostC) initially originated in the field of cardiovascular diseases 1 was then successfully applied to other clinical areas including liver 2 and cerebral disorders. 3 Studies have suggested that IPostC, consisting of several short, nonlethal periods of ischemia and reperfusion following an ischemia event, has a protective effect on multi‐organs 4 by reducing the ischemia/reperfusion (I/R) injury induced by organ transplantation 5 or vascular occlusion. 3 , 6 In addition to IPostC, there are also ischemic preconditioning (IPreC, performed prior to ischemia in an organ) and ischemic perconditioning (IPerC, performed during an ischemia event). And IPostC can be further divided into in situ ischemic postconditioning (ISIPostC) and remote ischemic postconditioning (RIPostC) depending on the site of intervention. 7 All kinds of above‐mentioned conditioning methods play their respective parts in studying endogenous survival and protection mechanisms of multi‐organs involving multiple processes, but RIPostC has its own distinct strengths over others in the field of ischemic stroke. Firstly, RIPostC is considered as a feasible and promising therapeutic intervention in stroke, not just for mechanism research. In contrast, since the occurrence of stroke is unpredictable, IPreC has the issue of timeliness, which makes it hard to be a viable approach but may be used for the prevention of stroke in high‐risk groups. 8 Secondly, the intervention site of RIPostC is usually selected on the limb, also known as remote limb ischemic postconditioning (RLIPostC), which owns the advantages of noninvasion or less invasion, inexpensiveness, and convenience. 4
The research on RIPostC for ischemic stroke has been conducted in experimental models for over a decade, accumulating a large number of published scientific articles, 3 , 6 , 9 and some institutions even conducted the clinical randomized trials. 10 , 11 However, studies designed different schemes of RIPostC and utilized various outcome measures according to their research objectives. This results in the reliability and credibility of the conclusions drawn from individual original research articles only with a few animals are limited, making it difficult to translate into valid guidance for clinical practice. At present, the absence of a systematic analysis and summary of these articles makes it unclear which RIPostC options are most effective for stroke recovery and which measures better reflect treatment effect and disease progression. Weir et al. 9 have meta‐analyzed the relevant literatures on remote ischemic conditioning in experimental stroke, yet the content which was relatively general and poorly targeted containing not only IPostC but also IPreC. The inclusion of factors likely to impact the effects of RIPostC in their study was not all‐sided enough, and effect sizes were calculated based on common measures, without consideration of conditioning time, measure time, and some cell‐level tests like apoptosis and autophagy.
Our study mainly focused on the therapeutic effect of RIPostC on acute ischemic stroke based on experimental models, using meta‐analysis approaches to quantitatively assess as many potential influencing factors as possible by multidimensional outcome measures including three aspects. Besides the commonly used infarct size and neurological scales, the measure indicators particularly added some cell‐level tests including normal‐neuron density, damaged‐neuron counting, autophagy, and apoptosis. Nevertheless, since neuron death involves multiple sophisticated and interacted cell signaling pathways, with the associated mechanisms not fully understood, 3 , 7 the most symbolic biomarkers and detection methods were selected in the study rather than pathway‐specific molecules or factors for statistics.
2. MATERIALS AND METHODS
2.1. Search strategy
Peer‐reviewed research articles published before January 2021 were searched in PubMed, Web of Science, and Google Scholar for English language, with CNKI, CQVIP, and Wanfang for Chinese language. Search keywords contained three aspects, including stroke (“stroke” or “acute stroke” or “apoplexy” or “ischemia” or “cerebral ischemia” or “cerebrovascular accident”), experimental model (“model” or “experimental model” or “animal”), and remote ischemic postconditioning (“RIP” or “RIPerC” or “RIPostC” or “remote ischemic postconditioning” or “remote ischemic perconditioning”), and search terms were adjusted for the different search engines. We also consulted reference lists of relevant reviews and studies to identify additional articles.
2.2. Study selection
The identified studies were screened and selected based on specific criteria through different phases in line with the Preferred Reporting Items for Systematic Reviews and Meta‐Analyses (PRISRMA) Statement 12 (Figure 1). Firstly, the records from different sources were integrated and duplicates were removed, then those unrelated to the topic were excluded by screening their abstracts and titles. Next, the full‐text articles of all candidate records were required as much as possible, which were further assessed for eligibility, and the abstract‐only records were also excluded. The eligibility criteria are summarized as follows:
Article type: research article, not literature review;
Study subject: experimental model of animal, not human being;
Study design: randomized study with treatment and control groups;
Disease model: acute ischemic stroke model, not chronic ischemia, hemorrhage, or other brain injury;
Treatment: including the trials only administered by RIPostC, not in combination with others, and RIPostC conducted in the limbs instead of others such as gastric artery;
Outcome measures (Figure 2): containing at least one of the measures of neurological scales, infarct size, and indicators of cell level including autophagy (terminal deoxynucleotidyl transferase dUTP nick end labeling, TUNEL), apoptosis (microtubule‐associated protein 1A light‐chain 3‐II level, LC3‐II; LC3‐II/LC3‐I ratio), normal‐neuron density (thionine staining and immunohistochemistry for neuronal nuclei, NeuN; Nissl staining), and damaged‐neuron counting (hematoxylin and eosin staining, H&E);
Data: having corresponding data or figures of the above categories and data consistency in the article;
Language: written in English or Chinese.
FIGURE 1.
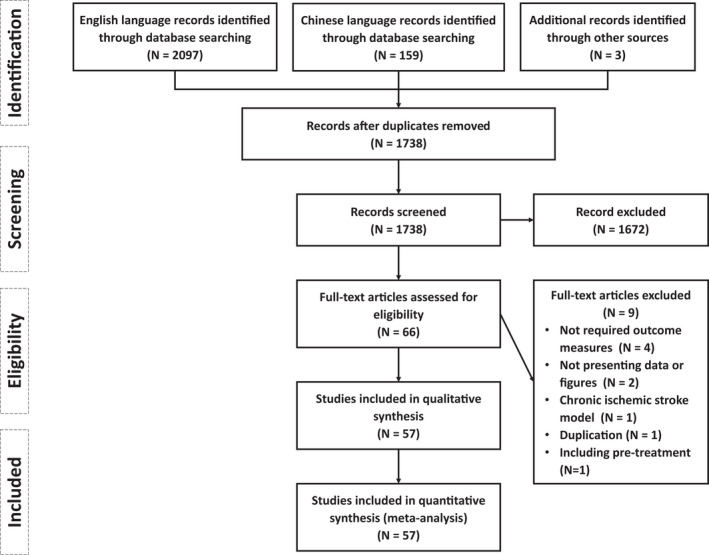
Flow chart of study and information through the different phases based on PRISMA Statement
FIGURE 2.
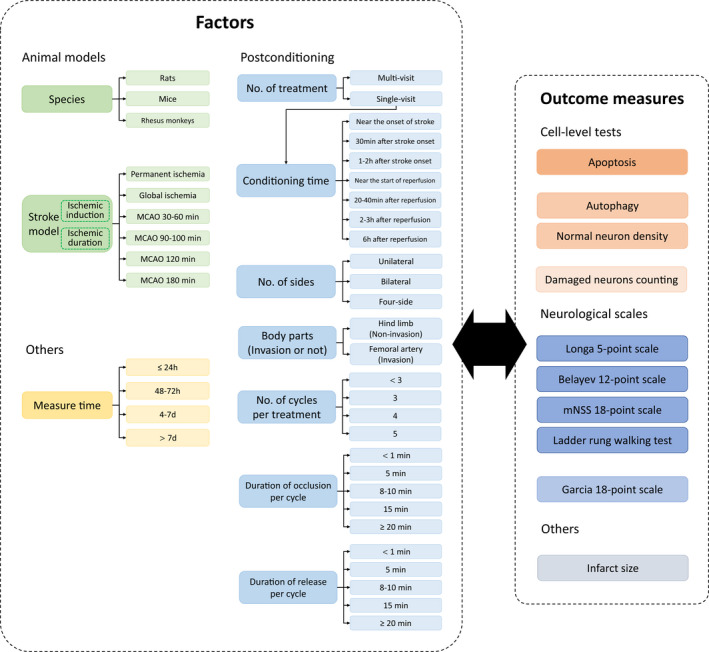
Summary of factors and outcome measures. The factors include the categories of animal model (green), postconditioning (sky blue), and measure time (yellow). Notably, measure time actually cannot influence the real treatment effect but likely affects the outcome measures, so we included it and recorded the measure time points with the stroke onset as a reference; the factor of conditioning time is only in the subgroup of single‐visit treatment because multi‐visit treatments have multiple times of conditioning, which are difficult to count and of little significance. Outcome measures contain cell‐level tests (orange), neurological scales (dark blue), and infarct size (gray). For the cell‐level tests and neurological scales have different methods with different principles, they would be merged into three groups and two groups based on the criterion that there is no statistical difference within groups but significant differences between groups (distinguished by the shades of color), respectively. d, days; h, hours; No., numbers; min, minutes.
2.3. Quality assessment
The risk of bias in each included study was assessed using the revised version of the Cochrane risk‐of‐bias tool for randomized trials (RoB 2). 13 Besides, extra publication bias was analyzed by the Egger's test 14 and Begg's rank test 15 in MedCalc 20. 16 The domains of bias in the RoB 2 tool were: (1) bias arising from the randomization process; (2) bias due to deviations from intended interventions; (3) bias due to missing outcome data; (4) bias in the measurement of the outcome; (5) bias in the selection of the reported result; (6) overall bias, and each domain was assigned one of three levels according to the criteria: (a) low risk; (b) some concerns; (c) high risk.
Study quality was also assessed using the published criteria 17 for stroke animal experiments recommended by the research group of the Collaborative Approach to Meta Analysis and Review of Animal Experimental Studies (CAMARADES, https://www.ed.ac.uk/clinical‐brain‐sciences/research/camarades). The checklist comprised: (1) peer‐reviewed publication; (2) statement of control of temperature; (3) random allocation to treatment or control; (4) blinded induction of ischemia; (5) blinded assessment of outcome; (6) use of anesthetic without significant intrinsic neuroprotective activity; (7) appropriate animal model (transient, permanent, embolic or photothrombotic models); (8) sample size calculation; (9) compliance with animal welfare regulations; (10) statement of potential conflict of interests. Each above item was assigned one point, and thus each study was given a score out of a total 10 points.
2.4. Data extraction
From each included study, the data independently extracted by four investigators (half by Z.W. and J.T., half by Z.C. and Y.C.) are as follows (Figure 2).
Basic information of study article: country, published year, used language;
Preparation for animal model: species, method of ischemic induction, duration of ischemia;
Parameters of postconditioning: conditioning time, number of treatment (single‐visit or multi‐visit), number of sides (unilateral, bilateral, or four‐side), body part (hind limb or femoral artery, indicating noninvasion or invasion), number of cycles per treatment, duration of occlusion per cycle, duration of release per cycle; and measure time (stroke onset as the start of timing);
Data related to outcome measures: method with the unit of calculation, time of measurement, the number of animals, mean and standard deviations (SD) of measure in control and treatment groups.
If the requested data were only presented by graphs, the exact values would be measured using the digital ruler in PDF viewer and further determined by the average from different investigators. Notably, the “postconditioning” in our study was generalized, consisting of narrow “postconditioning” starting after reperfusion and “perconditioning” starting between the onset of occlusion and reperfusion. For the convenience of statistics and analysis, one record of the experiment is defined as one from a unique study with the only ischemic model, RIPostC, and measures. In other words, the above‐mentioned related data and parameters cannot be completely consistent between different experiments. The neurological scales used in the included studies were many and various, but we only counted those with a high frequency of use and clear, precise scoring criteria (Document S1).
2.5. Data analysis
2.5.1. Meta‐analysis methods
The meta‐analysis was performed in the software of Cochrane Review Manager 5.4.1 (RevMan 5.4.1). 18 Due to the continuous attribute and different measurement scales of outcome measures, the treatment effect in the study was presented by standardized mean difference (SMD) with 95% confidence intervals. The statistical algorithms used in our study including SMD (Hedges' adjusted G method 19 ), weights to each experiment (inverse‐variance method, IV), heterogeneity (Q test 20 and I 2 method 21 ), random‐effect model, 22 test for the presence of overall effect (Z test), and test for comparison of intragroup (Q test 20 and I 2 method 21 ) were by default in RevMan 5.4.1. Statistically significant difference was considered as p < 0.05.
2.5.2. Data preprocessing and meta‐analysis strategy
Given the complexity and diversity of the extracted data, they were preprocessed before meta‐analysis, including normalization and grouping (see Document S2 with Figure S1 for details). After preprocessing and grouping (Figure 2), there are still scarce experimental records of certain groups under specific factors. Inspired by the idea of sensitivity analysis based on the one‐by‐one elimination method, the records that cause the above situations and unstable results would be appropriately eliminated during the analysis. Throughout the analysis, any particular process will be specifically pointed out later.
3. RESULTS
3.1. Study characteristics
A total of 1738 records were identified from those mentioned search engines and other sources, of which 57 studies (Table S1) were assessed for full‐text eligibility and included in further meta‐analysis. The included studies were carried out in nine countries (China, number of studies[N] = 44; USA, N = 4; Canada, N = 3; Italy, N = 2; India N = 1; Japan, N = 1; Qatar N = 1; Slovakia, N = 1), all published after the year of 2009 (2009–2012, N = 10; 2013–2016, N = 28; 2017–2020, N = 19) written by English (N = 47) or Chinese language (N = 10), and comprised of 224 valid experiment records.
Among all of included experiments, outcome measure of 91 experiments was infarct size (2,3,5‐triphenyltetrazolium chloride staining (TTC), number of experimental records (n) = 79; H&E, n = 1; Cresyl violet staining (CV), n = 1; T2 weighted magnetic resonance imaging (T2‐MRI), n = 3; diffusion weighted imaging (DWI), n = 6; phase‐contrast microscopy, n = 1); 92 experiments were measured by neurological scales including Longa 5‐point scale (n = 19), modified neurological severity scores (mNSS) 18‐point scale (n = 25), Belayev 12‐point scale (n = 10), Ladder rung walking test (n = 3), and Garcia 18‐point scale (n = 35).
The remaining 41 experiments were assessed by four cell‐level tests, none of which showed statistically significant differences in sampling regions, including apoptosis (TUNEL in hippocampal cornu ammonis [CA1] regions, n = 10; TUNEL in penumbra regions, n = 11; p = 0.82), autophagy (LC3‐II or LC3‐II/LC3‐I in ischemia regions, n = 2; or in penumbra regions, n = 7; p = 0.51), normal‐neuron density (Nissl staining and NeuN in CA1 regions, n = 3; Nissl staining and NeuN staining in ischemia/penumbra regions, n = 6; p = 0.15) and damaged‐neuron counting (H&E in CA1 region, n = 1; H&E in ischemia region, n = 1; p = 0.27).
3.2. Outcome measures
The treatment effect expressed by SMD based on the outcome measure of infarct size (Table 1, Figure S2) is 3.32 (95% confidence interval (CI): [2.86, 3.78]). There are three species including rats, mice, and rhesus monkeys in the data on infarct size. Given that species and experimental procedures used in the study of rhesus monkeys 23 were quite different from those using rodents, and the former did not show therapeutic efficacy (SMD: −0.22 [−0.81, 0.37], p = 0.46), our study tried not to include rhesus monkey‐related data and the effect size rises to 3.60 (95% CI: [3.12, 4.07]).
TABLE 1.
Treatment effects of different factors based on the outcome measure of infarct size
| Overall effect/factors | No. of experimental records | No. of animals in treatment group | No. of animals in control group | Treatment effect (SMD [95% CI]) | p |
|---|---|---|---|---|---|
| Overall effect | 91 | 730 | 720 | 3.32 [2.86, 3.78]*** | |
| Overall effect (without Rhesus monkeys) | 85 | 700 | 702 | 3.60 [3.12, 4.07]*** | |
| Species | |||||
| Rats | 72 | 592 | 577 | 3.89 [3.35, 4.44]*** | <0.00001*** |
| Mice | 13 | 108 | 125 | 2.22 [1.41, 3.03]*** | |
| Rhesus monkeys | 6 | 30 | 18 | −0.22 [−0.81, 0.37] | |
| Stroke models | |||||
| Permanent ischemia | 10 | 92 | 100 | 4.38 [2.82, 5.93]*** | 0.59 |
| MCAO 30–60 min | 15 | 156 | 172 | 3.30 [2.13, 4.46]*** | |
| MCAO 90–100 min | 39 | 298 | 275 | 3.65 [2.93, 4.38]*** | |
| MCAO 120 min | 21 | 154 | 155 | 3.26 [2.50, 4.02]*** | |
| No. of treatments | |||||
| Multi‐visit | 5 | 51 | 47 | 2.56 [1.06, 4.07]*** | 0.17 |
| Single‐visit | 80 | 649 | 656 | 3.68 [3.18, 4.18]*** | |
| Conditioning time | |||||
| Near the onset of stroke | 10 | 88 | 87 | 2.65 [1.74, 3.56]*** | 0.10 |
| 30 min after stroke onset | 1 | 8 | 8 | 6.70 [3.85, 9.55]*** | |
| 1–2 h after stroke onset | 8 | 82 | 83 | 3.49 [2.10, 4.89]*** | |
| Near the start of reperfusion | 47 | 369 | 356 | 3.83 [3.11, 4.56]*** | |
| 20–40 min after reperfusion | 5 | 34 | 31 | 3.50 [1.19, 5.82]** | |
| 2–3 h after reperfusion | 5 | 38 | 60 | 4.36 [1.98, 6.74]*** | |
| 6 h after reperfusion | 4 | 30 | 30 | 3.68 [3.18, 4.18]*** | |
| No. of sides | |||||
| Unilateral | 24 | 200 | 223 | 3.42 [2.57, 4.26]*** | 0.62 |
| Bilateral | 61 | 500 | 479 | 3.68 [3.10, 4.25]*** | |
| Body parts (invasion or not) | |||||
| Hind limb (noninvasion) | 32 | 302 | 316 | 3.52 [2.76, 4.28]*** | 0.79 |
| Femoral artery (invasion) | 53 | 398 | 386 | 3.66 [3.04, 4.27]*** | |
| No. of cycles per treatment | |||||
| <3 | 15 | 94 | 80 | 3.69 [2.43, 4.96]*** | <0.00001*** |
| 3 | 61 | 531 | 526 | 3.89 [3.32, 4.47]*** | |
| 4 | 5 | 44 | 45 | 2.55 [0.58, 4.52]*** | |
| 5 | 4 | 31 | 51 | 1.38 [0.66, 2.10]*** | |
| Duration of occlusion per cycle | |||||
| <1 min | 3 | 22 | 21 | 1.65 [−0.12, 3.42] | 0.0007*** |
| 5 min | 22 | 181 | 194 | 2.43 [1.68, 3.19]*** | |
| 8–10 min | 46 | 396 | 385 | 4.04 [3.37, 4.71]*** | |
| 15 min | 7 | 59 | 67 | 4.64 [2.52, 6.77]*** | |
| ≥20 min | 7 | 42 | 35 | 5.75 [3.59, 7.91]*** | |
| Duration of release per cycle | |||||
| <1 min | 3 | 22 | 21 | 1.65 [−0.12, 3.42] | 0.003** |
| 5 min | 22 | 181 | 194 | 2.43 [1.68, 3.19]*** | |
| 8–10 min | 43 | 378 | 379 | 3.97 [3.28, 4.66]*** | |
| 15 min | 7 | 59 | 67 | 4.64 [2.52, 6.77]*** | |
| ≥20 min | 1 | 6 | 5 | 5.91 [2.61, 9.22]*** | |
| Measure time | |||||
| ≤24 h | 57 | 488 | 454 | 3.33 [2.77, 3.89]*** | 0.04* |
| 48–72 h | 23 | 174 | 199 | 4.39 [3.32, 5.46]*** | |
| 4–7 days | 3 | 48 | 47 | 2.12 [0.86, 3.38]** | |
| >7 days | 2 | 20 | 20 | 6.34 [1.12, 11.55]* | |
Note: There are great differences in species between rhesus monkeys and rodents, with different experimental designs and methods of ischemic induction (rhesus monkeys: MCAO 180 min and remote postconditioning of four‐size limbs). Besides, the results related to rhesus monkeys show no significant and effective treatment effect; therefore, except for the factor of species, the other factors do not include the experimental data of rhesus monkeys in the analysis. The column of p, statistics for testing subgroup differences within one factor; *p < 0.05; **p < 0.01; ***p < 0.001.
Abbreviations: CI, confidence interval; d, days; h, hours; MCAO, middle cerebral artery occlusion; min, minutes; No., numbers; SMD, standardized mean difference.
For Garcia 18‐point scale and cell‐level tests of autophagy and normal‐neuron density, smaller neurological damages correspond to larger values, which were preprocessed before the following meta‐analysis in our study. According to the criterion that there is no statistical difference within groups but significant differences between groups, all kinds of included scales were finally divided into two groups (Table 2): Group A (Figure S3; SMD: 1.58 [1.27, 1.89]) including Longa 5‐point scale, 24 Belayev 12‐point scale, 25 mNSS 18‐point scale 26 and Ladder rung walking test 27 , 28 (p = 0.23, intragroup test), and Group B (Figure S4) only with Garcia 18‐point scale 29 (SMD: 3.86 [3.18, 4.55]), with p < 0.00001 between two groups. All cell tests could be divided into three groups (Table 3): Group C (Figure S5) only with damaged‐neurons counting (SMD: 8.42 [4.99, 11.86]), Group D (Figure S6) only with autophagy (SMD: 2.13 [0.55, 3.71]), and Group E (Figure S7; SMD: 3.82 [2.93, 4.70]) including apoptosis and normal‐neuron density (p = 0.16, intragroup test), with p = 0.004 among three groups.
TABLE 2.
Treatment effects of different factors based on the outcome measure of neurological scales
| Overall effect/factors | No. of experimental records | No. of animals in treatment group | No. of animals in control group | Treatment effect (SMD [95% CI]) | p |
|---|---|---|---|---|---|
| Group A | |||||
| Overall effect | 57 | 532 | 506 | 1.58 [1.27, 1.89]*** | 0.23 |
| Longa 5‐point scale | 19 | 205 | 198 | 1.79 [1.21, 2.38]*** | |
| Belayev 12‐point scale | 10 | 105 | 104 | 0.93 [0.21, 1.65]* | |
| mNSS 18‐point scale | 25 | 194 | 176 | 1.74 [1.31, 2.17]*** | |
| Ladder rung walking test | 3 | 28 | 28 | 1.22 [−0.31, 2.74] | |
| Species | |||||
| Rats | 51 | 483 | 456 | 1.54 [1.22, 1.85]*** | 0.55 |
| Mice | 6 | 65 | 66 | 1.93 [0.70, 3.17]** | |
| Stroke models | |||||
| Permanent ischemia | 5 | 54 | 54 | 2.25 [1.02, 3.48]*** | 0.69 |
| MCAO 30–60 min | 3 | 26 | 26 | 1.58 [−0.55, 3.72] | |
| MCAO 90–100 min | 32 | 345 | 319 | 1.49 [1.13, 1.84]*** | |
| MCAO 120 min | 16 | 107 | 107 | 1.69 [0.94, 2.44]*** | |
| No. of treatments | |||||
| Multi‐visit | 6 | 38 | 38 | 3.19 [2.41, 3.96]*** | <0.0001*** |
| Single‐visit | 51 | 494 | 468 | 1.42 [1.11, 1.73]*** | |
| Conditioning time | |||||
| Near the onset of stroke | 10 | 108 | 108 | 0.88 [0.44, 1.32]*** | <0.00001*** |
| 30 min after stroke onset | 1 | 15 | 15 | 1.19 [0.41, 1.98]** | |
| 1–2 h after stroke onset | 12 | 131 | 114 | 1.35 [0.97, 1.73]*** | |
| Near the start of reperfusion | 27 | 232 | 223 | 1.90 [1.36, 2.43]*** | |
| 20–40 min after reperfusion | 1 | 8 | 8 | −2.73 [−4.19, −1.26]*** | |
| No. of sides | |||||
| Unilateral | 22 | 252 | 227 | 1.39 [1.00, 1.77]*** | 0.22 |
| Bilateral | 35 | 280 | 279 | 1.76 [1.31, 2.21]*** | |
| Body parts (invasion or not) | |||||
| Hind limb (noninvasion) | 32 | 270 | 263 | 1.79 [1.31, 2.26]*** | 0.25 |
| Femoral artery (invasion) | 25 | 262 | 243 | 1.42 [1.02, 1.82]*** | |
| No. of cycles per treatment | |||||
| <3 | 2 | 44 | 44 | 2.04 [0.19, 3.89]* | 0.68 |
| 3 | 50 | 445 | 418 | 1.54 [1.21, 1.87]*** | |
| 4 | 3 | 26 | 26 | 1.13 [−0.41, 2.67] | |
| 5 | 2 | 17 | 18 | 3.01 [0.06, 5.95] | |
| Duration of occlusion per cycle | |||||
| 5 min | 22 | 245 | 220 | 1.18 [0.81, 1.55]*** | 0.01* |
| 8–10 min | 34 | 275 | 274 | 2.02 [1.52, 2.52]*** | |
| 15 min | 1 | 12 | 12 | 0.79 [−0.04, 1.63] | |
| Duration of release per cycle | |||||
| 5 min | 22 | 245 | 220 | 1.18 [0.81, 1.55]*** | 0.01* |
| 8–10 min | 34 | 275 | 274 | 2.02 [1.52, 2.52]*** | |
| 15 min | 1 | 12 | 12 | 0.79 [−0.04, 1.63] | |
| Measure time | |||||
| ≤24 h | 27 | 271 | 260 | 1.11 [0.69, 1.53]*** | 0.005** |
| 48–72 h | 11 | 88 | 85 | 1.79 [1.10, 2.49]*** | |
| 4–7 days | 9 | 89 | 81 | 1.92 [1.19, 2.66]*** | |
| >7 days | 9 | 69 | 65 | 3.03 [1.93, 4.13]*** | |
| Group B | |||||
| Overall effect | 35 | 304 | 304 | 3.86 [3.18, 4.55]*** | |
| Garcia 18‐point scale | 35 | 304 | 304 | 3.86 [3.18, 4.55]*** | 0.0002*** |
| Sun et al., 2012 | 18 | 144 | 144 | 5.42 [4.15, 6.69]*** | |
| Studies without Sun et al., 2012 | 17 | 160 | 160 | 2.68 [1.99, 3.38]*** | |
| Species | |||||
| Rats | 35 | 304 | 304 | 3.86 [3.18, 4.55]*** | |
| No. of treatments | |||||
| Single‐visit | 35 | 304 | 304 | 3.86 [3.18, 4.55]*** | |
| No. of sides | |||||
| Bilateral | 35 | 304 | 304 | 3.86 [3.18, 4.55]*** | |
| Stroke models | |||||
| Permanent ischemia | 1 | 6 | 6 | 3.10 [1.21, 5.00]** | 0.004** (0.84) |
| MCAO 30–60 min | 7 | 90 | 90 | 2.87 [3.97, 1.76]*** | |
| MCAO 90–100 min | 18 (0) | 144 (0) | 144 (0) | 5.42 [4.15, 6.69]*** (/) | |
| MCAO 120 min | 9 | 64 | 64 | 2.53 [1.50, 3.56]*** | |
| Conditioning time | |||||
| Near the start of reperfusion | 16 | 152 | 152 | 2.84 [2.17, 3.52]*** | <0.00001*** (<0.0001***) |
| 20–40 min after reperfusion | 1 | 8 | 8 | 0.20 [−0.79, 1.18] | |
| 2–3 h after reperfusion | 9 (0) | 72 (0) | 72 (0) | 4.85 [3.04, 6.67]*** (/) | |
| 6 h after reperfusion | 9 (0) | 72 (0) | 72 (0) | 5.88 [4.28, 7.49]*** (/) | |
| Body parts (invasion or not) | |||||
| Hind limb (noninvasion) | 13 | 126 | 126 | 2.66 [1.95, 3.37]*** | 0.0006*** (0.82) |
| Femoral artery (invasion) | 22 (4) | 178 (34) | 178 (34) | 4.91 [3.79, 6.03]*** (2.92 [0.70, 5.14]*) | |
| No. of cycles per treatment | |||||
| 3 | 31 (13) | 280 (136) | 280 (136) | 4.07 [3.30, 4.84]*** (2.71 [1.87, 3.55]***) | 0.01** (0.86) |
| 4 | 4 | 24 | 24 | 2.60 1.74, 3.47]*** | |
| Duration of occlusion per cycle | |||||
| <1 min | 6 (0) | 48 (0) | 48 (0) | 2.93 [1.62, 4.25]*** (/) | <0.0001*** (/) |
| 5 min | 6 (0) | 48 (0) | 48 (0) | 8.86 [6.57, 11.15]*** (/) | |
| 8–10 min | 23 (17) | 208 (160) | 208 (160) | 3.27 [2.56, 3.98]*** (2.68 [1.99, 3.38]***) | |
| Duration of release per cycle | |||||
| <1 min | 6 (0) | 48 (0) | 48 (0) | 2.93 [1.62, 4.25]*** (/) | <0.0001*** (/) |
| 5 min | 6 (0) | 48 (0) | 48 (0) | 8.86 [6.57, 11.15]*** (/) | |
| 8–10 min | 23 (17) | 208 160) | 208 (160) | 3.27 [2.56, 3.98]*** (2.68 [1.99, 3.38]***) | |
| Measure time | |||||
| ≤24 h | 14 (8) | 125 (77) | 125 (77) | 3.34 [2.28, 4.41]*** (2.76 [1.53, 4.00]***) | 0.04* (0.99) |
| 48–72 h | 19 (7) | 156 (60) | 156 (60) | 4.55 [3.50, 5.61]*** (2.69 [1.66, 3.72]***) | |
| 4–7 days | 2 | 23 | 23 | 2.80 [1.95, 3.66]*** | |
Note: All kinds of neurological scales can be divided into two groups: Group A including Longa 5‐point scale, Belayev 12‐point scale, mNSS 18‐point scale, and Ladder rung walking test (p = 0.23, intragroup test) and Group B only with Garcia 18‐point scale, while p < 0.00001 between two groups. In Group B (Garcia 18‐point scale), the data from study of Sun et al., 2012 (SMD: 5.42 [4.15, 6.69]) have a quite larger effect size than others (SMD: 2.68 [1.99, 2.68]) with a very significant difference (p = 0.0002), so for the factors with more than one treatment the table, the table not only illustrates the statistics of all data in the group, but also those excluding study of Sun et al., 30 (values of each factor in parentheses ), “0” or “/” means none. The column of p, statistics for testing subgroup differences within one factor; *p < 0.05; **p < 0.01; ***p < 0.001.
Abbreviations: CI, confidence interval; d, days; h, hours; MCAO, middle cerebral artery occlusion; min, minutes; No., numbers; SMD, standardized mean difference.
TABLE 3.
Treatment effects of different factors based on the outcome measure of cell‐level tests
| Overall effect/factors | No. of experimental records | No. of animals in treatment group | No. of animals in control group | Treatment effect (SMD [95% CI]) | p |
|---|---|---|---|---|---|
| Group C | |||||
| Overall effect | 2 | 13 | 13 | 8.42 [4.99, 11.86]*** | |
| Damaged‐neuron counting | 2 | 13 | 13 | 8.42 [4.99, 11.86]*** | |
| Group D | |||||
| Overall effect | 9 | 45 | 45 | 2.13 [0.55, 3.71]** | |
| Autophagy | 9 | 45 | 45 | 2.13 [0.55, 3.71]** | <0.00001*** |
| Chen et al., 2018 | 1 | 6 | 6 | −3.54 [−5.61, −1.47]*** | |
| Studies without Chen et al., 2018 | 8 | 39 | 39 | 2.67 [1.64, 3.70]*** | |
| Species | |||||
| Rats |
8 (7) |
39 (33) | 39 (33) | 1.94 [0.22, 3.65]*(2.53 [1.41, 3.64]***) | 0.21 (0.35) |
| Mice | 1 | 6 | 6 | 3.68 [1.56, 5.81]*** | |
| Stroke models | |||||
| MCAO 90–100 min | 7 (6) | 34 (28) | 34 (28) |
1.97 [−0.10, 4.03] (2.75 [1.33, 4.18]***) |
0.61 (0.88) |
| MCAO 120 min | 2 | 11 | 11 | 2.60 [1.31, 3.89]*** | |
| No. of treatments | |||||
| Single‐visit | 9 (8) | 45 (39) | 45 (39) |
2.13 [0.55, 3.71]** (2.67 [1.64, 3.70]***) |
|
| Conditioning time | |||||
| 30 min after stroke onset | 1 | 4 | 4 | 3.79 [0.84, 6.74]* | 0.29 (0.45) |
| Near the start of reperfusion | 8 (7) | 41 (35) | 41 (35) |
1.96 [0.27, 3.65]* (2.58 [1.47, 3.68]***) |
|
| No. of sides | |||||
| Unilateral | 1 (0) | 6 (0) | 6 (0) | −3.54 [−5.61, −1.47]*** (/) | <0.00001*** (/) |
| Bilateral | 8 | 39 | 39 | 2.67 [1.64, 3.70]*** | |
| Body parts (invasion or not) | |||||
| Hind limb (noninvasion) | 3 (2) | 16 (10) | 16 (10) |
0.26 [−3.45, 3.98] (2.07 [−1.20, 5.35]) |
0.19 (0.66) |
| Femoral artery (invasion) | 6 | 29 | 29 | 2.83 [1.96, 3.71]*** | |
| No. of cycles per treatment | |||||
| 3 | 7 (6) | 35 (29) | 35 (29) |
2.17 [0.15, 4.19]* (2.83 [1.96, 3.71]***) |
0.96 (0.66) |
| 4 | 2 | 10 | 10 | 2.07 [−1.20, 5.35] | |
| Duration of occlusion per cycle | |||||
| 8–10 min | 8 | 39 | 39 | 2.67 [1.64, 3.70]*** | <0.00001*** (/) |
| 15 min | 1 (0) | 6 (0) | 6 (0) | −3.54 [−5.61, −1.47]*** (/) | |
| Duration of release per cycle | |||||
| 8–10 min | 8 | 39 | 39 | 2.67 [1.64, 3.70]*** | <0.00001*** (/) |
| 15 min | 1 (0) | 6 (0) | 6 (0) | −3.54 [−5.61, −1.47]*** (/) | |
| Measure time | |||||
| ≤24 h | 9 (8) | 45 (39) | 45 (39) |
2.13 [0.55, 3.71]** (2.67 [1.64, 3.70]***) |
|
| Group E | |||||
| Overall effect | 30 | 243 | 225 | 3.70 [2.82, 4.59]*** | 0.29 |
| Apoptosis | 21 | 122 | 122 | 3.22 [2.63, 3.82]*** | |
| Normal‐neuron density | 9 | 121 | 103 | 4.33 [2.36, 6.30]*** | |
| Species | |||||
| Rats | 27 | 165 | 165 | 3.79 [3.07, 4.50]*** | 0.12 |
| Mice | 3 | 84 | 66 | 1.65 [−0.93, 4.24] | |
| Stroke models | |||||
| Global ischemia | 6 | 40 | 40 | 4.16 [2.90, 5.41]*** | 0.27 |
| MCAO 30–60 min | 4 | 86 | 68 | 1.90 [−0.29, 4.10] | |
| MCAO 90–100 min | 6 | 38 | 38 | 4.66 [2.26, 7.07]*** | |
| MCAO 120 min | 14 | 79 | 79 | 3.46 [2.57, 4.35]*** | |
| No. of treatments | |||||
| Multi‐visit | 9 | 118 | 100 | 3.28 [1.59, 4.98]*** | 0.54 |
| Single‐visit | 22 | 131 | 131 | 3.87 [3.06, 4.68]*** | |
| Conditioning time | |||||
| Near the onset of stroke | 1 | 8 | 8 | 2.73 [1.26, 4.19]*** | 0.01* |
| Near the start of reperfusion | 18 | 107 | 107 | 3.96 [3.07, 4.85]*** | |
| 20–40 min after reperfusion | 1 | 5 | 5 | 1.27 [−0.16, 2.70] | |
| 6 h after reperfusion | 1 | 5 | 5 | 4.90 [1.88, 7.93]** | |
| No. of sides | |||||
| Unilateral | 4 | 25 | 25 | 5.27 [1.56, 8.98]** | 0.38 |
| Bilateral | 26 | 218 | 200 | 3.58 [2.65, 4.50]*** | |
| Body parts (invasion or not) | |||||
| Hind limb (noninvasion) | 15 | 154 | 136 | 3.42 [2.15, 4.69]*** | 0.59 |
| Femoral artery (invasion) | 15 | 89 | 89 | 3.85 [2.92, 4.79]*** | |
| No. of cycles per treatment | |||||
| 3 | 27 | 225 | 207 | 3.48 [2.58, 4.38]*** | 0.04* |
| 4 | 3 | 18 | 18 | 5.81 [3.80, 7.82]*** | |
| Duration of occlusion per cycle | |||||
| 5 min | 3 | 15 | 15 | 2.22 [0.66, 3.79]** | 0.20 |
| 8–10 min | 20 | 180 | 162 | 3.81 [2.65, 4.97]*** | |
| 15 min | 7 | 48 | 48 | 3.86 [2.78, 4.94]*** | |
| Duration of release per cycle | |||||
| 5 min | 3 | 15 | 15 | 2.22 [0.66, 3.79]** | 0.20 |
| 8–10 min | 20 | 180 | 162 | 3.81 [2.65, 4.97]*** | |
| 15 min | 7 | 48 | 48 | 3.86 [2.78, 4.94]*** | |
| Measure time | |||||
| ≤24 h | 17 | 98 | 98 | 3.35 [2.54, 4.15]*** | 0.16 |
| 48–72 h | 4 | 23 | 23 | 3.19 [2.10, 4.28]*** | |
| 4–7 days | 3 | 22 | 22 | 5.52 [3.70, 7.35]*** | |
| >7 days | 6 | 100 | 82 | 3.35 [1.18, 5.52]** | |
Note: All kinds of cell‐level tests can be divided into three groups: Group C including damaged‐neuron counting, Group D including autophagy, and Group E including apoptosis and normal‐neuron density (p = 0.29, intragroup test), while p = 0.004 among three groups. Group C (damaged‐neurons counting) just has two experimental records, so only the overall effect is calculated (SMD: 8.42 [4.99, 11.86]), and each factor is no longer analyzed separately. In Group D (autophagy), the treatment effect of study of Chen et al.,2018 31 (SMD: −3.54 [−5.61, −1.47]) is exactly the opposite to those of other studies (SMD: 2.67 [1.64, 3.70]), with a significant statistical difference (p < 0.00001); therefore, the table not only presents the statistics of all data in the group, but also those excluding study of Chen et al., 2018 (values of each factor in parentheses); “0” or “/” means none. The column of p, statistics for testing subgroup differences within one factor; *p < 0.05; **p < 0.01; ***p < 0.001.
Abbreviations: CI, confidence interval; d, days; h, hours; MCAO, middle cerebral artery occlusion; min, minutes; No., numbers; SMD, standardized mean difference.
Just from the point of view of overall effect sizes, the treatment effect measured by Garcia 18‐point scale is generally higher than that of other scales. In the data on cell‐level tests, the treatment effect represented by damaged‐neurons counting is the largest, followed by apoptosis and normal‐neuron density, and the worst was autophagy. On the other hand, we noticed a strikingly significant difference (p = 0.0002) between the outcomes of the study of Sun et al., 30 (SMD: 5.42 [4.15, 6.69]) and the rest of the studies (SMD: 2.68 [1.99, 2.68]) in Group B (Garcia 18‐point scale), so data of Group B with or without Sun et al., 2012 were both analyzed and presented in Table 2. Even in Group B excluding data from Sun et al., 2012, there remained a statistical difference between Group A and B (p = 0.004). Due to just two experimental records in Group C (damaged‐neurons counting), only the overall effect was calculated and each specific factor was no longer analyzed separately. In Group D (autophagy), the treatment effect of the study by Chen et al., 31 (SMD: −3.54 [−5.61, −1.47]) was exactly the opposite to those of other studies (SMD: 2.67 [1.64, 3.70]) with a significant difference (p <0.00001).
3.3. Animal models
For species, the treatment effect only measured by infarct size shows a statistical difference between rats and mice (p = 0.0008) among three kinds of outcome measures, and the effect size is higher in mice (SMD: 3.89 [3.35, 4.44]) than in rats (SMD: 2.22 [1.41, 3.03]). While there was no difference between various varieties within the same species (rats with the varieties of Sprague–Dawley (SD) rats and Wistar rats, p = 0.96; mice with the varieties of C57BL/6 mice and CD mice, p = 0.11). Interestingly, stroke models determined by ischemic induction and duration do not show statistical differences in any of the measures (Tables 1, 2, 3).
3.4. Measure time
Measure time shows a difference in effects based on infarct sizes (p = 0.04) and Group A in neurological scales (p = 0.005), does not in cell‐level tests (p = 0.16 in Group E). The effect based on infarct sizes in measure time between 48 and 72 h is almost most obvious (SMD: 4.39 [3.32, 5.46]) then declines, and the data in Table 1 show that effect size reaches the maximal measured after 7 days of ischemia onset, nevertheless, the reliability of which is limited because of only two records with measure time of after‐seven‐day (Table 1). But the effect size is greater when the time point measured based on Group A in neurological scales from the onset of the stroke is longer (Table 2).
3.5. Postconditioning
Among postconditioning‐related factors, there is no significant difference in the number of sides and body parts (Tables 1, 2, 3). For the number of treatments, the results of Group A in neurological scale show that multi‐visit (SMD: 3.19 [2.41, 3.96]) is better than single‐visit (SMD: 1.42 [1.11, 1.73]) with significance (p <0.0001), but other measures do not have significant differences and the effect size of single‐visit (infarct size, SMD: 3.68 [3.18, 4.18]; Group E in cell‐level tests: 3.87 [3.06, 4.68]) was generally higher than multi‐visit (infarct size, SMD: 2.56 [1.06, 4.07]; Group E in cell‐level tests, SMD: 3.28 [1.59, 4.98]).
The following parameters have significant impacts on the treatment effect of postconditioning including conditioning time, number of cycles per treatment, duration of occlusion, and release per cycle. Firstly, for conditioning time (Figure 3), most of the included experiments were selected near the onset of stroke (n = 21), 1–2 h after stroke onset (n = 20), and near the start of reperfusion (n = 117). Several studies have performed postconditioning experiments at time points not less than 2 h after reperfusion (Yang et al., 32 n = 1; Ren et al., 33 n = 2; Sun et al., 30 n = 25). Based on the relevant data at the aforementioned time points, the outcome measures of infarct size (p = 0.32) and Group E of cell‐level tests (p = 0.27) did not show statistical differences among different treatment levels, but Group A (p = 0.04) and Group B (p = 0.0008) of neurological scales did show significance. Besides, a small number of studies would select less frequently used conditioning times, such as 30 min after stroke onset (number of studies, N = 3; number of experiments, n = 3) or 20–40 min after reperfusion onset (N = 3, n = 8), among which some studies (black solid points in Figure 3: Qi et al., 34 ; Gao et al. 35 ; Qi et al., 36 ) performed as outliers. To be specific, postconditioning 30 min after stroke onset presented by autophagy level in the study of Qi et al., 34 (SMD: 3.79 [0.84, 6.74]) worked better than other studies near the start of reperfusion (SMD: 2.58 [1.47, 3.68]) in Group D; the treatment effects of postconditioning 30 min after reperfusion in the studies of Gao et al., and Qi et al., 2012 were worse than those near the start of reperfusion, 35 , 36 and the Belayev 12‐point scale score in the treatment group was even a bit higher than the control group in Qi et al., 36 , which means such conditioning had no treatment effect (SMD: ‐2.73 [‐4.19, ‐1.26]). Adding these outliers' data into the intragroup test of the factor, Group E was transformed into a statistical difference (p = 0.01, Table 3).
FIGURE 3.
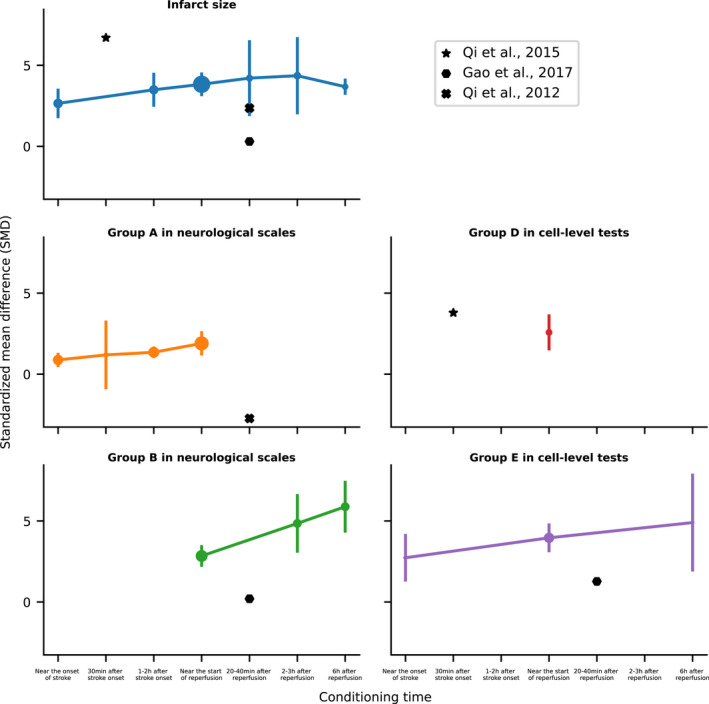
Treatment effects for the factor of conditioning time based on different outcome measures. Treatment effects presented by standardized mean difference (SMD in Y‐axis) along with different conditioning times (X‐axis) are represented by lines with error bars (bars: 95% confidence intervals; solid points: number of animals, the larger the point is, the more number is). And the outcome measures include infarct size (upper left, blue; p = 0.32, intragroup test); Group A in neurological scales with Longa 5‐point scale, 24 Belayev 12‐point scale, 25 mNSS 18‐point scale, 26 and Ladder rung walking test 27 , 28 (middle left, orange; p = 0.02); Group B in neurological scales with Garcia 18‐point scale 29 (bottom left, green; p = 0.0008); Group D in cell‐level tests with autophagy level (middle right, red); and Group E in cell‐level tests with apoptosis and normal‐neuron density (bottom right, purple; p = 0.27), all of which almost follow the trend that the treatment effect is better when the time point of conditioning is longer from the onset of stroke. But some of studies were not subject to the trend and drawn out particularly as outliers including Qi et al., 34 (star points); Gao et al., 35 (hexagon points); Qi et al., 36 (“X” points). d, days; h, hours; min, minutes.
For other significant postconditioning‐related parameters, the data based on infarct size are larger and have more treatment levels than other measures. According to Table 1, the number of cycles per treatment (p < 0.00001), duration of occlusion (p = 0.0007), and release (p = 0.003) per cycle all have differences in statistics; performing three times works best for the number of cycles per treatment (SMD: 3.89 [3.32, 4.47]), while effect sizes are generally positive correlation with the duration of occlusion and release per cycle (Figure 4). On the other hand, the data based on neurological scales and cell‐level tests are mainly focused on a few treatment levels (Table 2–3). There are 3 (n = 117) or 4 (n = 12) cycles per treatment with little statistical difference in effect between them (except Group E in cell‐level tests, p = 0.04). The duration of occlusion and release per cycle is 5 min (n = 31) or 8–10 min (n = 85), with a few being 15 min (n = 9) or less than 1 min (n = 6). From the results, 8–10 min (Group A in neurological scales, SMD: 2.02 [1.52, 2.52]; Group E in cell‐level tests: 3.81 [2.65, 4.97]) is better than 5 min (Group A in neurological scales, SMD: 1.18 [0.81, 1.55]; Group E in cell‐level tests: 2.22 [0.66, 3.79]).
FIGURE 4.
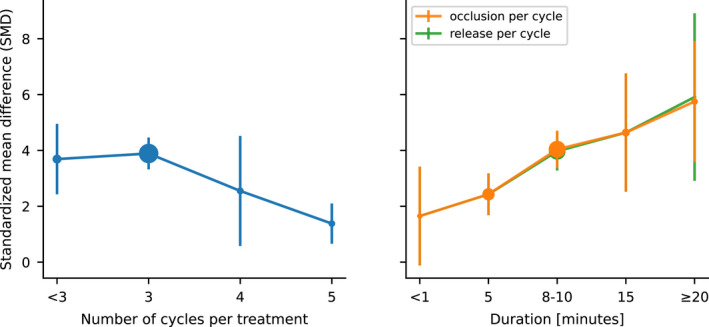
Treatment effects based on infarct size for factors including number of cycles per treatment, duration of occlusion, and release per cycle. Treatment effects presented by standardized mean difference (SMD in Y‐axis) along with different treatment levels of factors including number of cycles per treatment (left, blue; p < 0.00001, intragroup test), duration of occlusion (p = 0.0007), and release per cycle (right, orange; p = 0.003) are represented by lines with error bars (bars: 95% confidence intervals; solid points: number of animals, the larger the point is, the more number is). As we can see, three cycles per treatment work best among all possible treatment levels in the factor, while effect sizes are generally positive correlation with the duration of occlusion and release per cycle.
3.6. Study quality and risk of bias
In all of 57 include studies, the overall risk of bias (Table S2) assessed with the RoB 2 tool was 51 (89.5%) of low risk, 4 (7.0%) of Some concerns and 2 (3.5%) of high risk (Table S2). However, the publication bias based on various outcome measures show significant (Egger's test: infarct size, p < 0.0001; Group A in neurological scales, p < 0.0001; Group B, p < 0.0001; Group C in cell‐level tests, p < 0.0001; Group D, p = 0.25; Group E, p < 0.0001. Begg's test: infarct size, p < 0.0001; Group A in neurological scales, p < 0.0001; Group B, p < 0.0001; Group C in cell‐level tests, p = 0.32; Group D, p = 0.037; Group E, p < 0.0001). Furthermore, the mean of study quality score calculated using CAMARADES (Table S3) is 7.47 with SD of 1.40, the distribution of which is 5–6 (N = 15), 7–8 (N = 26), 9–10 (N = 16). It should be additionally pointed out that only two studies 37 , 38 received a full score.
4. DISCUSSION
Based on our systematic meta‐analysis, remote ischemic postconditioning has demonstrated efficacy as an effective therapeutic intervention for acute ischemic stroke in experimental models by the neuroprotection against ischemia‐induced injury, regardless of the ground on which kinds of outcome measures including infarct size (Table 1), neurological scales (Table 2) and cell‐level tests (Table 3). Great treatment effects were often the outcome of a combination of many factors, which were classified into three aspects of animal models, postconditioning parameters, and measure time.
Factors for animal models were the selection of species and preparation of the stroke model, the latter being determined by the methods of ischemic induction and duration of ischemia. Of the 57 included studies with 224 experimental records, the vast majority used rodents including rats (number of studies, N = 46; number of experiments, n = 195) and mice (N = 10, n = 23), and only one study chose rhesus monkeys as experimental animals (N = 1, n = 6). In rodent studies, there was no statistical difference between species according to different outcome measures except for infarct size, but the conclusion needs to be further confirmed due to the relative lack of data in mice and an unbalanced distribution of treatment levels. While all measure indicators based on SMD consistently showed that different stroke preparation methods had no significant effect on the final comparison of treatment effects between the treatment and control group. In other words, the relative treatment effects of RIPostC in various types of stroke models were close. So, as long as reasonable and standardized operating procedures were followed, all the different models can be used for RIPostC research, among which the more common stroke model is MCAO 90–120 min (N = 31).
For the study using rhesus monkeys, only the data of infarct volume based on magnetic resonance imaging (MRI) 24 h after stroke were included in the meta‐analysis according to the criteria of data extraction and the result showed RIPostC did not reduce infarct size during the period, but the article clearly pointed out that serum levels of cardiac enzymes and endothelial injury marker decreased over the same time indicating that the RIPostC still had a certain effect on the ischemic monkey models in the hyperacute stage. 23
On the other hand, the experts in the field have long called for and recommend that factors including age and gender should be taken into account when conducting research on remote ischemic conditioning, 39 and studies have shown the effects of stroke rehabilitation and therapies vary by gender and age. 40 , 41 , 42 , 43 However, limited by inherent thinking and consideration of experimental convenience, the animal models for related research in the past decade were still dominated by adult male rodents. Of the 57 included studies, only three used females 32 , 44 , 45 and two used mid‐aged or aged animals 37 , 38 (Table S1). Therefore, we regretted to exclude the two important factors of gender and age from our meta‐analysis due to their highly uneven distribution of data. Here, we also call on more peers to incorporate these factors into the experiments when engaging in relevant research.
In the postconditioning parameters, different numbers of treatments, treated body parts (hind limb or femoral artery), and number of sides almost had no statistical difference, which suggested that the multi‐visit, multi‐sided, and deliberate separation of femoral arteries for RIPostC had little value on acute ischemia, so the simpler noninvasive method of a single‐visit with an elastic bandage is enough to achieve the effect. And the parameters that really play a role in the treatment are conditioning time, number of cycles per treatment, duration of occlusion, and release per cycle. Firstly, the longer time point of conditioning is from the onset of stroke, the better the treatment effect is usually. This also provides a possible reason why Sun et al., 30 (conditioning at 3 or 6 h after the stroke of onset) is significantly higher in the Group B of neurological scales. But some studies conducting at 30 min after stroke onset 34 or nearly 30 min after reperfusion onset 35 , 36 did not follow the trend. Secondly, three cycles per treatment were the most frequently used in experiments (n = 178) and appeared to have good effects (Figure 4, Table 1). Thirdly, the longer occlusion and release times per cycle resulted in better treatment effects, but the caveat is that there is no guarantee whether the prolonged duration works or not due to a few records of occlusion (n = 7) or release (n = 1) duration per cycle over 20 min (Figure 4, Table 1), and a duration of around 10 min are more recommended. In view of some above relatively less reliable and even contradictory conclusions, especially in conditioning time, comprehensive experimental studies on those contributing parameters are warranted in the future.
Measure time cannot inherently affect the treatment effect of RIPostC indeed, but the effect sizes might vary when measuring at different time points according to our experience and the analysis results (Tables 1 and 2) are in line with the expectations. In the study, measure time was grouped into ≤24 h (hyperacute stage), 48–72 h (namely 2–3 days), and 4–7 days (the two belong to the acute stage), >7 days (subacute stage). 46 Based on infarct size, testing within 48–72 h showed better effects compared with that done at hyperacute stage and 4–7 days. On the other hand, previous studies by our group have revealed that loss of blood flow and nervous tissue damage to the ischemic area increased and reached the most at about 3 days after stroke in the rat models, then gradually recovered with recanalization and collateral revascularization. 42 , 47 The almost coincidence of the two time points indicates that RIPostC has a much prominent efficacy on severe injuries, more importantly, the measurement based on infarct size should be done in the early acute stage to more realistically reflect the therapeutic outcome. The results of scales, though, more conform to what we know that the performance of animal behaviors is getting better over time due to animals with certain self‐healing and adaptive capabilities. And the absence of differences at cell‐level tests may not only be limited by the small amount of data collected, but more likely that the stroke‐induced disturbances in brain homeostasis rapidly trigger the responses by neuroprotective mechanisms, and remain high at the cellular and molecular levels during the acute stage. 3 , 4 , 23
As is well‐known to all, various levels of outcome measures have their respective advantages and disadvantages. In brief, cell‐level tests including autophagy and apoptosis are more accurate but only for a small portion of brain regions; neurological scales can evaluate the overall physical conditions but are relatively more general and imprecise; infarct size is between and the most used measurement in most studies at present. For the neurological scales, Longa 5‐point scale (SMD: 1.79 [1.21, 2.38]) was first designed and also the simplest, which is currently used by many studies as a criterion for animal enrolling after stroke induction, 24 while mNSS 18‐point scale (SMD: 1.74 [1.31, 2.17]) might be a better alternative for subsequent behavioral evaluation, because of no statistical difference between them (p = 0.88) and the latter with more detailed assessment process. 26
From the results of cell‐level tests, RIPostC has the ability to reduce normal cell death or apoptosis, and regulate autophagy to reduce I/R injury. 7 Among the studies using autophagy as a measure, the majority showed that RIPostC provided neuroprotection by activating autophagy 34 , 36 , 48 , 49 , 50 ; however, Chen et al., 31 illustrated that RIPostC protected the brain from damage by inhibiting autophagy. In addition, Wang et al., 51 (The study was also included in the analysis, but the measure of autophagy was performed based on the combination of RIPostC and ISIPostC, so this part of the data did not meet the criteria and was not in statistics.) reached similar conclusions to Chen et al., and further found that autophagy inhibitors also could reduce the injury from stroke. Conflicting conclusions from related studies suggest the neuroprotective mechanism of autophagy‐related pathways remains to be intensively and comprehensively studied in the future. It should also be pointed out that the effect sizes of two studies 52 , 53 based on H&E staining for the damaged‐neuron counting were significantly high, which might be the inaccuracy of the staining method for the statistics of damaged neurons in the brain after injury, and thus not recommended for cell quantitative counting, but acceptable for calculation of infarct size. 54
Last but not least, the overall risk of bias for the included studies was low (89.5% low risk and 10.5% others according to the RoB 2 tool), but the meta‐analysis is subject to possible weaknesses limited by their risk of bias or study quality. Firstly, 18 studies (31.6%) were considered with “some concerns” on bias in the measurement of the outcome because they did not specify whether outcome evaluators knew that study animals received treatment. 13 In general, people with the above information tend to unconsciously rate them in a biased way. Secondly, the included studies showed significant publication bias based on the Egger's and Begg's rank test no matter what the outcome measures were based on, which might lead to misestimate treatment effects without published negative data and needs to be wary of such survivorship bias. Thirdly, most of the studies (93.0%) did not estimate the sample size (one item of CAMARADES criteria) and only four studies (7.0%) did, 32 , 37 , 38 , 55 while an appropriate sample size is one of the most important factors in scientific research and statistical analysis, and should not be easily ignored. 56
In conclusion, the postconditioning parameters that play a role in the final treatment effect of RIPostC are mainly conditioning time, number of cycles per treatment, duration of occlusion, and release per cycle, while numbers of treatments, treated body parts, and number of sides are less influential. According to the outcome measures, RIPostC can reduce the infarct size (most pronounced in the early acute stage), improve the behavioral ability of experimental animal models, reduce normal‐neuron death or apoptosis, and regulate the autophagy level. Due to the discrepancy in the trend of conditioning time and regulation mechanism of autophagy and little data in gender, age, and longer duration of conditioning, more in‐depth and systematic research is needed in these areas.
FUNDING INFORMATION
This work was supported by the Natural Science Foundation of Zhejiang Province [grant number LY21H170002], Graduate Scientific Research Foundation of Hangzhou Dianzi University [grant number CXJJ2020047], and National Natural Science Foundation of China [grant number 31401008].
CONFLICT OF INTEREST
The authors declare no conflicts of interest. The authors alone are responsible for the contents and writing of the article.
AUTHOR CONTRIBUTION
K. Z. (Kezhou Liu) and Z. C. (Zhengting Cai) involved in the conception and design. Q. Z. (Quanwei Zhang), Y. C. (Yinuo Cheng), and M. Y. (Mengjie Yin) involved in the identification of studies. Q. Z. (Quanwei Zhang), Y. C. (Yinuo Cheng), J. H. (Jiatong He), and S. W. (Shaonong Wei) involved in the selection of studies. Q. Z. (Quanwei Zhang), Y. C. (Yinuo Cheng), J. H. (Jiatong He), and Z.C. (Zhengting Cai) involved in data extraction. Z. C. (Zhengting Cai) and Q. Z. (Quanwei Zhang) involved in the statistical analysis. Z. C. (Zhengting Cai) involved in writing—original draft. Z. C. (Zhengting Cai) and K. Z. (Kezhou Liu) involved in writing—review and editing. K. Z. (Kezhou Liu) involved in project administration.
Supporting information
DocumentS1
DocumentS2
FigsureS2‐S7
TableS1‐S3
Liu K, Cai Z, Zhang Q, et al. Determination of significant parameters in remote ischemic postconditioning for ischemic stroke in experimental models: A systematic review and meta‐analysis study. CNS Neurosci Ther. 2022;28:1492‐1508. doi: 10.1111/cns.13925
Kezhou Liu and Zhengting Cai contributed equally to this work.
DATA AVAILABILITY STATEMENT
The data that supports the findings of this study are available in the supplementary material of this article.
REFERENCES
- 1. Baxter GF, Yellon DM. Current trends and controversies in ischemia‐reperfusion research. Basic Res Cardiol. 2003;98(2):133‐136. [DOI] [PubMed] [Google Scholar]
- 2. Yoon SY, Kim CY, Han HJ, Lee KO, Song TJ. Protective effect of ischemic postconditioning against hepatic ischemic reperfusion injury in rat liver. Ann Surg Treat Res. 2015;88(5):241‐245. [DOI] [PMC free article] [PubMed] [Google Scholar]
- 3. Zhou G, Li MH, Tudor G, Lu HT, Kadirvel R, Kallmes D. Remote ischemic conditioning in cerebral diseases and neurointerventional procedures: recent research progress. Front Neurol. 2018;9:339. [DOI] [PMC free article] [PubMed] [Google Scholar]
- 4. Da Zhou JD, Ya J, Pan L, et al. Remote ischemic conditioning: a promising therapeutic intervention for multi‐organ protection. Aging (Albany NY). 2018;10(8):1825‐1855. [DOI] [PMC free article] [PubMed] [Google Scholar]
- 5. Ricca L, Lemoine A, Cauchy F, et al. Ischemic postconditioning of the liver graft in adult liver transplantation. Transplantation. 2015;99(8):1633‐1643. [DOI] [PubMed] [Google Scholar]
- 6. Pan J, Li X, Peng Y. Remote ischemic conditioning for acute ischemic stroke: dawn in the darkness. Rev Neurosci. 2016;27(5):501‐510. [DOI] [PubMed] [Google Scholar]
- 7. Li CY, Ma W, Liu KP, et al. Advances in intervention methods and brain protection mechanisms of in situ and remote ischemic postconditioning. Metab Brain Dis. 2021;36(1):53‐65. [DOI] [PubMed] [Google Scholar]
- 8. Liu J, Gu Y, Guo M, Ji X. Neuroprotective effects and mechanisms of ischemic/hypoxic preconditioning on neurological diseases. CNS Neurosci Ther. 2021;27(8):869‐882. [DOI] [PMC free article] [PubMed] [Google Scholar]
- 9. Weir P, Maguire R, O'Sullivan SE, et al. A meta‐analysis of remote ischaemic conditioning in experimental stroke. J Cereb Blood Flow Metab. 2021;41(1):3‐13. [DOI] [PMC free article] [PubMed] [Google Scholar]
- 10. Pico F, Rosso C, Meseguer E, et al. A multicenter, randomized trial on neuroprotection with remote ischemic per‐conditioning during acute ischemic stroke: the REmote iSchemic Conditioning in acUtE BRAin INfarction study protocol. Int J Stroke. 2016;11:938‐943. [DOI] [PubMed] [Google Scholar]
- 11. Diamanti S, Beretta S, Tettamanti M, et al. Multi‐center randomized phase II clinical trial on remote ischemic conditioning in acute ischemic stroke within 9 hours of onset in patients ineligible to recanalization therapies (TRICS‐9): study design and protocol. Front Neurol. 2021;12:724050. [DOI] [PMC free article] [PubMed] [Google Scholar]
- 12. Moher D, Liberati A, Tetzlaff J, Altman DG, The PRISMA Group . Preferred reporting items for systematic reviews and meta‐analyses: the PRISMA statement. PLoS Med. 2009;6(7):e1000097. [DOI] [PMC free article] [PubMed] [Google Scholar]
- 13. JPT Higgins, Savović J, Page MJ, Elbers RG, JAC Sterne. Chapter 8: assessing risk of bias in a randomized trial. In: JPT Higgins, Thomas J, Chandler J, Cumpston M, Li T, Page MJ, Welch VA, eds. Cochrane Handbook for Systematic Reviews of Interventions Version 6.2 (updated February 2021). Cochrane; 2009. Accessed February 2021. www.training.cochrane.org/handbook. [Google Scholar]
- 14. Egger M, Smith GD, Schneider M, Minder C. Bias in meta‐analysis detected by a simple, graphical test. BMJ. 1997;315(7109):629‐634. [DOI] [PMC free article] [PubMed] [Google Scholar]
- 15. Begg CB, Mazumdar M. Operating characteristics of a rank correlation test for publication bias. Biometrics. 1994;50:1088‐1101. [PubMed] [Google Scholar]
- 16. MedCalc® Statistical Software version 20. Ostend, Belgium: MedCalc Software Ltd.; 2021. Accessed May 2021. https://www.medcalc.org
- 17. Macleod MR, O'Collins T, Howells DW, et al. Pooling of animal experimental data reveals influence of study design and publication bias[J]. Stroke. 2004;35(5):1203‐1208. [DOI] [PubMed] [Google Scholar]
- 18. Review Manager (RevMan) [Computer Program]. Version 5.4, The Cochrane Collaboration; 2020.
- 19. Hedges LV, Olkin I. Statistical Methods for Meta‐Analysis. Academic Press; 2014. [Google Scholar]
- 20. Cochran WG. The combination of estimates from different experiments. Biometrics. 1954;10(1):101‐129. [Google Scholar]
- 21. Higgins JPT, Thompson SG, Deeks JJ, et al. Measuring inconsistency in meta‐analyses. BMJ. 2003;327(7414):557‐560. [DOI] [PMC free article] [PubMed] [Google Scholar]
- 22. DerSimonian R, Laird N. Meta‐analysis in clinical trials. Control Clin Trials. 1986;7(3):177‐188. [DOI] [PubMed] [Google Scholar]
- 23. Guo L, Zhou DA, Wu DI, et al. Short‐term remote ischemic conditioning may protect monkeys after ischemic stroke. Ann Clin Transl Neurol. 2019;6(2):310‐323. [DOI] [PMC free article] [PubMed] [Google Scholar]
- 24. Longa EZ, Weinstein PR, Carlson S, Cummins R. Reversible middle cerebral artery occlusion without craniectomy in rats. Stroke. 1989;20(1):84‐91. [DOI] [PubMed] [Google Scholar]
- 25. Belayev L, Alonso OF, Busto R, Zhao W, Ginsberg MD. Middle cerebral artery occlusion in the rat by intraluminal suture: neurological and pathological evaluation of an improved model. Stroke. 1996;27(9):1616‐1623. [DOI] [PubMed] [Google Scholar]
- 26. Chen J, Li Y, Wang L, et al. Therapeutic benefit of intravenous administration of bone marrow stromal cells after cerebral ischemia in rats. Stroke. 2001;32(4):1005‐1011. [DOI] [PubMed] [Google Scholar]
- 27. Metz GA, Whishaw IQ. Cortical and subcortical lesions impair skilled walking in the ladder rung walking test: a new task to evaluate fore‐and hindlimb stepping, placing, and co‐ordination. J Neurosci Methods. 2002;115(2):169‐179. [DOI] [PubMed] [Google Scholar]
- 28. Sun F, Xie L, Mao XO, Hill J, Greenberg DA, Jin K. Effect of a contralateral lesion on neurological recovery from stroke in rats. Restor Neurol Neurosci. 2012;30(6):491‐495. [DOI] [PMC free article] [PubMed] [Google Scholar]
- 29. Garcia JH, Wagner S, Liu KF, Hu XJ. Neurological deficit and extent of neuronal necrosis attributable to middle cerebral artery occlusion in rats: statistical validation. Stroke. 1995;26(4):627‐635. [DOI] [PubMed] [Google Scholar]
- 30. Sun J, Li T, Luan Q, et al. Protective effect of delayed remote limb ischemic postconditioning: role of mitochondrial KATP channels in a rat model of focal cerebral ischemic reperfusion injury. J Cereb Blood Flow Metab. 2012;32(5):851‐859. [DOI] [PMC free article] [PubMed] [Google Scholar]
- 31. Chen G, Shan X, Li X, Tao HM. Remote ischemic postconditioning protects the brain from focal ischemia/reperfusion injury by inhibiting autophagy through the mTOR/p70S6K pathway. Neurol Res. 2018;40(3):182‐188. [DOI] [PubMed] [Google Scholar]
- 32. Yang J, Balkaya M, Beltran C, Heo JH, Cho S. Remote postischemic conditioning promotes stroke recovery by shifting circulating monocytes to CCR2+ proinflammatory subset. J Neurosci. 2019;39(39):7778‐7789. [DOI] [PMC free article] [PubMed] [Google Scholar]
- 33. Ren C, Yan Z, Wei D, Gao X, Chen X, Zhao H. Limb remote ischemic postconditioning protects against focal ischemia in rats. Brain Res. 2009;1288:88‐94. [DOI] [PMC free article] [PubMed] [Google Scholar]
- 34. Qi Z, Dong W, Shi W, et al. Bcl‐2 phosphorylation triggers autophagy switch and reduces mitochondrial damage in limb remote ischemic conditioned rats after ischemic stroke[J]. Transl Stroke Res. 2015;6(3):198‐206. [DOI] [PubMed] [Google Scholar]
- 35. Gao X, Liu Y, Xie Y, Wang Y, Qi S. Remote ischemic postconditioning confers neuroprotective effects via inhibition of the BID‐mediated mitochondrial apoptotic pathway. Mol Med Rep. 2017;16(1):515‐522. [DOI] [PMC free article] [PubMed] [Google Scholar]
- 36. Qi ZF, Luo YM, Liu XR, et al. AKT/GSK 3β‐dependent autophagy contributes to the neuroprotection of limb remote ischemic postconditioning in the transient cerebral ischemic rat model. CNS Neurosci Ther. 2012;18(12):965‐973. [DOI] [PMC free article] [PubMed] [Google Scholar]
- 37. Hoda MN, Fagan SC, Khan MB, et al. A 2× 2 factorial design for the combination therapy of minocycline and remote ischemic perconditioning: efficacy in a preclinical trial in murine thromboembolic stroke model. Exp Transl Stroke Med. 2014;6(1):1‐9. [DOI] [PMC free article] [PubMed] [Google Scholar]
- 38. Ma J, Ma Y, Shuaib A, Winship IR. Improved collateral flow and reduced damage after remote ischemic perconditioning during distal middle cerebral artery occlusion in aged rats. Sci Rep. 2020;10(1):1‐14. [DOI] [PMC free article] [PubMed] [Google Scholar]
- 39. Hess DC, Hoda MN, Bhatia K. Remote limb perconditioning and postconditioning: will it translate into a promising treatment for acute stroke? Stroke. 2013;44(4):1191‐1197. [DOI] [PubMed] [Google Scholar]
- 40. Bagg S, Pombo AP, Hopman W. Effect of age on functional outcomes after stroke rehabilitation. Stroke. 2002;33(1):179‐185. [DOI] [PubMed] [Google Scholar]
- 41. Luk JKH, Cheung RTF, Ho SL, Li L. Does age predict outcome in stroke rehabilitation? A study of 878 Chinese subjects. Cerebrovasc Dis. 2006;21(4):229‐234. [DOI] [PubMed] [Google Scholar]
- 42. Yang S, Liu K, Ding H, et al. Longitudinal in vivo intrinsic optical imaging of cortical blood perfusion and tissue damage in focal photothrombosis stroke model. J Cereb Blood Flow Metab. 2019;39(7):1381‐1393. [DOI] [PMC free article] [PubMed] [Google Scholar]
- 43. McDonald MW, Dykes A, Jeffers MS, et al. Remote ischemic conditioning and stroke recovery. Neurorehabil Neural Repair. 2021;35(6):545‐549. [DOI] [PMC free article] [PubMed] [Google Scholar]
- 44. Li S, Hu X, Zhang M, et al. Remote ischemic post‐conditioning improves neurological function by AQP4 down‐regulation in astrocytes. Behav Brain Res. 2015;289:1‐8. [DOI] [PubMed] [Google Scholar]
- 45. Qi W, Zhou F, Li S, et al. Remote ischemic postconditioning protects ischemic brain from injury in rats with focal cerebral ischemia/reperfusion associated with suppression of TLR4 and NF‐кB expression. Neuroreport. 2016;27(7):469‐475. [DOI] [PubMed] [Google Scholar]
- 46. Bernhardt J, Hayward KS, Kwakkel G, et al. Agreed definitions and a shared vision for new standards in stroke recovery research: the stroke recovery and rehabilitation roundtable taskforce. Int J Stroke. 2017;12(5):444‐450. [DOI] [PubMed] [Google Scholar]
- 47. Yang S, Liu K, Yao L, et al. Correlation of optical attenuation coefficient estimated using optical coherence tomography with changes in astrocytes and neurons in a chronic photothrombosis stroke model. Biomed Opt Express. 2019;10(12):6258‐6271. [DOI] [PMC free article] [PubMed] [Google Scholar]
- 48. Su J, Zhang T, Wang K, Zhu T, Li X. Autophagy activation contributes to the neuroprotection of remote ischemic perconditioning against focal cerebral ischemia in rats. Neurochem Res. 2014;39(11):2068‐2077. [DOI] [PubMed] [Google Scholar]
- 49. Guo H, Zhao L, Wang B, et al. Remote limb ischemic postconditioning protects against cerebral ischemia‐reperfusion injury by activating AMPK‐dependent autophagy. Brain Res Bull. 2018;139:105‐113. [DOI] [PubMed] [Google Scholar]
- 50. Zhou M, Xia ZY, Lei SQ, Leng Y, Xue R. Role of mitophagy regulated by parkin/DJ‐1 in remote ischemic postconditioning‐induced mitigation of focal cerebral ischemia‐reperfusion. Eur Rev Med Pharmacol Sci. 2015;19(24):4866‐4871. [PubMed] [Google Scholar]
- 51. Wang J, Han D, Sun M, Feng J. A combination of remote ischemic perconditioning and cerebral ischemic postconditioning inhibits autophagy to attenuate plasma HMGB1 and induce neuroprotection against stroke in rat. J Mol Neurosci. 2016;58(4):424‐431. [DOI] [PubMed] [Google Scholar]
- 52. Ramagiri S, Taliyan R. Protective effect of remote limb post conditioning via upregulation of heme oxygenase‐1/BDNF pathway in rat model of cerebral ischemic reperfusion injury[J]. Brain Res. 2017;1669:44‐54. [DOI] [PubMed] [Google Scholar]
- 53. Liang D, He XB, Wang Z, et al. Remote limb ischemic postconditioning promotes motor function recovery in a rat model of ischemic stroke via the up‐regulation of endogenous tissue kallikrein. CNS Neurosci Ther. 2018;24(6):519‐527. [DOI] [PMC free article] [PubMed] [Google Scholar]
- 54. Parray A, Ma Y, Alam M, et al. An increase in AMPK/e‐NOS signaling and attenuation of MMP‐9 may contribute to remote ischemic perconditioning associated neuroprotection in rat model of focal ischemia. Brain Res. 2020;1740:146860. [DOI] [PubMed] [Google Scholar]
- 55. Hoda MN, Siddiqui S, Herberg S, et al. Remote ischemic perconditioning is effective alone and in combination with intravenous tissue‐type plasminogen activator in murine model of embolic stroke. Stroke. 2012;43(10):2794‐2799. [DOI] [PMC free article] [PubMed] [Google Scholar]
- 56. Morse JM. Determining sample size. Qual Health Res. 2000;10(1):3‐5. [Google Scholar]
Associated Data
This section collects any data citations, data availability statements, or supplementary materials included in this article.
Supplementary Materials
DocumentS1
DocumentS2
FigsureS2‐S7
TableS1‐S3
Data Availability Statement
The data that supports the findings of this study are available in the supplementary material of this article.