

Abstract
Purpose:
The aim of this study is to explore the relevance of scientific production on glaucoma using bibliometric tools.
Design:
Bibliographic study
Subjects:
Original articles published in the timeframe 1900-2019
Methods:
We performed a search in Web of Science for documents published between 1900 and 2019. We used bibliometric indicators to explore documents production, dispersion, distribution, time of duplication and annual growth, as characterized by Price’s law of scientific literature growth, Lotka’s law, the transient index and the Bradford model. We also calculated the participation index of different countries and institutions. Finally, we explored with bibliometric mapping the co-occurrence networks for the most frequently used terms in glaucoma research.
Main outcome measure:
Bibliometric indicators for individuals, institutes and countries
Results:
A total of 33,631 original articles were collected from the timeframe 1900-2019. Price’s law shows an exponential growth. Scientific production is better adjusted to exponential growth (r = 0.967) than linear growth (r = 0.755). Literature on glaucoma research increased its growth in the last 30 years at a rate of 5.1% per year with a production that doubles its size every 13.9 years. The transience index is 60.08%; this indicates that most of the scientific production is due to very few authors. Bradford’s law shows a high concentration of articles published in a small core of specialized journals. Lotka’s law indicates that the distribution of authors is heavily concentrated in small producers. USA and University of London have the highest production of original articles. Map network visualization shows the generated term map detailing clusters of closely related terms.
Conclusions:
Glaucoma literature has had exponential growth. There is a very high rate of transience that indicates the presence of numerous authors who sporadically publish on this topic. No evidence of a saturation point in the glaucoma literature was observed.
Keywords: glaucoma, scientific production, bibliometric indicators, bibliometric mapping, collaborative networks
INTRODUCTION
Glaucoma affects more than 70 million people worldwide with approximately 10% being bilaterally blind, making it the leading cause of irreversible blindness in the world.1 It is a multifactorial optic neuropathy characterized by slowly progressive neurodegeneration of retinal ganglion cells (RGC) and their axons characterized by a specific pattern of optic nerve head (ONH) and visual-field damage.2,3 Examination of the structure and the function of the ONH and the retinal nerve fibers is essential to diagnose and monitor glaucoma.4–6 1, 21, 21, 2Considerable efforts have been made to show the efficacy, side effects and, costs of the medications, and laser as initial treatment of glaucoma. Surgical approaches to lower IOP and treat glaucoma have had an increasing role in disease management, particularly with development of less invasive and safer procedures.16–18
The quantity and quality of articles published in peer-reviewed biomedical journals indexed in different databases are constantly increasing. Bibliometrics analysis includes the collection, processing and management of quantitative bibliographic data from scientific publications,19 and their statistical indicators allow measurement of the growth, size and distribution of scientific literature on the topic in question during a given time period. It is the most commonly used tool to identify important discoveries and studies which have had a disproportionate influence in a particular field.20 Studying the origin, format, type and citation count of published journal articles provides an insight into the quantity and scholarly impact of research produced within a certain field. Citation analysis can also be an important parameter to prioritize research funding in this era emphasizing cost-effectiveness. Without objective information about current research output it is difficult to plan for necessary improvements in infrastructure related to the understanding, treatment and prevention of glaucoma diseases.
Bibliometric analyses have been published in many specialties and subspecialties.21–26 Our group has used a bibliometric approach to study the evolution of scientific literature in different areas of the biomedical sciences.27–43 However, to date, little is known about the contributions of individual researchers and research centers in glaucoma. In this article, we examine the patterns and trends of published glaucoma-related research worldwide. In particular, the performance of researcher and the types of their glaucoma-related articles are evaluated.
MATERIAL AND METHODS
Data Source
The initial data search was conducted through two databases, considered to be the most exhaustive within the biomedical field: SCOPUS (Elsevier BV, Amsterdam, The Netherlands) and the main collection of Web of Science (WoS) (Institute for Scientific Information (ISI) and Clarivate Analytics, Philadelphia, USA). According to the search strategy, a largest set of references was retrieved for WoS, and therefore it was chosen to carry out the digital file selection. The WoS was preferred over PubMed because it indexes journals with a high scientific quality and provides a unique citation report function.
Search strategy
Remote downloading techniques were used to select references published from 1900 to 2019. The selection of references was limited to those available in the chosen field for TI (title) as main descriptor “glaucoma”. To minimize the inclusion of off-topic items, we searched only in the “title”. Data were extracted from WoS database at one day (May 21, 2020) to avoid bias because of daily updating in the database.
This study took into account all original articles, brief reports, reviews, editorials, letters to the editor, and so on; it was also made sure that the duplicated documents were eliminated.
Data categorization
After downloading the metadata and exact bibliographic details of all glaucoma publications, the results were analyzed according to the criteria of chronological distribution, country of origin, affiliation, sources and authors of the documents, keywords and descriptors used. The methodology applied in this study was comparable to recent bibliometric studies of our group.39–43
Bibliometric indicators
For this analysis, the most common bibliometric indicators were used: Price index, doubling time, annual growth rate, Price transience index, Lotka’s law and the Bradford zones.
Price’s law was chosen as bibliometric indicator of production,44 because it is the most widely used to analyze productivity on a specific discipline or a particular country. In order to assess whether the growth of scientific production in this field follows Price’s Law of Exponential Growth, we carried out a linear adjustment of the data obtained, and another adjustment to an exponential curve.
Time of duplication and the annual growth rate is related to the growth of a subject of study. The first is an indicator that informs us of the time required for the scientific production of a given subject to double. The form of growth was studied from the equation of Egghe and Ravichandra;45 this function is represented mathematically as: C (t) = cgt, where C (t) is the total number of documents produced at time t; c and g represent estimated constants of the observed data, taking into account that c > 0, g > 1, and t ≥ 0; t is the number of chronological years studied in the research period (t = 0, 1, 2, …, n). The model not only provides an average rate of growth, but also offers a rate of duplication. To estimate the duplication time (D) of the scientific literature, the following equation is used: D = LN (2) / LN (g).
As a bibliometric indicator for dispersion of scientific literature, Bradford zones’ model was applied.46 In order to show the distribution of literature, this model shows that the highest percentage of bibliographic production on a specific subject tends to be concentrated in a small numbers of journals. He proposed a template of concentric zones of productivity with decreasing density of information that allows for faster performance expanding the search outside its core. This model helps to determine which journals are preferred by authors to publish and, therefore, which are the most specific ones on a subject or discipline. The number of journals on the nucleous (core) and successive zones are expressed by a ratio as 1, n, n2,…
To assess the influence of publications, the Impact Factor (IF) is used. This indicator, developed by the Institute for Scientific Information (Philadelphia, PA, USA), is published annually in the Journal Citation Reports (JCR) section of the Science Citation Index (SCI). The IF is calculated taking into account the times a journal has been cited in the SCI database in the last two years and the total number of articles published in this journal in those same years. Despite its limitations47, IF has been traditionally considered an index of journal’s prestige.48
Lotka’s law, also named “inverse square law of scientific production” was used to provide information of author’s distribution based on number of publications.49 This law establishes the number of authors (A) who have published a number (n) of references in a period of several years of activity A(n), is equal to the number of those who have published a single reference A(1), in the same period of time, divided by the square of n. Its function is mathematically expressed as: An = Kn−b, n = 1, 2, 3, …, where An represents the probability that an author produces n publications on a subject, while K and b are parameters to estimate depending on the data. According to this law, if the studied period is long enough and the bibliographic search is as complete as possible “the number of authors that publish n papers is inversely proportional to n2”.
Other indicators that have been included is the author’s productivity index (PI). PI allows the establishment of three levels of productivity: PI = 0 (transience index: authors with a single paper), 0 < PI < 1 (those authors that published between 2 and 9 papers), and PI ≥ 1 (very productive authors with 10 or more papers).
We have used the h-index to quantify the authors’ activity. This index is one of the bibliometric indicators most widely used to rate the success of a researcher’s performance.50 Nevertheless, the h-index also has its limitations, as it tends to penalize those authors that prioritize quality over quantity and do not publish extensively, while favouring others with a more protracted career,51 who have managed to publish more.52 The g-index was introduced to measure the global citation performance of a set of articles,53 together with the p index, which stems from the interrelationship between the two, and is calculated as its coefficient: p = h / g.53,54
Bibliometric mapping
For bibliometric mapping,55 we studied the keywords, and the co-occurrence networks for the most frequently used terms in the titles and abstracts of the publications related to glaucoma over the time interval. Each term is demonstrated by a circle, where its diameter and the size of its label illustrate the frequency of the term, and its color reflects most frequently encountered topics in this field.56
The analysis of keywords is included within the classification of relational and multidimensional indicators.57 By keyword analysis, we mean the study of the co-occurrences or joint appearances of two terms in a given text in order to identify the conceptual and thematic structure of a scientific domain.
We have also analyzed bibliographic coupling, a measure that uses citation analysis to establish a similarity relationship between documents. Bibliographic coupling occurs when two articles reference a third common article in their references. Bibliographic coupling was introduced by Kessler as a method of grouping technical and scientific documents and facilitating the provision of scientific information and the retrieval of documents.58
Finally, we have applied the mapping to identify the collaborative networks of the institutions and authors, to determine which authors produce, how much and how they relate and collaborate. These maps show the importance of the use of relational indicators in studies to analyze the scientific production of research groups, in order to determine their publication dynamics, with emphasis on measures such as centrality, density and size of the network.59
Statistical Analysis
Statistical analysis tests were performed using the Statistical Package for the Social Sciences (SPSS) version 23.0, to evaluate the growth pattern of research output, linear and exponential regression adjustments were compared for trend in the publication. The software VOSwiever (Centre for Science and Technology Studies, Leiden University, The Netherlands) was used to perform the bibliometric mapping.56
RESULTS
Using the search criteria, we retrieved 33,631 documents in a 118 years period, from 1900 to 2019. The chronological distribution of the publication showed a notable increase in the number of articles generated in glaucoma research (Figure 1), especially from 1999.
Figure 1.
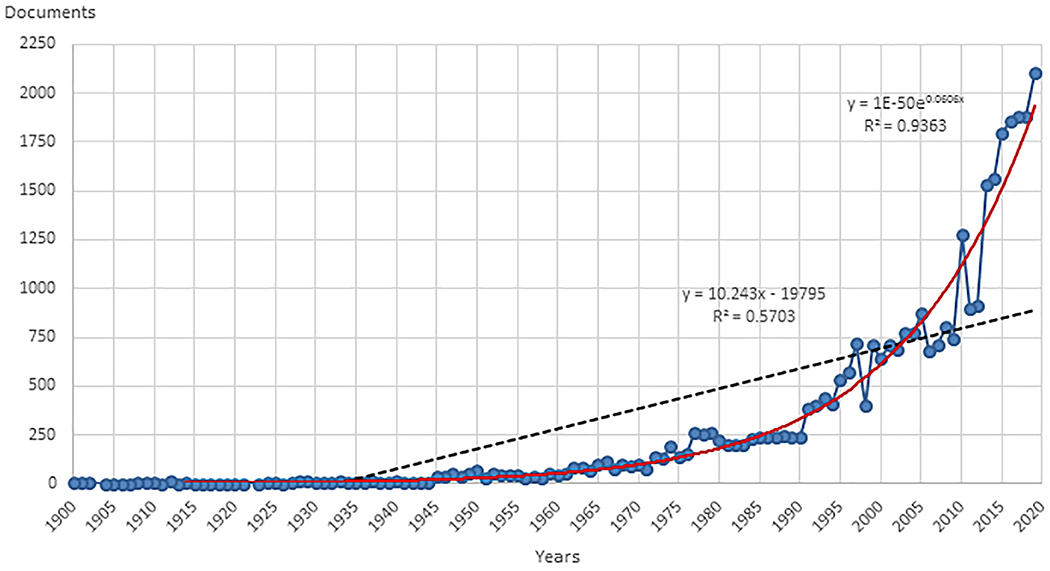
Chronological distribution. Linear adjustment (black): y = 1.5972x – 3153.6 (r = 0.7552). Exponential adjustment (red): y = 1E-50e0.0606x (r = 0.9676).
If we analyze the distribution by five-year periods, we see that the last two (2010-2014 and 2015-2019) contain the greatest number of documents, with 18.39% and 28.30% respectively. In these periods, there was a significant increase with respect to the previous period of 62.14 and 53. 88% respectively.
To assess whether the scientific production on glaucoma follows the Price law, a linear trend curve expressed in the following way y = 10,243x – 19795 was created. Similarly, an exponential trend line was created according to the equation y = 1E-50e0.0606x.
As reflected in Figure 1, the mathematical adjustment to a linear curve reveals a correlation coefficient of 0.7552, indicating that 24.48% cannot be explained by this adjustment. On the other hand, the exponential adjustment of the measured values provides a 0.9676 coefficient and therefore a residual variability percentage of 3.24%. These results suggest that the repertoire analysis is more suitable for an exponential fitting than a linear one. Therefore, it does comply with the postulates of the Price Law, and the growth in the area of glaucoma is exponential.
Table 1 shows the parameters and values obtained from the application of the exponential model by the non-linear regression method. In order to contextualize the growth of publication on glaucoma, we compared it with two period one covering 88 years, from 1900 to 1989, and another more specific one, which includes the last 30 years, from 1990 to 2019.
Table 1.
Values of the parameters obtained with the exponential model.
| Parameter | Estimate (95% CI) | Model r2 | |
|---|---|---|---|
| Model 1 (Period 1900-1989) | c | 3.772 (2.343, 5.201) | 0.921 |
| g | 1.051(1.046, 1.056) | ||
| Model 2 (Period 1990-2000) | c | 298.617 (233.676, 363.558) | 0.909 |
| g | 1.069 (1.059, 1.079) |
In the first case (Table 1, Model 1), the value of c is 2.735 and that of g 1.070. With these values, the Egghe and Ravichandra Rao equation can be established, and thus predict the growth of the published literature on glaucoma: C (t) = 3.772 * 1.0051t. According to this method, literature on glaucoma has grown at a rate of 6.6% per year, with a production that doubles its size every 10.8 years. This model is explained at 92.1%.
In the second case (Table 1, Model 2), the value of c is 298,617 and that of g 1.069. The equation of Egghe and Ravichandra Rao is C (t) = 298.617 * 1.069t, the publication doubles in size every 13.9 years and grows at 5.1% per year. This model is explained at 90.9%.
After applying the Lotka law, the distribution of the authors was heavily concentrated in small producers. Only 4.99% of the authors (n = 2,437) have a production of 10 or more articles. The data shows a high index of transience (occasional authors) of 60.08% (29,342 authors). The total number of authors for 33,631 papers was 48,836 authors, representing an index of co-authorship of 1.45. After manual filtering of the data, due to the lack of standardization of the authors’ names, two authors stand out for their production, Robert N. Weinreb and Robert Ritch, with 1.62% and 1.17% of the articles published on glaucoma (Table 2). Likewise, the importance of the authors who research on this topic is demonstrated, since among the first 10, we find 7 with an h-index above 60 and 2 above 90. If we take into account the p-index, there are 5 authors above 1.6.
Table 2.
Most productive authors.
| Author | Nº. Documents | % | h-index* | g-index | p-index | Affiliation |
|---|---|---|---|---|---|---|
| Weinreb RN | 545 | 1.62 | 97 | 145 | 1.495 | University of California San Diego |
| Ritch R | 393 | 1.17 | 75 | 133 | 1.773 | New York Eye & Ear Infirmary of Mount Sinai |
| Quigley HA | 322 | 0.96 | 98 | 199 | 2.031 | Johns Hopkins University |
| Caprioli J | 274 | 0.81 | 62 | 105 | 1.694 | University of California Los Angeles |
| Aung T | 258 | 0.77 | 79 | 145 | 1.835 | Singapore National Eye Center |
| Liebmann JM | 305 | 0.91 | 60 | 91 | 1.517 | Columbia University |
| Medeiros FA | 247 | 0.73 | 57 | 94 | 1.649 | Duke University |
| Zangwill LM | 245 | 0.73 | 63 | 95 | 1.508 | University of California San Diego |
| Harris A | 226 | 0.67 | 30 | 46 | 1.533 | Indiana University System |
| Spaeth GL | 220 | 0.65 | 52 | 81 | 1.558 | Jefferson University |
Web of Science 2020 data.
The map represented in Figure 2 shows the collaboration networks between the authors. The diameter of the nodes is related to the productivity of each of the authors, the lines or links establish the existence of a relationship between a pair of authors, and the thickness of the lines refers to the intensity of the communication between two or more authors. In this way, we can verify that the two largest nodes correspond to the two most productive authors, as indicated above. There also are strong collaborative networks among other authors.
Figure 2.
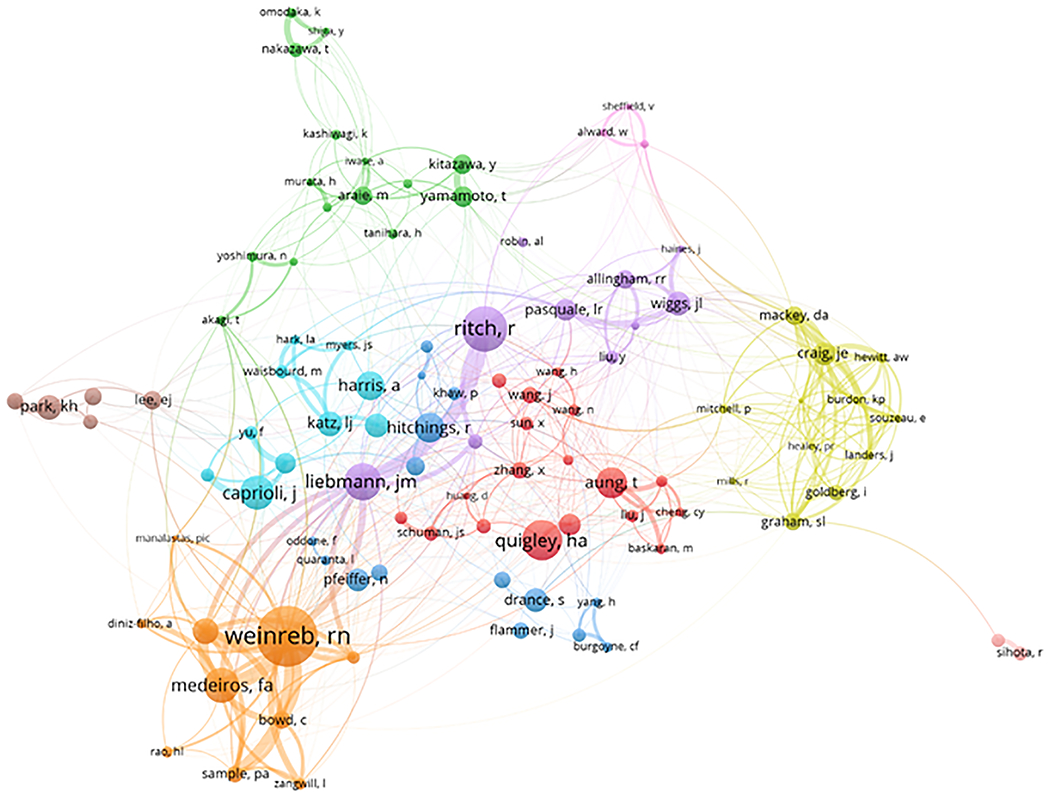
Collaborative network of the most productive author
Table 3 shows the distribution of journals per Bradford zone. It should be noted that only three journals make up the core. These are Investigative Ophthalmology & Visual Science, with just over 20% of total production, specifically 21.91%, American Journal of Ophthalmology and Journal of Glaucoma with 5.16 and 5.11%, respectively, which implies a high concentration of articles published in a small core of more specialized journals. These more specialized journals in glaucoma research, present a high IF of 3,470, 4,013 and 1,661 respectively, which shows the interest in this area of research.
Table 3.
Distribution of journals in Bradford’s zones.
| Nº of journals | % of journals | Nº of articles | % of articles | Bradford multiplier | |
|---|---|---|---|---|---|
| Core | 3 | 0.13 | 10,826 | 32.19 | |
| Zone 1º | 23 | 1.00 | 11,212 | 33.34 | 7.66 |
| Zone 2º | 2,276 | 98.87 | 11,593 | 34.47 | 98.96 |
| Total | 2,302 | 100.00 | 33,631 | 100.00 | 53.31 |
The geographical and affiliation distribution of the documents is presented in Figure 3. This analysis shows that 10 countries represent 72.46% of production, with the United States being the largest producer, with 32.82% of the documents. As far as the most productive institutions are concerned, we can say that most of the research on glaucoma takes place in academic settings. Thus, among the 10 most productive, 8 are in academic settings In this respect, the University of London stands out with 6.23% of the total production of research on glaucoma, and University of California is the second (6.10% of the total production).
Figure 3.
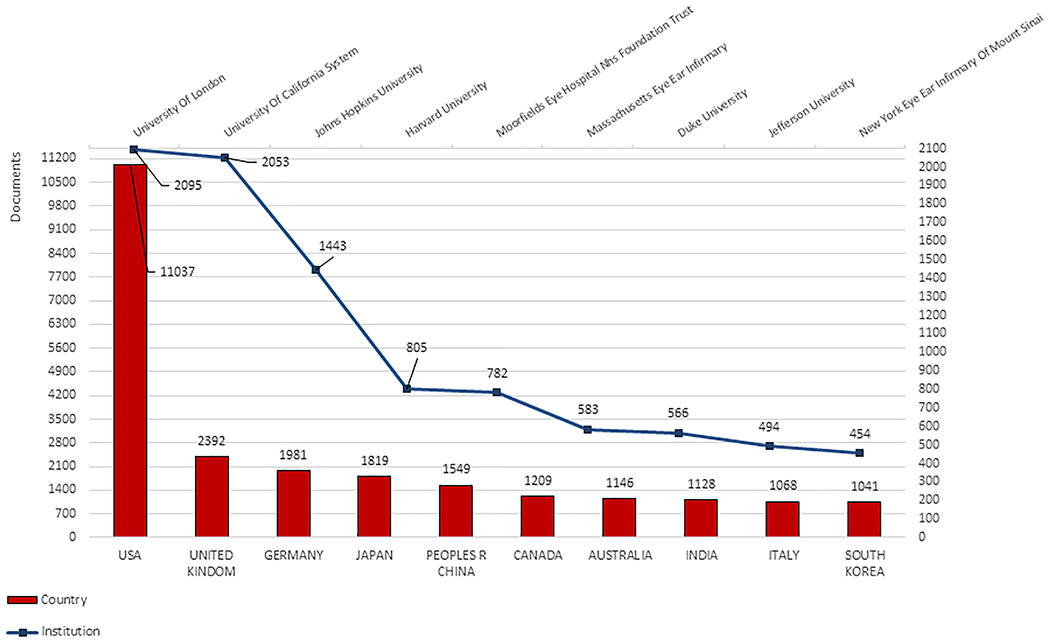
More productive countries and institutions in the generation of scientific literature on glaucoma.
Figure 4 shows the collaboration networks between institutions and countries. In the first case, there is a strong relationship between Johns Hopkins University and Harvard University with the clusters in red, and in blue the relationship between the University of California San Diego and the New York Eye and Ear Infirmary. With regard to the networks between countries, we found the United States as the central cluster.
Figure 4.
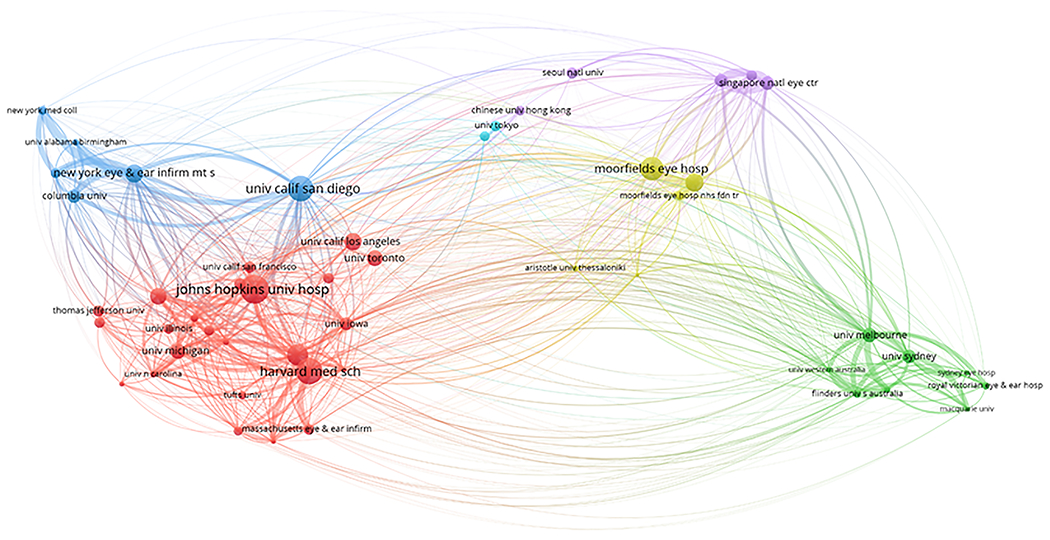
Collaborative network of the most productive institutions
The map presented in Figure 5 shows the terms most frequently used in the titles and abstracts of publications related to glaucoma. The larger the circle, the higher the frequency of occurrence of the specific term and the smaller the distance between two terms/circles, the higher the co-occurrence of the terms. Colors indicate clusters of closely related terms. Cluster analysis based on term co-occurrence identified five major clusters (green, red, purple, blue and yellow), being the main term (glaucoma task) situated in the red cluster, highly connected with terms from the other clusters. Important terms are related with characteristics of the glaucoma task as open-angle glaucoma, intraocular pressure and ocular hypertension. The common use in recent decades of optical coherence tomography techniques is reflected in the yellow cluster. We can also highlight the use of pharmacological treatments, such as timolol or latanoprost reflected in a purple cluster. Other types of treatment are reflected in the blue cluster, for example trabeculectomy or phacoemulsification.
Figure 5.
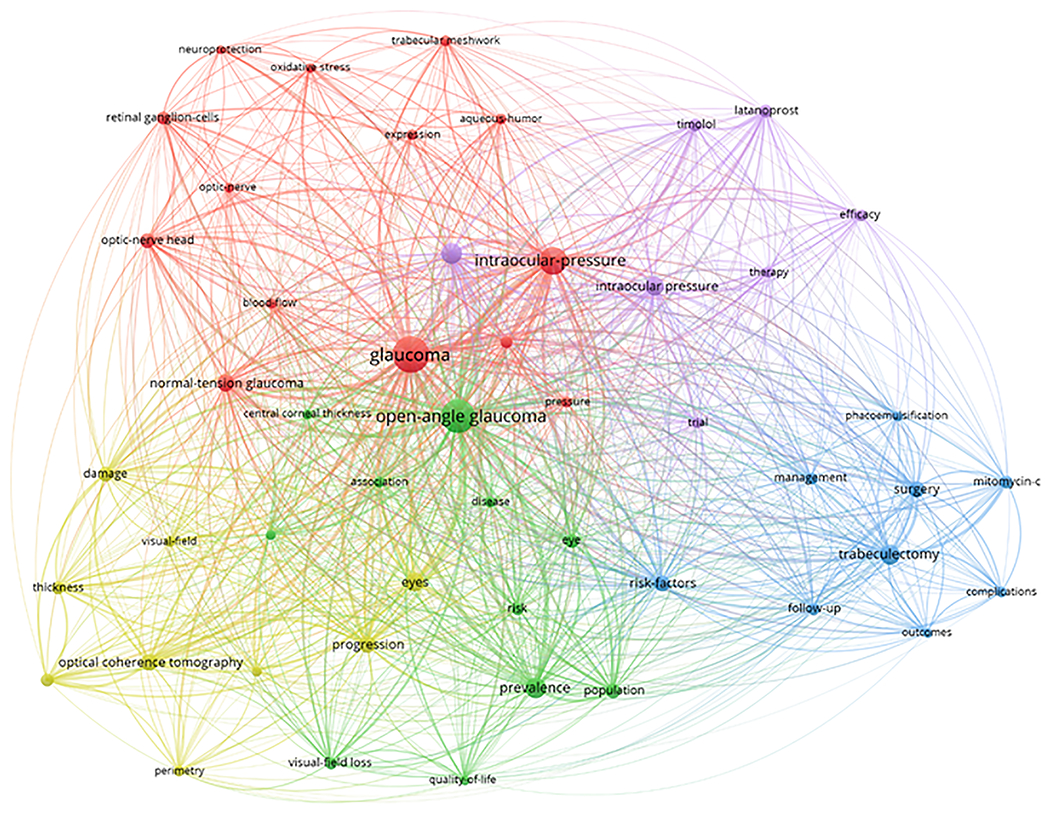
VOSviewer co-occurrence keywords map.
DISCUSSION
This study assessed glaucoma-related research conducted between 1900 and 2019. Bibliometric indicators were used to explore the research productivity of ophthalmologists, optometrists, and vision scientists worldwide. We demonstrated that literature on glaucoma research has undergone an exponential growth with a production that doubles its size every 10 years until 1990 and every 14 years in the last three decades. This increase was more pronounced after 2000 with publications of landmark studies and randomized clinical trials. In addition, payers and regulatory authorities became more aware of the burden of glaucoma disease on the burden and economic consequences of glaucoma upon healthcare systems and patients, especially elderly patients. The rapid increase in publications also was accompanied by the development and proliferation of imaging technology for diagnosis and monitoring of the disease, and a prominent proportion of the publications focused on this field of research.
Another interesting quantitative aspect of this bibliometric analysis is the quality of the scientific production. We approached this problem with the evaluation of the repercussion index of the publications included in the dataset. It is notable the main journals studied have a high IF. Likewise, the importance of the authors who research on this topic is demonstrated, since the first ten presents an h-index above 30 and six above 60 (see Table 2).
In the present study, the US, the UK, and Germany had the highest account of glaucoma articles published within the literature and together consisted of 40% of the published papers. Although no reviews have reported glaucoma research productivity, there have been a few studies of ophthalmology productivity, as measured by publications.26,60–62 Guerin et al62 examined the publications from five ophthalmology journals over 5 years ( 2002 to 2006) and found that the overall number of articles published increased by over 29% during this period. In another study, the US, the UK and Europe account for around 60% of articles published within the ophthalmology literature between 2009 and 2013.26
Prior studies also provided interesting correlations with economic support for research:26,62 The US, which ranked first in ophthalmic research productivity, contributed 40% of the papers identified and devoted 2.7% of gross domestic product (GDP) to research and development. They showed that research expenditure and GDP was significantly correlated with both research output and scholarly impact and expected that the US to remain the dominant figure in ophthalmic research for at least the next 10 years. In a study by Mandal et al60, published in 2004, it was found that researchers in the developing world contributed only 5% of the literature, compared to 90% from the developed world. Although this trend was changed over the next 10 years,26 similar results were found in the present study and 30% of the glaucoma publications of the last 10 years now originated from the developing countries.
The fact that the USA is responsible for 32.82% of all the documents that were studied can be correlated with the documents that express the funding of the research by different North American Agencies: the United States Department of Health Human Services (n = 2,916), the National Institutes of Health (NIH) (n = 2,878), the NHI National Eye Institute (n = 2,409), and the Research to Prevent Blindness (n = 980). In this regard, it should be made clear that a country’s scientific production in a given field tends to reflect a science research and development policy. In general, there is confirmation of the notion that the higher the funds invested, the greater the research production.32,34
University of London, University of California and John Hopkins University had the largest contributions to glaucoma research in the present study. It is clear that the academic climate is a significant indicator of basic and clinical science research activity. Collaborations are another main reason that is linked to publishing productivity.63–65 Collaboration in research can take many forms of activity ranging from offering general advice and opinion to active and sustained participation and contribution of physical and intellectual resources. Scientists employed in different organizations may collaborate by sharing data or ideas through correspondence or at conferences, visiting each other’s research facilities, or actually performing parts of a project separately and then integrating the results.63
There is abundant evidence that research collaboration has become the norm in every field of scientific and technical research.66 The co-author concept of collaboration has several advantages, including verifiability, stability over time, data availability and ease of measurement.67 Moreover, funding agencies, particularly government agencies, facilitate active research collaboration as part of their funding conditions.65 In addition, large population-based health administrative databases, clinical registries, and data linkage systems are a rapidly expanding resource for health research.68 The last decade has seen a dramatic increase in the use of large databases for ophthalmic research which requires collaborations with many health care institutes.69 Glaucoma research has benefited from the use of these databases in expanding the breadth of knowledge in areas such as disease surveillance, disease etiology, health services utilization, health outcomes, and more recently use of artificial technology diagnosis and management of the disease.
One study70 that examined 22 different fields of science showed that at least 60% of publications are co-authored. Although the average index of signatures / paper of the documents is 1.45, team-working research and author collaborations are reflected in our repertoire. This low figure is explained by the temporal amplitude of our repertoire, since the index signatures / document was much lower in the articles published before the nineties. Since then, it is clear that a tendency exists towards the increment in the number of authors on scientific papers, and that this effect is mainly due to a higher degree of collaboration in glaucoma research between different investigators. We also found that the most productive glaucoma authors have intensive collaboration in their field (Figure 2). Besides, some relationships, such as those between the University of California San Diego and the New York Eye and Ear Infirmary or between Johns Hopkins University and Harvard University, are particularly productive in glaucoma research. However, the specifics of these relationships often depend on the relationships among individuals, and not the institutions, and that they can change, particularly if researchers change institutions. But, we must also bear in mind that the index of transience is very high. This indicates that 29,342 authors (60% of the total) are occasional authors, who have contributed to the scientific production on glaucoma only tangentially.
Although we did not examine specific research topics, some terms like open angle glaucoma, intraocular pressure, optical coherence tomography, prevalence, trabeculectomy were more commonly used terminology in the literature (see the VOSviewer co-occurrence keywords and terms maps in Figure 5) and can provide some hints for future direction of global ophthalmic research. Of note, the disease burden varies from country to country and therefore, that the research priorities will also differ. Research in high output countries has focused on open angle glaucoma, which accounts for 90% of glaucoma cases in these populations.1 This is in comparison to angle closure glaucoma, which blinds ten times more people than open angle glaucoma, and of which 85% of cases are to be found in China, India, and south-east Asia.1 Schulz et al26 showed a significant positive trend in ophthalmology publications in these countries and expected that as the research contribution of these countries grows, future scientific advances will reflect the differing ophthalmic needs of these populations.
Limitations
Bibliometry has become a fundamental tool for evaluating the results of scientific activity.71 However, previous bibliometric studies have addressed limitations characteristic of this sociometric approach.72 This study has some limitations. We have chosen to narrow the search to only the title of the manuscripts, and not the abstract. Otherwise, the sample might include less representative documents that are not focused on the study of the glaucoma. The articles included in the analyzed repertoire only constitute a partial sample of the international production on glaucoma research. In particular, the limits introduced by the bibliographic databases determine the subsequent analysis. For example, if the authors did not specify the term “glaucoma” in the title of their manuscript, this document would not appear in our database. Moreover, most of the papers (92%) that were included in the present study were published in English, which is the predominant language in current medical research. 73 This may produce a bias toward English-speaking countries. However, all the records in the WoS contain the title in English, regardless of the language in which the article is published and this reduces this bias.
On the other hand, articles were identified and categorized according to the country of the first author using data submitted to the literature. It is possible that considering only the primary author’s institution missed the contribution of other countries in a global research network, particularly where the senior author is from another country. Unfortunately, when multiple authors are assigned to an article, it is difficult to make any decision about the relative contribution of each author. As in almost all cases the first author will have played a key role in the research and article submission process,74 using the primary author’s country of affiliation is probably the most reliable indicator for comparing the research contribution of different countries and institutes.
Finally, we did not look at articles published in journals that are not ophthalmology-specific. Although the proportion of those articles that are published in more general medical and scientific journals is unclear, these articles might be skewed particularly toward higher-quality research with a higher rate of citation.75
However, the well-known reputation of the journals included in the database used and its wide coverage make for a representative sample of the international research on glaucoma.
In conclusion, publications of glaucoma research have grown considerably during the past three decades. The US contributes approximately one-third of the worldwide articles, followed by UK and Germany. Institutional and individual collaborations have had a key role for glaucoma research productivity and will be a mainstay of future glaucoma studies.
Financial Support:
National Institutes of Health/National Eye Institute Grants EY029058, University of California Tobacco Related Disease Research Program (T31IP1511), an unrestricted grant from Research to Prevent Blindness (New York, NY).
Commercial Disclosures:
Javier Povedano-Montero, MS, PhD; none,
Robert N Weinreb, MD: Research support - Carl Zeiss Meditec, Centervue, Heidelberg Engineering, Konan, National Eye Institute, Topcon and Optovue; Consultant – Aeries Pharmaceuticals, Allergan, Bausch&Lomb, Equinox, Eyenovia and Topcon,
Sasan Moghimi, MD: none,
Francisco López-Muñoz, MD, PhD: Research support, educational activities or consultant - AstraZeneca, Juste, Janssen-Cilag, Almirall, Ratiopharm, Normon, Infaca, Alter, Dupont Pharma, Lundbeck, Lilly, and Aristo Pharma.
Acronyms:
- GDP
gross domestic product
- IOP
intraocular pressure
- JCR
Journal Citation Reports
- ONH
optic nerve head
- RGC
retinal ganglion cells
- SCI
Science Citation Index
- WoS
Web of Science
REFERENCES
- 1.Tham YC, Li X, Wong TY, et al. Global prevalence of glaucoma and projections of glaucoma burden through 2040: a systematic review and meta-analysis. Ophthalmology. 2014;121:2081–2090. [DOI] [PubMed] [Google Scholar]
- 2.Weinreb RN, Aung T, Medeiros FA. The pathophysiology and treatment of glaucoma: a review. JAMA. 2014;311:1901–1911. [DOI] [PMC free article] [PubMed] [Google Scholar]
- 3.Weinreb RN, Leung CK, Crowston JG, et al. Primary open-angle glaucoma. Nat Rev Dis Primers. 2016;2:16067. [DOI] [PubMed] [Google Scholar]
- 4.Johnson CA, Sample PA, Cioffi GA, et al. Structure and function evaluation (SAFE): I. Criteria for glaucomatous visual field loss using standard automated perimetry (SAP) and short wavelength automated perimetry (SWAP). Am J Ophthalmol. 2002;134:177–185. [DOI] [PubMed] [Google Scholar]
- 5.Medeiros FA, Lisboa R, Weinreb RN, et al. A combined index of structure and function for staging glaucomatous damage. Arch Ophthalmol. 2012;130:1107–1116. [DOI] [PMC free article] [PubMed] [Google Scholar]
- 6.Medeiros FA, Gracitelli CP, Boer ER, et al. Longitudinal changes in quality of life and rates of progressive visual field loss in glaucoma patients. Ophthalmology. 2015;122:293–301. [DOI] [PMC free article] [PubMed] [Google Scholar]
- 7.Kerrigan-Baumrind LA, Quigley HA, Pease ME, et al. Number of ganglion cells in glaucoma eyes compared with threshold visual field tests in the same persons. Invest Ophthalmol Vis Sci. 2000;41:741–748. [PubMed] [Google Scholar]
- 8.Kuang TM, Zhang C, Zangwill LM, et al. Estimating lead time gained by optical coherence tomography in detecting glaucoma before development of visual field defects. Ophthalmology. 2015;122:2002–2009. [DOI] [PMC free article] [PubMed] [Google Scholar]
- 9.Leung CKS, Cheung CYL, Weinreb RN, et al. Evaluation of retinal nerve fiber layer progression in glaucoma: a study on optical coherence tomography guided progression analysis. Invest Ohthalmol Vis Sci. 2010;51:217–222. [DOI] [PubMed] [Google Scholar]
- 10.Urata CN, Mariottoni EB, Jammal AA, et al. Comparison of Short- And Long-Term Variability in Standard Perimetry and Spectral Domain Optical Coherence Tomography in Glaucoma. Am J Ophthalmol. 2020;210:19–25. [DOI] [PMC free article] [PubMed] [Google Scholar]
- 11.Caprioli J, Gaasterland D, Gross R. Preferred Practice Pattern—Primary open angle glaucoma. San Francisco: American Academy of Ophthalmology, 2000:5–10. [Google Scholar]
- 12.AGIS Investigators. The Advanced Glaucoma Intervention Study (AGIS): 7. The relationship between control of intraocular pressure and visual field deterioration. Am J Ophthalmol. 2000;130:429–440. [DOI] [PubMed] [Google Scholar]
- 13.Lichter PR, Musch DC, Gillespie BW, et al. Interim clinical outcomes in the Collaborative Initial Glaucoma Treatment Study comparing initial treatment randomized to medications or surgery. Ophthalmology. 2001;108:1943–1953. [DOI] [PubMed] [Google Scholar]
- 14.Heijl A, Leske MC, Bengtsson B, et al. Reduction of intraocular pressure and glaucoma progression: results from the Early Manifest Glaucoma Trial. Arch Ophthalmol. 2002;120:1268–1279. [DOI] [PubMed] [Google Scholar]
- 15.Kass MA, Heuer DK, Higginbotham EJ, et al. The Ocular Hypertension Treatment Study - A randomized trial determines that topical ocular hypotensive medication delays or prevents the onset of primary open-angle glaucoma. Arch Ophthalmol. 2002;120:701–713. [DOI] [PubMed] [Google Scholar]
- 16.Gedde SJ, Schiffman JC, Feuer WJ, et al. Treatment outcomes in the Tube Versus Trabeculectomy (TVT) study after five years of follow-up. Am J Ophthalmol. 2012;153:789–803 e2. [DOI] [PMC free article] [PubMed] [Google Scholar]
- 17.Kansal V, Armstrong JJ, Hutnik CM. Trends in Glaucoma Filtration Procedures: A Retrospective Administrative Health Records Analysis Over a 13-Year Period in Canada. Clin Ophthalmol. 2020;14:501–508. [DOI] [PMC free article] [PubMed] [Google Scholar]
- 18.Rathi S, Andrews CA, Greenfield DS, et al. Trends in Glaucoma Surgeries Performed by Glaucoma Subspecialists versus Nonsubspecialists on Medicare Beneficiaries from 2008 through 2016. Ophthalmology. 2021;128;30–38. [DOI] [PMC free article] [PubMed] [Google Scholar]
- 19.Moed HF, Burger WJM, Frankfort JG, et al. A comparative study of bibliometric past performance analysis and peer judgement. Scientometrics. 1985;8(3–4):149–159. [Google Scholar]
- 20.Moed HF. The impact-factors debate: the ISI’s uses and limits. Nature. 2002;415:731–732. [DOI] [PubMed] [Google Scholar]
- 21.Hennessey K, Afshar K, Macneily AE. The top 100 cited articles in urology. Can Urol Assoc J. 2009;3:293–302. [DOI] [PMC free article] [PubMed] [Google Scholar]
- 22.Brandt JS, Downing AC, Howard DL, et al. Citation classics in obstetrics and gynecology: the 100 most frequently cited journal articles in the last 50 years. Am J Obstetr Gynecol. 2010;203:355. e1–355. e7. [DOI] [PubMed] [Google Scholar]
- 23.Kumaragurupari R, Sieving PC, Lalitha P. A bibliometric study of publications by Indian ophthalmologists and vision researchers, 2001–06. Indian J Ophthalmol. 2010;58:275–280. [DOI] [PMC free article] [PubMed] [Google Scholar]
- 24.Mwanza JC, Chang RT, Budenz DL, et al. Reproducibility of peripapillary retinal nerve fiber layer thickness and optic nerve head parameters measured with cirrus HD-OCT in glaucomatous eyes. Invest Ophthalmol Vis Sci. 2010;51:5724–5730. [DOI] [PMC free article] [PubMed] [Google Scholar]
- 25.Loomes DE, van Zanten SV. Bibliometrics of the top 100 clinical articles in digestive disease. Gastroenterology. 2013;144:673–676 e5. [DOI] [PubMed] [Google Scholar]
- 26.Schulz CB, Kennedy A, Rymer BC. Trends in ophthalmology journals: a five-year bibliometric analysis (2009–2013). Int J Ophthalmol. 2016;9:1669–1675. [DOI] [PMC free article] [PubMed] [Google Scholar]
- 27.López-Muñoz F, Rubio G. La producción científica española en psiquiatría: estudio bibliométrico de las publicaciones de circulación internacional durante el periodo 1980–1993. An Psiquiatr. 1995;11:68–75. [Google Scholar]
- 28.López-Muñoz F, Marín F, Boya J. Evaluación bibliométrica de la producción científica española en neurociencia. Análisis de las publicaciones de difusión internacional durante el periodo 1984–1993. Rev Neurol. 1996;24:417–426. [PubMed] [Google Scholar]
- 29.López-Muñoz F, Boya J, Marín F, et al. Scientific research on the pineal gland and melatonin: a bibliometric study for the period 1966–1994. J Pineal Res. 1996;20:115–124. [DOI] [PubMed] [Google Scholar]
- 30.López-Muñoz F, Álamo C, Rubio G. et al. Bibliometric analysis of biomedical publications on SSRIs during the period 1980–2000. Depress Anxiety. 2003;18:95–103. [DOI] [PubMed] [Google Scholar]
- 31.García-García P, López-Muñoz F, Callejo J, et al. Evolution of Spanish scientific production in international obstetrics and gynecology journals during the period 1986–2002. Eur J Obstet Gynecol Reprod Biol 2005;123:150–156. [DOI] [PubMed] [Google Scholar]
- 32.López-Muñoz F, Vieta E, Rubio G, et al. Bipolar disorder as an emerging pathology in the scientific literature: a bibliometric approach. J Affect Disord. 2006;92:161–170. [DOI] [PubMed] [Google Scholar]
- 33.García-García P, López-Muñoz F, Rubio G, et al. Phytotherapy and psychiatry: Bibliometric study of the scientific literature from the last 20 years. Phytomedicine Int J Phytother Phytopharmacol. 2008;15:566–576. [DOI] [PubMed] [Google Scholar]
- 34.López-Muñoz F, Álamo C, Quintero-Gutiérrez FJ, et al. A bibliometric study of international scientific productivity in attention-deficit hyperactivity disorder covering the period 1980–2005. Eur Child Adolesc Psychiatry. 2008;17:381–391. [DOI] [PubMed] [Google Scholar]
- 35.López-Muñoz F, García-García P, Saiz-Ruiz J, et al. A bibliometric study of the use of the classification and diagnostic systems in psychiatry over the last 25 years. Psychopathology. 2008;41:214–225. [DOI] [PubMed] [Google Scholar]
- 36.López-Muñoz F, Shen WW, Pae CU, et al. Trends in scientific literature on atypical antipsychotics in South Korea: A bibliometric study. Psychiatr Invest. 2013;10:8–16. [DOI] [PMC free article] [PubMed] [Google Scholar]
- 37.López-Muñoz F, Shen WW, Shinfuku N, et al. A bibliometric study on second-generation antipsychotic drugs in the Asia-Pacific Region. J Exp Clin Med. 2014;6:111–117. [Google Scholar]
- 38.López-Muñoz F, Sanz-Fuentenebro FJ, Rubio G, et al. Quo vadis clozapine?. A bibliometric study of 45 years of research in international context. Int J Mol Sci. 2015;16:23012–23034. [DOI] [PMC free article] [PubMed] [Google Scholar]
- 39.Redondo M, León L, Povedano Montero F, et al. A Bibliometric Study of the scientific publications on patient-reported outcomes in Rheumatology. Sem Arthr Rheumat. 2016;46:828–833. [DOI] [PubMed] [Google Scholar]
- 40.Okoroiwu HU, López-Munoz F, Povedano-Montero FJ. Bibliometric analysis of global Lassa fever research (1970–2017): a 47 - year study. BMC Infect Dis. 2018;18(1):639. [DOI] [PMC free article] [PubMed] [Google Scholar]
- 41.López-Muñoz F, Tracy DK, Povedano-Montero FJ, et al. Trends in scientific literature on atypical antipsychotic drugs in United Kingdom: A bibliometric study. Ther Adv Psychopharmacol. 2019;9:1–12. doi: 10.1177/2045125318820207. [DOI] [PMC free article] [PubMed] [Google Scholar]
- 42.Povedano-Montero FJ, Weinreb RN, Raga-Martínez I, et al. Detection of neurological and ophthalmological pathologies with Optical Coherence Tomography using retinal thickness measurements: A bibliometric study. Appl Sci. 2020;10:5477. doi: 10.3390/app10165477. [DOI] [Google Scholar]
- 43.López-Muñoz F, Povedano-Montero FJ, Romero A, et al. The crossroads of melatonin: Bibliometric analysis and mapping of global scientific research. Melatonin Res. 2021;4:152–172. [Google Scholar]
- 44.Price DJ. Little science, big science. New York: Columbia University Press, 1963. [Google Scholar]
- 45.Egghe L, Ravichandra Rao IK. Classification of growth models based on growth rates and its applications. Scientometrics. 1992;25:5–46. [Google Scholar]
- 46.Bradford SC. Sources of informations on specific subjects. J Inf Sci. 1934;137:85–86. [Google Scholar]
- 47.Brembs B, Button K, Munafò M. Deep Impact: Unintended consequences of journal rank. Front Human Neurosci. 2013;7:291. [DOI] [PMC free article] [PubMed] [Google Scholar]
- 48.Garfield E Citation indexing. Its theory and application in science, technology and humanities. New York: John Wiley & Sons, 1979. [Google Scholar]
- 49.Lotka AJ. The frecuency distribution of scientific productivity. J Wash Acad Sci. 1926;12(16):317–323. [Google Scholar]
- 50.Ball P Index aims for fair ranking of scientists. Nature. 2005;436(7053):900. [DOI] [PubMed] [Google Scholar]
- 51.Kelly CD, Jennions MP. The h-index and career assessment by numbers. Trends Ecol Evol. 2006;41(4):167–170. [DOI] [PubMed] [Google Scholar]
- 52.Cronin B, Meho LI. Using the h-index to rank influential scientist. J Am Soc Inform Sci Tec. 2006;57:1275–1278. [Google Scholar]
- 53.Egghe L Theory and practise of the g-index. Scientometrics. 2006;69:131–152. [Google Scholar]
- 54.Povedano-Montero FJ. Análisis bibliométrico de la Producción Científica española en el campo de la Optometría, PhD Thesis. Madrid: Universidad Camilo José Cela, 2015. [Google Scholar]
- 55.Börner K, Chen C, Boyack KW. Visualizing knowledge domains. Annu Rev Inf Sci Technol. 2003;37:179–255. [Google Scholar]
- 56.van Eck NJ, Waltman L. Software survey: VOSviewer, a computer program for bibliometric mapping. Scientometrics. 2010;84:523–538. [DOI] [PMC free article] [PubMed] [Google Scholar]
- 57.Leydesdorff L, Welbers K. The semantic mapping of words and co-words in contexts. J Informetr. 2010;5:469–475. [Google Scholar]
- 58.Kessler MM. Bibliographic coupling between scientific papers. Am Doc. 1963;14:10–25. [Google Scholar]
- 59.Rodríguez J, Gómez N. Redes de coautoría como herramienta de evaluación de la producción científica de los grupos de investigación. Rev Gen Inf Doc. 2017;27:279–297. [Google Scholar]
- 60.Mandal K, Benson S, Fraser SG. The contribution to ophthalmic literature from different regions of the world. Int Ophthalmol. 2004;25:181–184. [DOI] [PubMed] [Google Scholar]
- 61.Ohba N [Bibliometric analysis of the current international ophthalmic publications]. Nippon Ganka Gakkai Zasshi. 2005;109:115–125. [PubMed] [Google Scholar]
- 62.Guerin MB, Flynn TH, Brady J, et al. Worldwide geographical distribution of ophthalmology publications. Int Ophthalmol. 2009;29:511–516. [DOI] [PubMed] [Google Scholar]
- 63.Subramanyam K Bibliometric Studies of Research Collaboration - A Review. J Inf Sci. 1983;6:33–38. [Google Scholar]
- 64.Thorsteinsdottir OH. External research collaboration in two small science systems. Scientometrics. 2000;49:145–160. [Google Scholar]
- 65.Lee S, Bozeman B. The impact of research collaboration on scientific productivity. Soc Stud Sci. 2005;35:673–702. [Google Scholar]
- 66.Bozeman B, Fay D, Slade CP. Research collaboration in universities and academic entrepreneurship: the-state-of-the-art. J Technol Transfer. 2013;38:1–67. [Google Scholar]
- 67.Katz JS, Martin BR. What is research collaboration? Res Policy. 1997;26:1–18. [Google Scholar]
- 68.Clark A, Ng JQ, Morlet N, et al. Big data and ophthalmic research. Surv Ophthalmol. 2016;61:443–465. [DOI] [PubMed] [Google Scholar]
- 69.Coleman AL, Morgenstern H. Use of insurance claims databases to evaluate the outcomes of ophthalmic surgery. Surv Ophthalmol. 1997;42:271–278. [DOI] [PubMed] [Google Scholar]
- 70.Gazni A, Didegah F. Investigating different types of research collaboration and citation impact: a case study of Harvard University’s publications. Scientometrics 2011;87:251–265. [Google Scholar]
- 71.White HD, McCain KW. Bibliometric. Ann Rev Inf Sci Technol. 1989;24:119–186. [Google Scholar]
- 72.Johnson MH, Cohen J, Grudzinskas G. The uses and abuses of bibliometrics. Rep BioMed Online. 2012;24:485–486. [DOI] [PubMed] [Google Scholar]
- 73.Egger M, Zellweger-Zähner T, Schneider M, et al. Language bias in randomised controlled trials published in English and German. Lancet. 1997;350:326–329. [DOI] [PubMed] [Google Scholar]
- 74.Dance A Authorship: Who’s on first? Nature. 2012;489:591–593. [DOI] [PubMed] [Google Scholar]
- 75.Chen H, Jhanji V. Survey of systematic reviews and meta-analyses published in ophthalmology. Br J Ophthalmol. 2012;96:896–899. [DOI] [PubMed] [Google Scholar]