Abstract
Although pre-transplant diabetes is a risk factor for mortality post-liver transplant, the underlying mechanism has not been fully defined. In a murine liver partial warm ischemia model, we addressed the question of how diabetes/hyperglycemia impacted tissue inflammatory injuries against ischemia reperfusion (IR), focusing on the Advanced Glycation End-product (AGE) and its receptor (RAGE) pathway. Our results showed that hepatocellular injury was exacerbated in Streptozotocin-induced diabetic mice against IR, in association with hyper-inflammatory immune activation in livers. Serum levels of AGEs, but not HMGB1, were increased in diabetic mice in response to liver IR. Both RAGE antagonist peptides and small interfering RNA alleviated liver injuries and inhibited inflammatory immune activation against IR in diabetic, but not normal, mice. Kupffer cells (KCs)/macrophages, but not hepatocytes, from diabetic mice expressed significantly higher levels of RAGE, leading to their hyper-inflammatory responsiveness to both TLR ligands and AGEs. In vitro, hyperglycemia increased macrophage RAGE expressions and enhanced their TLR responses. Our results demonstrated that the activation of the AGE-RAGE signaling pathway in KCs was responsible for hyper-inflammatory immune responses and exacerbated hepatocellular injuries in diabetic/hyperglycemic hosts against liver IR.
Keywords: Liver Ischemia Reperfusion Injury, Diabetes, Receptor for Advanced Glycation Endproduct, Kupffer Cells, Advanced Glycation Endproduct, Inflammation
Introduction
Metabolic diseases, such as obesity, diabetes and metabolic syndrome, have become global epidemics. According to the 2012 annual report of Organ Procurement and Transplantation Network/The Scientific Registry of Transplant Recipients (OPTN/SRTR) on liver, up to 25% of liver transplant patients had pre-existing diabetes mellitus (DM) (1). In particularly, patients with liver cirrhosis, which is the main causes of liver disease requiring liver transplant, majority (up to 80%) have insulin resistance (type II DM) and impaired glucose metabolism (2, 3). Although early studies showed no increase in mortality for diabetic over control recipients of orthotropic liver transplantation (OTL), more recent and better controlled retrospective surveys revealed that pre-transplant diabetes was indeed associated with a significant higher post-OTL morbidity and mortality (4-7). Type 1 diabetes was specifically found to be an independent predictors of poor outcome after liver transplantation (8). Recipient’s 5-year survival was lower in diabetic patients, associated with higher incidence of infection, and more frequent complications in cardiovascular, eye, neurological and renal systems. Interestingly, acute rejection rate was also higher, which was partly due to less immunosuppression in diabetic recipients. Despite these important clinical observations, limited experimental studies have been performed to address the impact of diabetes on transplantation rejection.
Both type I and type II diabetes are associated with hyperglycemia, which has been shown to trigger chronic inflammation, contributing to the pathogenesis of DM and its associated complications (9). As inflammatory immune response is also the basis of transplantation rejection, diabetes could potentially worsen transplant outcome by augmenting inflammation. What remains to be determined is the mechanism of how diabetes/hyperglycemia regulates inflammatory immune response. The advanced glycation end products (AGES) and its receptor (RAGE) have been shown to be accumulated and activated in tissues/cells of diabetic hosts, which may exert potent immune regulatory functions in disease pathogenesis, including ischemia reperfusion injury (IRI) (10-15).
Liver ischemia/reperfusion injury (IRI) is the major cause of liver dysfunction and failure after hepatic trauma, resection and liver transplantation (16, 17). Tissue inflammatory immune response triggered by innate immune receptor activation, such as TLR4, plays a key role in the disease pathogenesis (18, 19). Ischemia-induced tissue damage prompts the release of danger-associated molecular pattern (DAMP), such as HMGB1, which activates innate immune pattern recognition receptors (PRR), leading to the production of cytokines and chemokines (20). These soluble inflammatory molecules become the driving force of hepatocellular damages in reperfusion by either direct or indirect (via recruitment of inflammatory cells) cytotoxicity (21). In experimental models, inhibition of innate immune activation is one of the most effective approaches to alleviate organ IRI. In diabetic hosts, livers may become more susceptible to ischemia injuries due to diabetes-associated vascular complication. Additionally, the diabetes-associated hyper-inflammatory phenotype may promote liver immune response against IR to further increase hepatocellular damages. Acute hyperglycemia has been shown to increase liver IRI (22). However, mechanisms remain to be defined. Specifically, the question of whether the AGE/RAGE signaling is involved in hepatocellular injuries in diabetes has not been addressed.
In this study, we determined whether and how diabetes regulated liver IRI and inflammatory immune activation in a Streptozotocin-induced type I diabetes mouse model, focusing on the molecular mechanism that differentiated diabetic vs. normal hosts in their response to IR.
Materials and Methods
Animals.
Male wide-type (WT) C57BL/6 mice (6-8 weeks old) were purchased from the Jackson Laboratory (Bar Harbor, ME). Animals were housed in the UCLA animal facility under specific pathogen-free conditions, and received humane care according to the criteria outlined in the “Guide for the Care and Use of Laboratory Animals” prepared by the National Academy of Sciences and published by the National Institute of Health.
Mouse diabetes and liver IRI model.
Streptozotocin (STZ) or vehicle control (sodium citrate buffer) was injected intraperitoneally (i.p.) into separate groups of 6 weeks old mice at 40mg/kg for 5 consecutive days. At day 14, (9 days after the last shot), blood glucose levels from the tail vein were tested. Mice with blood glucose ≥300mg/dl were considered hyperglycemia. These diabetic mice along with non-diabetic controls were used in our experiments.
As described previously (23), an atraumatic clip was used to interrupt the arterial and portal venous blood supply to the cephalad liver lobes for 90 minutes. Sham controls underwent the same procedure, but without vascular occlusion. RAGE antagonist peptides were administered 30min prior to the ischemia at 100μg/mouse, i.p.(EMD Millipore, Billerica, MA); Insulin (10μg/kg) was injected, i.p., twice at 24h and 1h prior to the start of liver ischemia. Mice were sacrificed after 0, 6 and 24h after reperfusion, and liver and serum samples were collected.
Serum alanine aminotransferase (sALT) levels were measured with an auto analyzer by ANTECH Diagnostics (Los Angeles, CA). Part of liver specimens were fixed in 10% buffered formalin and embedded in paraffin. Liver sections (4 m) were stained with hematoxylin and eosin (HE). The severity of liver IRI was graded blindly using Suzuki’s criteria on a scale from 0 to 4. No necrosis, congestion/ centrilobular ballooning is given a score of 0, while severe congestion and >60% lobular necrosis is given a score of 4.
MPO assay.
Frozen liver tissues were thawed and placed in iced 0.5% hexadecyltrimethyl-ammonium bromide and 50 mM potassium phosphate buffer solution (pH = 5.0). Each sample was homogenized and centrifuged at 15,000 rpm for 15 min at 4°C. Supernatants were mixed with hydrogen peroxide-sodium acetate and tetramethyl-benzidine solutions. The change in absorbance was measured by spectrophotometry at 655 nm. One unit of MPO activity was defined as the quantity of enzyme degrading 1μmol peroxide/min. at 25°C/g of tissue.
Cell cultures.
Peritoneal macrophages were induced by injection of 1mL 2% Bio-Gel P-100 gel (BioRad, Hercules, CA) into the peritoneal cavity of control or diabetic mice. Cells were collected by peritoneal lavage with PBS 4 days later.
Kupffer cells (KCs) were isolated as previously described (24). In brief, livers were perfused in situ via the portal vein with calcium- and magnesium-free HBSS supplemented with 2% heat-inactivated FBS, followed by 0.27% collagenase IV (Sigma, St Louis, MO). Perfused livers were dissected, and teased through 70 μm nylon mesh cell strainers (BD Biosciences, San Diego, CA). Non-parenchymal cells (NPCs) were separated from hepatocytes by centrifuging at 50g for 2 min three times. NPCs were suspended in HBSS and layered onto a 50%/25% Percoll gradient (Sigma) in a 50-ml conical centrifuge tube. After centrifugation at 1800g at 4°C for 15 min. KCs in the middle layer were collected and plated in cell culture dishes in DMEM with 10% FBS, 10 mM HEPES, 2 mM GlutaMax, 100 U/ml penicillin, and 100 mg/ml streptomycin for 15 min at 37°C. Nonadherent cells were removed by replacing the culture medium.
Bone marrow cells were isolated and cultured in low (5mM) or high (30mM) glucose DMEM with 10% FBS, 10% L929 condition medium, 100 U/ml penicillin, and 100 mg/ml streptomycin for 6 days. At day 7, differentiated BMMs were reseeded with the same high/low glucose condition and used for experiments.
Macrophages were stimulated with LPS (1μg/ml, Invivogen, San Diego, CA) or 2mM Nμ-(1-Carboxymethyl)-L-lysine (NECML, Santa Cruz Biotechnology, Inc., Dallas, TX) or AGE-BSA (10-100μg/ml, R&D System, Minneapolis, MN) for 0-24h, and supernatants were harvested for cytokine analysis. To block RAGE activation, cells were treated with RAP (10μM/L) for 2hrs. prior to LPS stimulation.
RAGE knockdown.
In vitro, 1x10⁶ cells/well peritoneal macrophages were transfected with a pool of mouse RAGE-specific siRNAs (Santa Cruz Biotechnology, Inc., Dallas, TX), or nonspecific siRNA (5’-CGAATCCACAAAGCGCGCTT-3’) using lipofectamine 2000 reagent (Invitrogen, San Diego, CA) according to the manufacturer’s protocol. Cells were stimulated with LPS 24h later. In vivo, siRNAs were mixed with mannose-conjugated polymers (Polyplus transfectionTM, France) at a ratio specified by the manufacturer, and administered by tail vein injection (at 2mg siRNA/kg), 4h prior to the onset of liver ischemia.
Quantitative RT-PCR.
Total RNA (2.0μg) was reverse-transcribed into cDNA using SuperScriptTM III First-Strand Synthesis System (Invitrogen, Carlsbad, CA). Quantitative-PCR was performed using the DNA Engine with Chromo 4 Detector (MJ Research, Waltham, MA). In a final reaction volume of 20 μl, the following were added: 1xSuperMix (Platinum SYBR Green qPCR Kit, Invitrogen, Carlsbad, CA), cDNA and 0.5 mM of each primer. Amplification conditions were: 50oC (2 min), 95oC (5 min) followed by 50 cycles of 95 oC (15 s), 60 oC (30 s). The primers for RAGE: 5’- GCT CGA ATC CTC CCC AAT G-3’ (forward), 5’- TCC CCT CAT CGA CAA TTC CA-3’ (reverse). Other primers used to amplify a specific mouse gene fragments were the same as described previously (25).
Western blots.
Antibodies against RAGE, TLR4 (Novus Biologicals, LLC, Littleton, CO), and NOD1 (Cell Signaling Technology, San Diego, CA) were used for Western blot analysis. Tissue or cellular proteins were extracted with ice cold lysis buffer (1% Triton X-100, 0.5% sodium deoxycholate, 0.1% SDS, 10% glycerol, 137mM sodium chloride, 20mM Tris, pH 7.4). Proteins (20 μg) were subjected to 12% SDS-PAGE electrophoresis and transferred to PVDF nitrocellulose membrane. Membranes were first probed with primary antibody in 10 ml blocking buffer with gentle agitation overnight at 4°C. After washing, membranes were further probed with appropriate HRP-conjugated secondary antibody (Cell Signaling Technology, San Diego, CA) in 10 ml of blocking buffer for 1 h at room temperature. SuperSignal® West Pico Chemiluminescent Substrates (Thermo Fisher Scientific, Rockford, IL) were used for chemo-luminescence development.
ELISA.
Cytokines (TNF-α, IL-6, and IL-10) in cell culture supernatants or serum were measured by ELISA (eBiosciences, San Diego, CA). AGEs and HMGB1 were quantitated using ELISA kits from MyBioSource Inc. (San Diego, CA), and IBL International Corp. (Toronto, ON, CA), respectively, according to manufacturers’ protocols. Data were acquired with a Multiscan FC plate reader and analyzed with SkanIt for Multiscan FC software (Thermo Scientific).
Statistical analysis.
Results were shown as mean±SD. Statistical analyses were performed using unpaired Student’s t test with p<0.05 (two tailed) considered as significant.
Results
Diabetes exacerbated liver IRI.
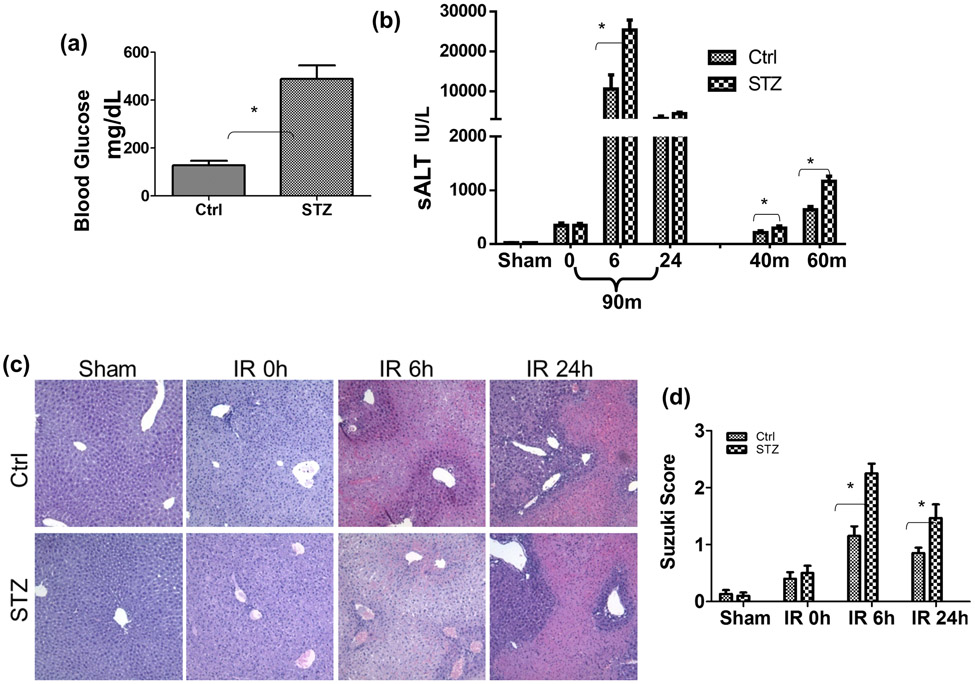
To determine whether diabetes/hyperglycemia impacted the development of liver IRI, we induced type I diabetes in B6 mice with multiple injections of low dose STZ. Hyperglycemia was confirmed in these treated mice at day 14 post STZ injection (Fig.1a). Compared between controls, diabetic mice developed much more severe liver IRI after 90m ischemia and 6h or 24h of reperfusion (Fig.1b, c, d), as demonstrated by significantly increased levels of serum ALT, and worse damaged liver architectures with higher Suzuki scores. The negative impact on liver IRI by diabetes was evident regardless of ischemia time, as sALT levels were also increased after 40m or 60m ischemia and 6h of reperfusion in diabetic mice, as compared with those in controls. Thus, diabetes/hyperglycemia increased liver susceptibilities against IRI.
Figure 1.
Liver IRI in streptozotocin-induced type I diabetic mice. Diabetic (STZ) and control mice were prepared as described in the Materials and Methods. (a) Blood glucose levels were measured at 14 days post 1st STZ injection prior to the start of liver ischemia experiments. (b) Serum ALT levels in control and diabetic mice after either sham, or 90m liver ischemia and 0, 6, 24h reperfusion; or after 40 or 60m of ischemia and 6h of reperfusion. (c) Representative liver histological (H/E staining) pictures and (d) Average Suzuki scores of the same 90m liver ischemia groups of mice as in (b). Liver partial warm IR was performed as described in the Materials and Methods. Representative results of 3 independent experiments; n=3-4 mice/group, *p<0.05.
Diabetes induced liver hyper-inflammatory immune activation against IR.
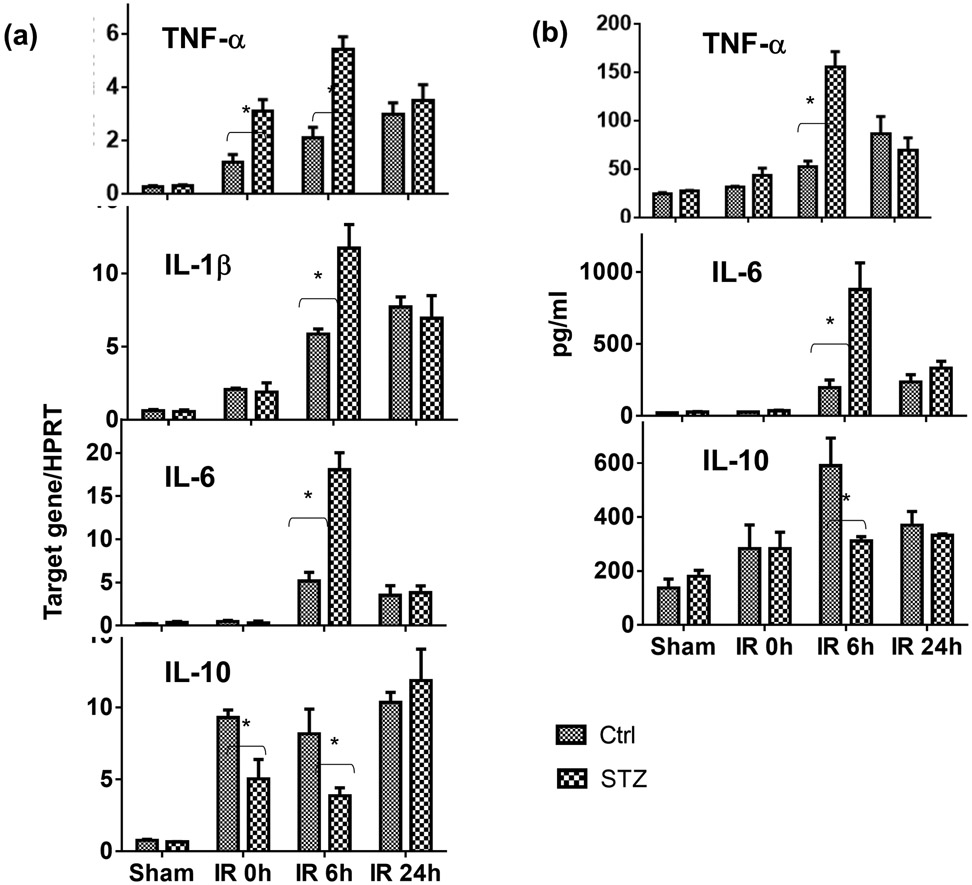
To determine whether diabetes/hyperglycemia regulated liver innate immune response against IR, we compared liver inflammatory gene expressions by qRT-PCR and serum cytokine levels by ELISA between diabetic mice and controls after 90m ischemia and 6 or 24h of reperfusion. Significantly higher levels of pro-inflammatory TNF-α, IL-1β and IL-6, but lower levels of anti-inflammatory IL-10, gene expressions (Fig.2a) were induced in ischemic livers of diabetic mice at 0h and/or 6h of reperfusion, as compared with those of controls. In parallel, serum TNF-α and IL-6 levels were also higher and IL-10 level lower in the same diabetic mice after liver IR (Fig.2b). Of note, inflammatory gene expression levels were all declined at 24h post reperfusion to similar levels in both diabetic and non-diabetic mice, suggesting that it was the activation, rather than the resolution, of tissue inflammation was affected by diabetes. Therefore, diabetes promoted liver pro-inflammatory immune activation against IR.
Figure 2.
Liver immune activation against IR in diabetic mice. Diabetic (STZ) and control mice were prepared and liver partial warm IR was performed as described in the Materials and Methods. IR liver tissues and serum samples were collected from control and diabetic mice after either sham operation, or 90m liver ischemia and 0, 6, 24h reperfusion. (a) Liver inflammatory gene expressions were measured by qRT-PCR, and (b) Serum cytokine levels by ELISA. Average target gene/HPRT ratios and cytokine levels of each experimental groups were plotted. Representative results of 2 independent experiments; n=3 mice/group, *p<0.05.
Diabetes activated the AGE-RAGE pathway in liver IRI.
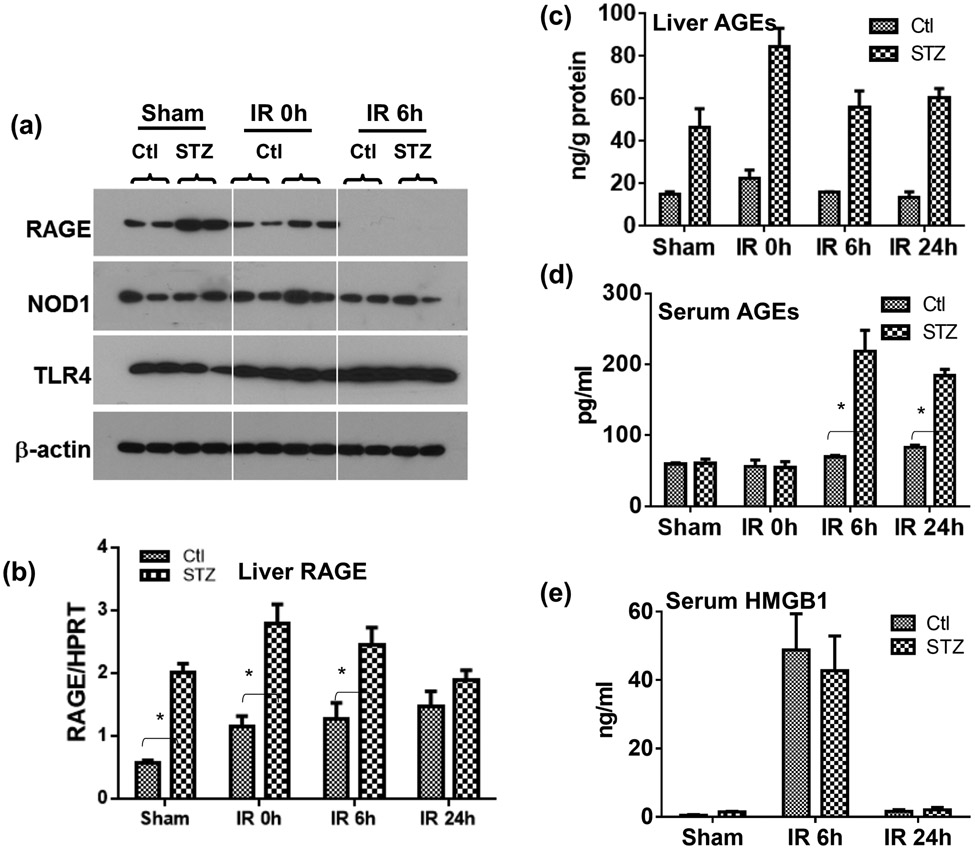
To explore molecular mechanisms of liver hyper-inflammatory immune activation against IR in diabetic mice, we determined the role of the AGE-RAGE pathway. Results from Western blot, as well as qRT-PCR, analysis showed that diabetic mice had elevated levels of RAGE, but not TLR4 or NOD1, expressions in livers, as compared with controls (Fig.3a, b). Interestingly, IR triggered a down-regulation of liver RAGE protein in both diabetic and control mice. RAGE gene expressions, however, were not affected significantly by IR in livers. Furthermore, higher levels of AGEs were detected in liver tissue of diabetic mice, and liver IR triggered the release of AGEs into sera of diabetic but not control mice (Fig.3c, d). HMGB1 was also released into sera by liver IR. However, levels were similar between diabetic and control mice (Fig.3e).
Figure 3.
The activation of the AGE-RAGE pathway by IR in diabetic mice. Diabetic (STZ) and control mice were prepared and liver partial warm IR was performed as described in the Materials and Methods. IR liver tissues and serum samples were collected from control and diabetic mice after either sham operation, or 90m liver ischemia and 0, 6, 24h reperfusion. (a) RAGE, NOD1 and TLR4 protein expressions in IR liver tissues were measured by Western blot analysis (2 samples/group). (b) RAGE gene expressions in IR liver tissues were determined by qRT-PCR (ratios of target gene/HPRT). AGE levels in liver tissues (c) and sera (d) were measured by ELISA. (e) HMGB1 levels in sera in sham or liver IR mice were measured by ELISA. Representative results of 2 separate experiments; n=3 mice/group, *p<0.05.
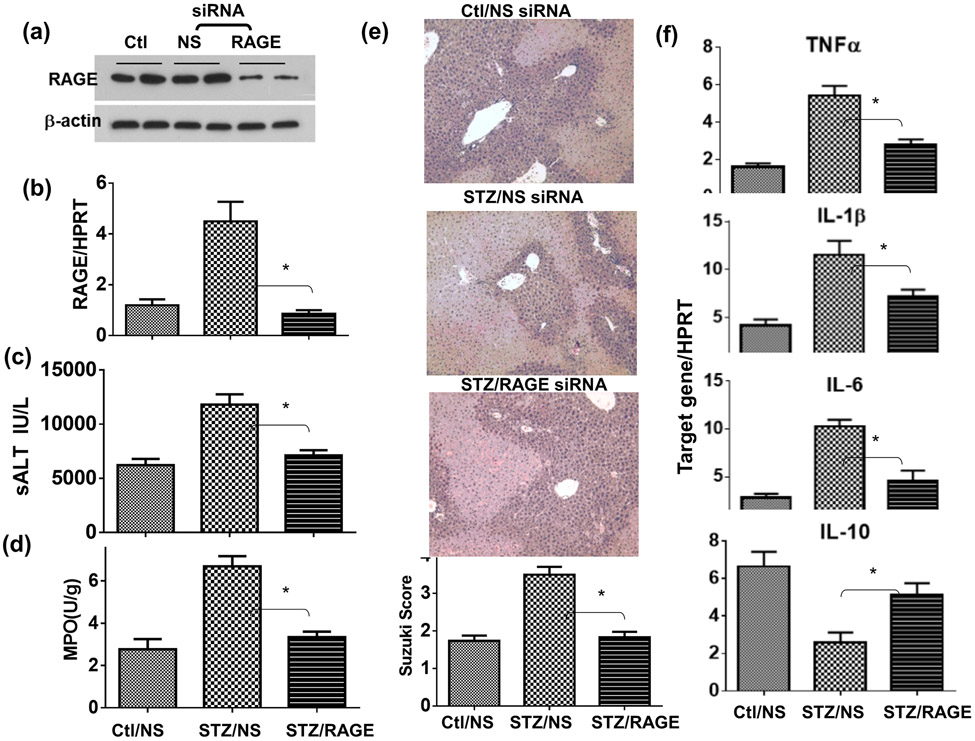
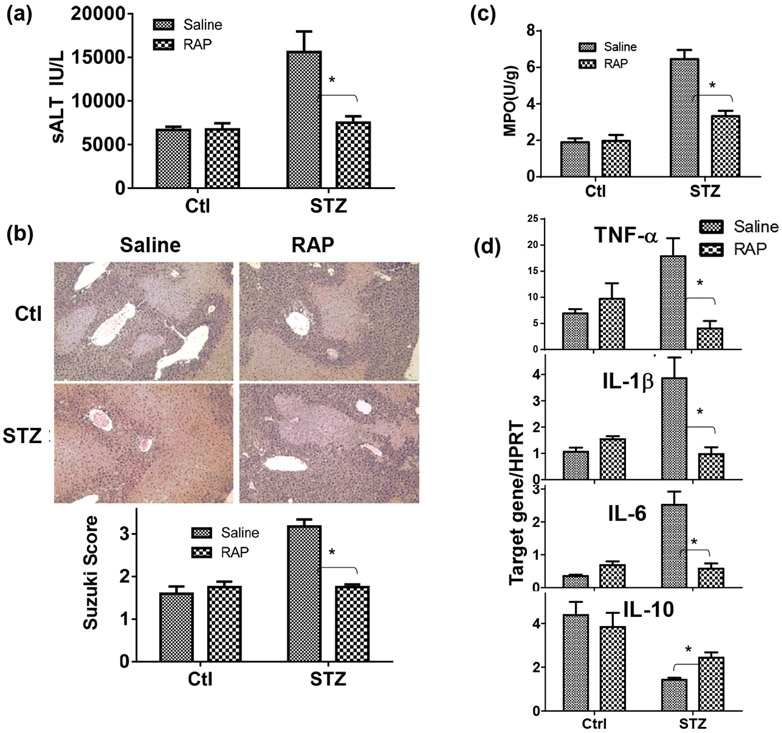
To test the functional role of the AGE-RAGE pathway in the pathogenesis of liver IRI, we administered a single dose of RAGE antagonistic peptides (RAP) (26) prior to the start of liver ischemia. Indeed, RAP alleviated liver IRI and inhibited liver pro-inflammatory immune activation only in diabetic, but not control, mice (Fig.5), as measured by sALT, liver histology ( with Suzuki scores), MPO activities and liver inflammatory gene expressions at 6h post reperfusion (Fig.4a, b, c, d). The specific role of RAGE in liver IRI in diabetic mice was confirmed by in vivo knock-down of RAGE by its siRNA. The efficacy of RAGE knock-down by the siRNA was confirmed in vitro in macrophages (by Western blots Fig.5a). Administration of RAGE siRNA carried by phagocyte-targeting mannose-conjugated polymers (27) in diabetic mice prior to the start of liver ischemia resulted in significant inhibition of RAGE expressions in livers (qRT-PCR) (Fig.5b), leading to the protection of livers from IRI (sALT and histology with Suzuki scores) and inhibition of neutrophil activation (MPO activities) (Fig.5c, d, e). Liver pro-inflammatory gene inductions were also inhibited by RAGE siRNA (Fig.5f). These results indicate that RAGE played critical roles in diabetic mice in their hyper-inflammatory immune activation and exacerbation of hepatocellular injuries against liver IR.
Figure 5.
Alleviation of liver IRI in diabetic mice by RAGE siRNA. Diabetic (STZ) mice were prepared as described in the Materials and Methods. Non-specific (NS) or RAGE-specific siRNA were first transfected in macrophages in vitro and RAGE protein expressions were determined by Western blot (a). In vivo, NS or RAGE-specific siRNA was administered in separate groups of diabetic mice prior to the start of liver ischemia. Liver RAGE gene expressions were determined by qRT-PCR (b). Liver IRI was measured at 6h post reperfusion by sALT (c), liver tissue MPO activities (d), liver histology with Suzuki scores (e), and liver inflammatory gene inductions (f). Representative results of 2 separate experiments; n=3 mice/group, *p<0.05.
Figure 4.
Alleviation of liver IRI by RAGE antagonist peptides (RAP) in diabetic mice. Diabetic (STZ) and control mice were prepared as described in the Materials and Methods. RAGE antagonistic peptides were administered in groups of diabetic and control mice prior to the start of liver ischemia. Liver IRI was measured at 6h by (a) sALT, (b) liver histology with Suzuki scores, (c) liver tissue MPO activities, and (d) liver inflammatory gene inductions (Target gene/HPRT ratios). Representative results of 2 separate experiments; n=3 mice/group, *p<0.05.
Diabetes enhanced Kupffer cell/macrophage pro-inflammatory immune responsiveness.
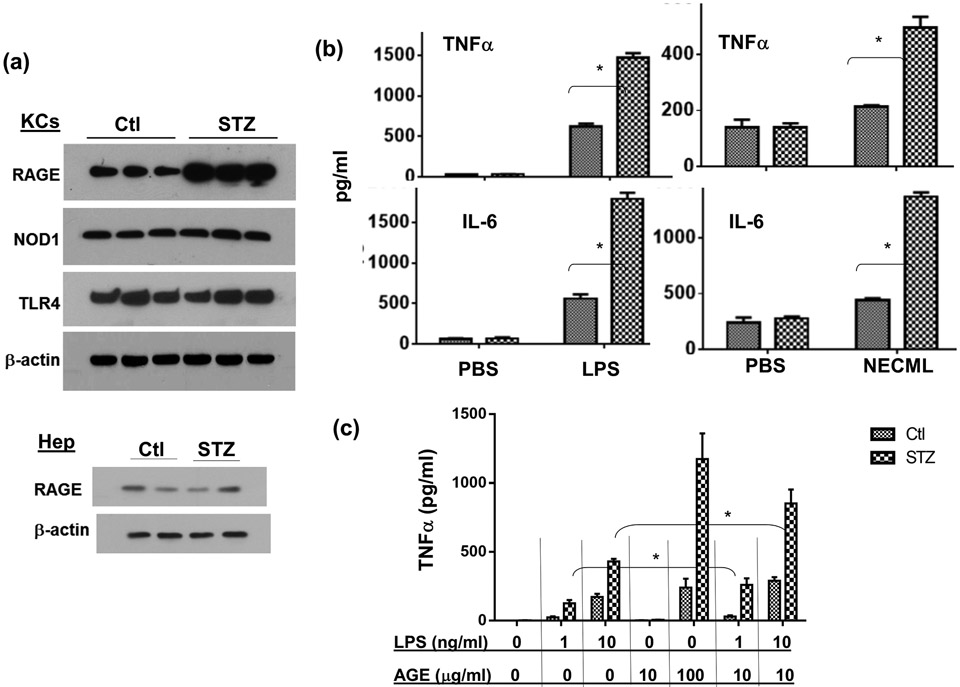
To determine the cellular mechanism of diabetes-induced liver hyper-inflammatory immune activation, we isolated KCs and hepatocytes from diabetic and control mice. Western blot results showed that diabetic KCs expressed higher levels of RAGE, but comparable levels of TLR4 or NOD1, as compared with those from control mice (Fig.6a). Hepatocytes expressed much lower levels of RAGE relative to those in KCs, and diabetes did not increase their expression (Fig.6a). Stimulation of KCs from diabetic mice with LPS resulted in significantly higher levels of TNF-α and IL-6 productions than those from controls (Fig.6b). In addition, these diabetic KCs reacted to NECML (Fig.6b, left panel), a major form of modification of glycated proteins, and AGE-BSA (Fig.6c) to produce significant amounts of inflammatory cytokines (TNF-α and IL-6), while normal KCs failed to respond to these AGE stimulations. As AGEs might be involved in liver immune activation in concert with TLR ligands in diabetic hosts, we tested their potential synergy in activating macrophages. Indeed, KCs from diabetic but not control mice, could be activated synergistically by low doses of AGEs and LPS (Fig.6c). Thus, although 10μg/ml AGE-BSA did not activate KCs by itself, it significantly enhanced TNF-α induction by low dose (1 or 10ng/ml) LPS.
Figure 6.
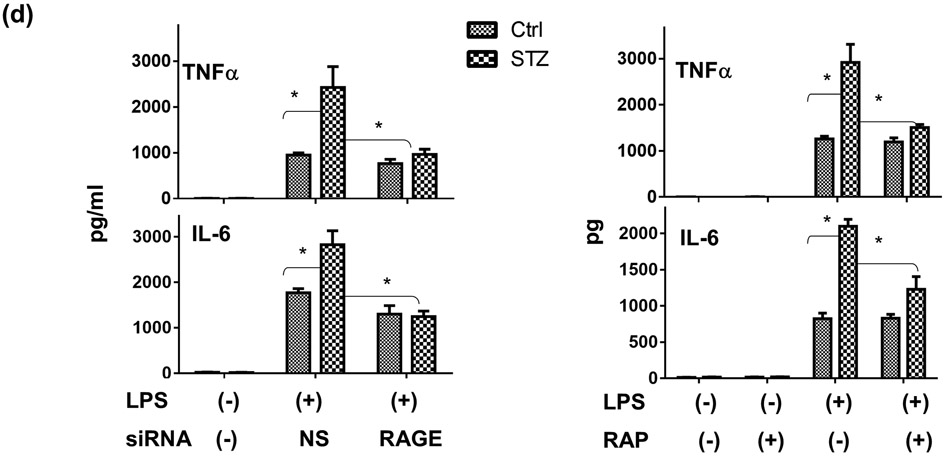
RAGE expressions and functions in KCs/macrophages. KCs were isolated from control and diabetic (STZ) mice. RAGE, NOD1 and TLR4 protein expressions were measured by Western blots (a). KCs isolated from Ctl. or STZ mice were stimulated in vitro with either LPS or NECML, as described in the Materials and Methods. Cytokines in culture supernatants were measured by ELISA 24h after stimulation (b). Peritoneal macrophages were isolated from control or diabetic mice and stimulated in vitro with low doses of LPS (1 or 10ng/ml), or AGE-BSA (10-100μg/ml), or both. TNF-α productions in culture supernatants were measured by ELISA at 24h (c). Peritoneal macrophages were transfected with either non-specific (NS) or RAGE siRNA, or treated with RAP, as described in the Materials and Methods, followed by the stimulation of LPS. TNF-α and IL-6 productions in culture supernatants were measured by ELISA at 24h (d) Representative results of 2 separate experiments; n=3/group, *p<0.05.
To test whether RAGE mediated the hyper-inflammatory immune response in diabetic macrophage, we utilized RAP or RAGE siRNA to treat cells prior to their stimulation by LPS. Both RAGE-targeted agents inhibited pro-inflammatory cytokine productions (TNF-α and IL-6) from diabetic, but not normal, macrophages (Fig.6d). These results indicated that KCs/macrophages from diabetic mice were hyper-responsive against TLR/AGE stimulation, due to their increased expression of RAGE.
Hyperglycemia induced RAGE expression and hyper-inflammatory immune activation in macrophages.
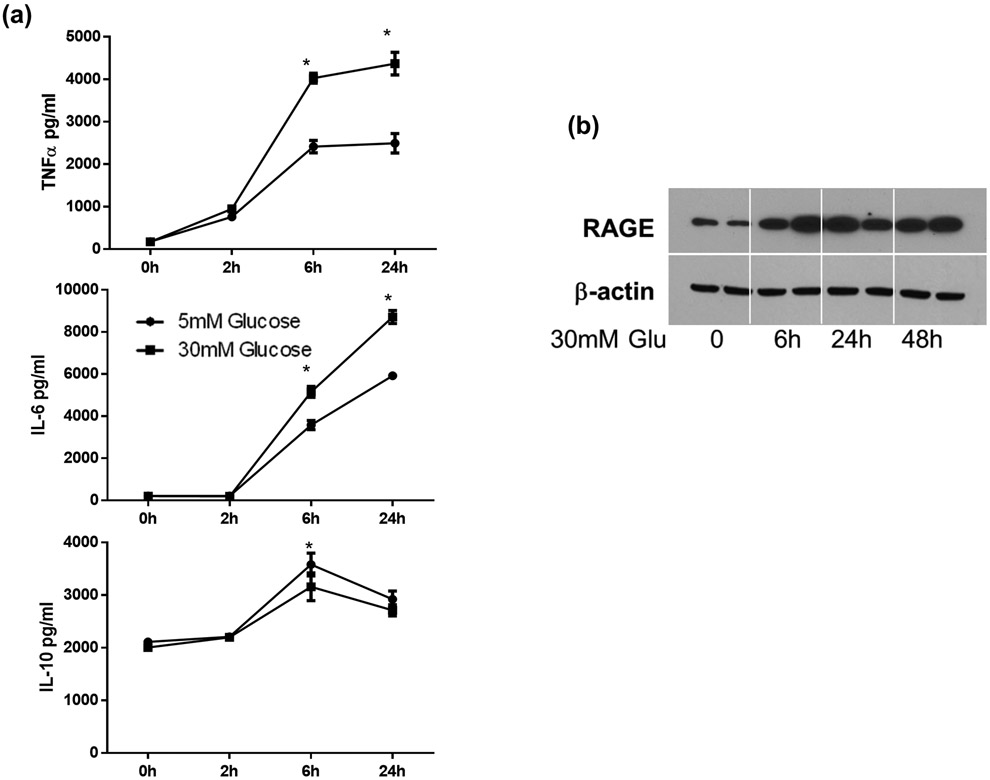
To further elaborate mechanisms of how diabetes altered KC immune responsiveness, we tested the impact of hyperglycemia on macrophages in vitro. Bone marrow derived macrophages were differentiated in low (5mM) or high (30mM) glucose conditions for 7 days and stimulated with LPS for 24h. Cytokine production kinetics were measured by ELISA. As shown in Fig.7a, BMMs differentiated under the high glucose condition produced significantly higher levels of pro-inflammatory TNF-α and IL-6 (at both 6h and 24h), but lower level of IL-10 (at 6h), as compared with BMMs under the low glucose condition. BMMs from high glucose condition expressed higher levels of RAGE than those from low glucose condition (data not shown). To determine whether hyperglycemia by itself was able to upregulate RAGE in primary macrophages, we cultured peritoneal macrophages at low glucose condition overnight and measured RAGE induction kinetics after changing to high glucose media. RAGE expression levels increased significantly after 6h (Fig.7b). These results suggested that hyperglycemia activated the AGE-RAGE pathway, leading to the development of hyper-inflammatory phenotype in diabetic hosts.
Figure 7.
The impact of hyperglycemia on macrophages in vitro. BMMs were differentiated under low or high glucose conditions, as described in the Materials and Methods. These cells were stimulated with LPS (100ng) for 24h and cytokine levels in culture supernatants were measured by ELISA (a). Peritoneal macrophages were cultured overnight in low glucose condition. RAGE induction by hyperglycemia (by changing to high glucose media) was determined by Western blot (b).
Discussion
Our study documented that diabetes/hyperglycemia aggravated liver IRI due to the hyper-inflammatory immune activation in KCs, mediated by the AGE-RAGE pathway. We provided several lines of evidence both in vivo and in vitro to demonstrate that this particular pathway played a key role in the response of KCs against IR that differentiated diabetic from normal hosts. Thus, KCs expressed higher levels of RAGE, livers contained higher levels of AGEs, and IR triggered AGE release into the serum, in diabetic mice. In vivo inhibition of AGE- RAGE signaling ameliorated liver IRI and reduced inflammatory immune activation in diabetic, but not normal, mice. At the cellular level, macrophages from diabetic hosts responded more vigorously to AGEs which enabled them to be activated synergistically by low doses of AGEs and TLR ligands. Although the STZ-induced diabetic model is very different from clinical diabetic patients, the fact that hyperglycemia, as a common feature of diabetes, by itself was sufficient to upregulate RAGE expression in macrophages and alter their innate immune responsiveness makes our results clinically relevant.
Diabetes and its associated hyperglycemia have been implicated in ischemia tissue injuries of hearts (14), lungs (13), kidneys (12), and nerves (15). RAGE deficiency was shown to be protective in some of these models. These studies, however, generally focused on chronic injuries and tissue inflammation, not the initial tissue immune activation per se, using genetic modulated animals (RAGE KO or Tg) with prolonged RAGE-targeted treatments. In livers, acute hyperglycemia was shown to enhance IRI in a rat model without mechanistic exploration (22). Our experiments addressed the question of how chronic hyperglycemia in a type I diabetes model impacted acute liver IRI, focusing on distinctive cellular and molecular mechanisms that differentiate diabetic hosts from normal. Since our RAGE targeted interventions were performed right at the time of liver ischemia, its function in IR-induced immune activation was clearly differentiated from its roles in diabetes development.
Although our finding of the RAGE involvement in diabetic liver IRI is somewhat expected, its selective role in KCs, rather than hepatocytes, is interesting. Additionally, we found that it plays a relatively minimal role in non-diabetic mice, which is different from results of previous reports (28, 29) in a mouse total liver ischemia model using soluble RAGE as therapeutic strategy. Although blockade of RAGE with its soluble recombinant protein for 7 days improved survival, the treatment enhanced liver NF-kB activation and only transiently inhibited TNF-α induction (29). It seems that RAGE regulation of hepatocyte death/proliferation was a more prominent feature in models involving liver resection and regeneration. Our current model is an acute liver inflammatory injury model (within 6h post reperfusion), mediated mainly by KC activation and hepatocyte death, rather than proliferation. Therefore, RAGE may exert distinctive functions in cell-type specific manner that it regulates hepatocyte proliferation in recovering phase of IR in normal mice, and liver immune activation only in diabetic mice. Alternatively, the therapeutic effect of soluble RAGE in non-diabetic normal mice might be mediated by its ability to bind to HMGB1, which interfered with TLR4 rather than RAGE activation.
Although at lower levels, KCs from normal mice did expressed RAGE. Reasons that they failed to respond to AGEs stimulation in vitro may include low affinities of these synthesized ligands and sensitivity limits of our assays. In vivo, AGEs were detected in sera of diabetic, but not normal mice during liver IR. HMGB1, however, was present in sera of both types of mice at similar levels. As HMGB1 could bind to RAGE (11, 30), this raised the question why RAGE was not triggered by HMGB1 in normal mice. One possible reason could be that TLR4 expressions by KCs/macrophages were sufficiently high enough to bind all HMGB1. When AGEs were released into circulation in diabetic mice during IR, they could only trigger RAGE, but not TLRs, which explained their unique roles in diabetic, but not normal, mice. One unexpected observation in our experiments was the rapid resolution of liver hype-inflammatory immune response against IR in diabetic mice, which declined to the same level as in normal mice at 24h post reperfusion. As chronic hyperglycemia had been shown to promote myelopoiesis, increased numbers of neutrophils and monocytes were found in diabetic mice (31), which could result in an increase of their entry into inflammatory sites, leading to prolonged immune response and delayed lesion regression. In addition, tissue macrophages isolated from diabetic mice showed defective polarization into anti-inflammatory/tissue repairing M2 phenotypes (15, 32), which would also lead to the persistence of tissue inflammation. Why it was not the case in our model? One potential reason could be that liver RAGE expression was quickly diminished later during reperfusion (Fig.3, at 6h) in both diabetic and normal mice. Therefore, RAGE activation was transient and might not be involved in the maintenance of liver inflammatory immune response against IR. Furthermore, It has been documented that cell surface RAGE could be cleaved by metalloproteinases (33, 34). Soluble RAGE was able to inhibit both TLR and RAGE activation. We have shown in vitro that macrophage activation by LPS resulted in diminished RAGE expression (data not shown). It will be interesting to determine whether RAGE cleavage in livers during IR actually plays a role in the resolution of inflammatory immune response.
We took advantage of the newly developed RAGE antagonist peptide (26), as well as cell-selective RAGE knock down by its siRNA, to test functional roles of RAGE in liver IRI in diabetic animals. The effectiveness of these clinical applicable approaches in protecting livers from IRI provides us not only evidence of RAGE functions, but also proof of principle of RAGE-targeted therapies in the treatment of tissue inflammatory diseases in diabetic patients. With the global prevalence of metabolic disorders, there is an urgent need to study novel pathological mechanisms and identify appropriate therapeutic strategies for inflammatory diseases in those metabolically altered patients. Our establishment of liver IRI model in diabetic mice is our first step toward this goal. Mechanistically, the potential simultaneous activation of TLR and RAGE in diabetic mice by IR provides us a system to study the interaction of these two innate immune receptors, which share ligands and intracellular signaling pathways (10, 30). Issues, such as ligand selectivity and synergy, are all of high interest for us to further understand innate immune activation mechanisms and inflammatory disease pathogenesis.
In summary, we have demonstrated that diabetes-associated hyperglycemia has a significantly negative impact on liver IRI by the activation of the AGE-RAGE pathway in KCs. RAGE-targeted therapies are effective in ameliorate liver IRI in diabetic hosts.
Acknowledgments
NIH Grants RO1 DK083408 (YZ), The Dumont Research Foundation, and grants from National Nature Science Foundation of China 81100270, 1310108001, 81210108017 (LL)
Abbreviations:
- STZ
streptozotocin
- IR
ischemia reperfusion
- IRI
IR injury
- RAGE
receptor for advanced glycation end products
- AGEs
advanced glycation end products
- KCs
Kupffer Cells
- LPS
lipopolysaccharide
- RAP
RAGE antagonist peptide
- sALT
serum alanine aminotransferase
- H/E
hematoxylin and eosin
- RT-PCR
reverse transcription polymerase chain reaction
Footnotes
Disclosure: The authors of this manuscript have no conflicts of interest to disclose as described by the American Journal of Transplantation.
References
- 1.Kim WR, Smith JM, Skeans MA, Schladt DP, Schnitzler MA, Edwards EB et al. OPTN/SRTR 2012 Annual Data Report: liver. Am J Transplant 2014;14 Suppl 1:69–96. [DOI] [PubMed] [Google Scholar]
- 2.Petrides AS, Vogt C, Schulze-Berge D, Matthews D, Strohmeyer G. Pathogenesis of glucose intolerance and diabetes mellitus in cirrhosis. Hepatology 1994;19(3):616–627. [DOI] [PubMed] [Google Scholar]
- 3.Zein NN, Abdulkarim AS, Wiesner RH, Egan KS, Persing DH. Prevalence of diabetes mellitus in patients with end-stage liver cirrhosis due to hepatitis C, alcohol, or cholestatic disease. J Hepatol 2000;32(2):209–217. [DOI] [PubMed] [Google Scholar]
- 4.John PR, Thuluvath PJ. Outcome of liver transplantation in patients with diabetes mellitus: a case-control study. Hepatology 2001;34(5):889–895. [DOI] [PubMed] [Google Scholar]
- 5.Shields PL, Tang H, Neuberger JM, Gunson BK, McMaster P, Pirenne J. Poor outcome in patients with diabetes mellitus undergoing liver transplantation. Transplantation 1999;68(4):530–535. [DOI] [PubMed] [Google Scholar]
- 6.Samuelson AL, Lee M, Kamal A, Keeffe EB, Ahmed A. Diabetes Mellitus Increases the Risk of Mortality Following Liver Transplantation Independent of MELD Score. Digestive Diseases and Sciences 2010;55(7):2089–2094. [DOI] [PubMed] [Google Scholar]
- 7.Dare AJ, Plank LD, Phillips AR, Gane EJ, Harrison B, Orr D et al. Additive effect of pretransplant obesity, diabetes, and cardiovascular risk factors on outcomes after liver transplantation. Liver Transpl 2014;20(3):281–290. [DOI] [PubMed] [Google Scholar]
- 8.Yoo HY, Thuluvath PJ. The effect of insulin-dependent diabetes mellitus on outcome of liver transplantation. Transplantation 2002;74(7):1007–1012. [DOI] [PubMed] [Google Scholar]
- 9.Lontchi-Yimagou E, Sobngwi E, Matsha TE, Kengne AP. Diabetes mellitus and inflammation. Curr Diab Rep 2013;13(3):435–444. [DOI] [PubMed] [Google Scholar]
- 10.Ott C, Jacobs K, Haucke E, Navarrete Santos A, Grune T, Simm A. Role of advanced glycation end products in cellular signaling. Redox Biol 2014;2:411–429. [DOI] [PMC free article] [PubMed] [Google Scholar]
- 11.Xie J, Mendez JD, Mendez-Valenzuela V, Aguilar-Hernandez MM. Cellular signalling of the receptor for advanced glycation end products (RAGE). Cell Signal 2013;25(11):2185–2197. [DOI] [PubMed] [Google Scholar]
- 12.Zong H, Ward M, Madden A, Yong PH, Limb GA, Curtis TM et al. Hyperglycaemia-induced pro-inflammatory responses by retinal Müller glia are regulated by the receptor for advanced glycation end-products (RAGE). Diabetologia 2010;53(12):2656–2666. [DOI] [PubMed] [Google Scholar]
- 13.Lapar DJ, Hajzus VA, Zhao Y, Lau CL, French BA, Kron IL et al. Acute hyperglycemic exacerbation of lung ischemia-reperfusion injury is mediated by receptor for advanced glycation end-products signaling. Am J Respir Cell Mol Biol 2012;46(3):299–305. [DOI] [PMC free article] [PubMed] [Google Scholar]
- 14.Bucciarelli LG, Ananthakrishnan R, Hwang YC, Kaneko M, Song F, Sell DR et al. RAGE and modulation of ischemic injury in the diabetic myocardium. Diabetes 2008;57(7):1941–1951. [DOI] [PMC free article] [PubMed] [Google Scholar]
- 15.Juranek JK, Geddis MS, Song F, Zhang J, Garcia J, Rosario R et al. RAGE deficiency improves postinjury sciatic nerve regeneration in type 1 diabetic mice. Diabetes 2013;62(3):931–943. [DOI] [PMC free article] [PubMed] [Google Scholar]
- 16.Henderson JM. Liver transplantation and rejection: an overview. Hepato-Gastroenterology 1999;46 Suppl 2:1482–1484. [PubMed] [Google Scholar]
- 17.Howard TK, Klintmalm GB, Cofer JB, Husberg BS, Goldstein RM, Gonwa TA. The influence of preservation injury on rejection in the hepatic transplant recipient. Transplantation 1990;49(1):103–107. [DOI] [PubMed] [Google Scholar]
- 18.Zhai Y, Busuttil RW, Kupiec-Weglinski JW. Liver ischemia and reperfusion injury: new insights into mechanisms of innate-adaptive immune-mediated tissue inflammation. Am J Transplant 2011;11(8):1563–1569. [DOI] [PMC free article] [PubMed] [Google Scholar]
- 19.King TD, Song L, Jope RS. AMP-activated protein kinase (AMPK) activating agents cause dephosphorylation of Akt and glycogen synthase kinase-3. Biochem Pharmacol 2006;71(11):1637–1647. [DOI] [PMC free article] [PubMed] [Google Scholar]
- 20.Gill R, Tsung A, Billiar T. Linking oxidative stress to inflammation: Toll-like receptors. Free Radic Biol Med 2010;48(9):1121–1132. [DOI] [PMC free article] [PubMed] [Google Scholar]
- 21.Schwabe RF, Brenner DA. Mechanisms of Liver Injury. I. TNF-alpha-induced liver injury: role of IKK, JNK, and ROS pathways. Am J Physiol Gastrointest Liver Physiol 2006;290(4):G583–589. [DOI] [PubMed] [Google Scholar]
- 22.Behrends M, Martinez-Palli G, Niemann CU, Cohen S, Ramachandran R, Hirose R. Acute hyperglycemia worsens hepatic ischemia/reperfusion injury in rats. J Gastrointest Surg 2010;14(3):528–535. [DOI] [PMC free article] [PubMed] [Google Scholar]
- 23.Shen XD, Ke B, Zhai Y, Amersi F, Gao F, Anselmo DM et al. CD154-CD40 T-cell costimulation pathway is required in the mechanism of hepatic ischemia/reperfusion injury, and its blockade facilitates and depends on heme oxygenase-1 mediated cytoprotection. Transplantation 2002;74(3):315–319. [DOI] [PubMed] [Google Scholar]
- 24.Yue S, Rao J, Zhu J, Busuttil RW, Kupiec-Weglinski JW, Lu L et al. Myeloid PTEN deficiency protects livers from ischemia reperfusion injury by facilitating M2 macrophage differentiation. J Immunol 2014;192(11):5343–5353. [DOI] [PMC free article] [PubMed] [Google Scholar]
- 25.Zhai Y, Shen XD, Gao F, Zhao A, Freitas MC, Lassman C et al. CXCL10 regulates liver innate immune response against ischemia and reperfusion injury. Hepatology 2008;47(1):207–214. [DOI] [PubMed] [Google Scholar]
- 26.Arumugam T, Ramachandran V, Gomez SB, Schmidt AM, Logsdon CD. S100P-derived RAGE antagonistic peptide reduces tumor growth and metastasis. Clin Cancer Res 2012;18(16):4356–4364. [DOI] [PMC free article] [PubMed] [Google Scholar]
- 27.Rao J, Yue S, Fu Y, Zhu J, Wang X, Busuttil RW et al. ATF6 Mediates a Pro-Inflammatory Synergy Between ER Stress and TLR Activation in the Pathogenesis of Liver Ischemia-Reperfusion Injury. Am J Transplant 2014. [DOI] [PMC free article] [PubMed] [Google Scholar]
- 28.Zeng S, Dun H, Ippagunta N, Rosario R, Zhang QY, Lefkowitch J et al. Receptor for advanced glycation end product (RAGE)-dependent modulation of early growth response-1 in hepatic ischemia/reperfusion injury. J Hepatol 2009;50(5):929–936. [DOI] [PubMed] [Google Scholar]
- 29.Zeng S, Feirt N, Goldstein M, Guarrera J, Ippagunta N, Ekong U et al. Blockade of receptor for advanced glycation end product (RAGE) attenuates ischemia and reperfusion injury to the liver in mice. Hepatology 2004;39(2):422–432. [DOI] [PubMed] [Google Scholar]
- 30.Ibrahim ZA, Armour CL, Phipps S, Sukkar MB. RAGE and TLRs: relatives, friends or neighbours? Mol Immunol 2013;56(4):739–744. [DOI] [PubMed] [Google Scholar]
- 31.Nagareddy PR, Murphy AJ, Stirzaker RA, Hu Y, Yu S, Miller RG et al. Hyperglycemia promotes myelopoiesis and impairs the resolution of atherosclerosis. Cell Metab 2013;17(5):695–708. [DOI] [PMC free article] [PubMed] [Google Scholar]
- 32.Parathath S, Grauer L, Huang LS, Sanson M, Distel E, Goldberg IJ et al. Diabetes adversely affects macrophages during atherosclerotic plaque regression in mice. Diabetes 2011;60(6):1759–1769. [DOI] [PMC free article] [PubMed] [Google Scholar]
- 33.Zhang L, Bukulin M, Kojro E, Roth A, Metz VV, Fahrenholz F et al. Receptor for advanced glycation end products is subjected to protein ectodomain shedding by metalloproteinases. J Biol Chem 2008;283(51):35507–35516. [DOI] [PubMed] [Google Scholar]
- 34.Metz VV, Kojro E, Rat D, Postina R. Induction of RAGE shedding by activation of G protein-coupled receptors. PLoS One 2012;7(7):e41823. [DOI] [PMC free article] [PubMed] [Google Scholar]


