

Abstract
Background and Objective
Intravenous immunoglobulin (IVIg) at a standard dosage is the treatment of choice for Guillain–Barré syndrome. The pharmacokinetics, however, is highly variable between patients, and a rapid clearance of IVIg is associated with poor recovery. We aimed to develop a model to predict the pharmacokinetics of a standard 5-day IVIg course (0.4 g/kg/day) in patients with Guillain–Barré syndrome.
Methods
Non-linear mixed-effects modelling software (NONMEM®) was used to construct a pharmacokinetic model based on a model-building cohort of 177 patients with Guillain–Barré syndrome, with a total of 589 sequential serum samples tested for total immunoglobulin G (IgG) levels, and evaluated on an independent validation cohort that consisted of 177 patients with Guillain–Barré syndrome with 689 sequential serum samples.
Results
The final two-compartment model accurately described the daily increment in serum IgG levels during a standard IVIg course; the initial rapid fall and then a gradual decline to steady-state levels thereafter. The covariates that increased IgG clearance were a more severe disease (as indicated by the Guillain–Barré syndrome disability score) and concomitant methylprednisolone treatment. When the current dosing regimen was simulated, the percentage of patients who reached a target ∆IgG > 7.3 g/L at 2 weeks decreased from 74% in mildly affected patients to only 33% in the most severely affected and mechanically ventilated patients (Guillain–Barré syndrome disability score of 5).
Conclusions
This is the first population-pharmacokinetic model for standard IVIg treatment in Guillain–Barré syndrome. The model provides a new tool to predict the pharmacokinetics of alternative regimens of IVIg in Guillain–Barré syndrome to design future trials and personalise treatment.
Supplementary Information
The online version contains supplementary material available at 10.1007/s40262-022-01136-z.
Key Points
| This study details the first robust nonlinear mixed-effects modelling (NONMEM®)-based model to predict the pharmacokinetics of a standard dosage of intravenous immunoglobulin in patients with Guillain–Barré syndrome. |
| Disease severity and additional treatment with methylprednisolone are important covariates increasing the clearance of high-dose intravenous immunoglobulin. |
| This model provides a tool to explore intravenous immunoglobulin trial designs and potentially optimise the treatment of individual patients with Guillain–Barré syndrome and/or other diseases treated with high-dose intravenous immunoglobulin. |
Introduction
Intravenous immunoglobulin (IVIg) is the mainstay of treatment for Guillain–Barré syndrome (GBS), an acute immune-mediated polyradiculoneuropathy, but the treatment response is highly variable [1–3]. Guillain–Barré syndrome has a monophasic disease course with a rapidly progressive onset of weakness followed by slow recovery. Intravenous immunoglobulin and plasma exchange are equally effective treatments for GBS [1, 4], but in most hospitals IVIg is preferred as it is easier to administer, less likely to be discontinued, and more widely available [4]. However, despite treatment, about 25% of patients develop respiratory failure, 10–20% remain disabled, and the majority have residual complaints [2, 3]. Since the early 1990s, combinations of treatments with IVIg and plasma exchange or corticosteroids were tested in randomised controlled trials, but no superior therapies were found, and neither the treatment nor the prognosis of GBS has changed [2, 3, 5, 6]. The precise mechanism of action of IVIg in GBS is unknown and may differ between variants of GBS [7–9]. Yet, most of the proposed mechanisms of IVIg are dose dependent, which implies that the therapeutic effect of IVIg depends on the pharmacokinetics.
Previous studies have shown that the recommended high-dose regimen for GBS of 0.4 g/kg/day for 5 consecutive days may not be optimal for all patients [9–13]. First, 8–16% of patients may show a secondary deterioration after initial improvement, and some of these patients improve again after a second course of IVIg [9, 10, 14]. Second, the serum immunoglobulin G (IgG) level after a standard dosage of IVIg is highly variable between patients with GBS, and a more rapid IVIg clearance (CL) is associated with a more severe clinical course and poor recovery [12]. These results indicate that the variability in the pharmacokinetics of IVIg between patients is clinically relevant in GBS. More specifically, patients who maintained an increase of their IgG level of at least 7.3 g/L (∆IgG) at 2 weeks from baseline after a standard dosage of IVIg had a better clinical outcome [12].
At present, there is no model to predict the pharmacokinetics of IVIg to design more effective treatment regimens for future trials or to optimise the treatment in individual patients with GBS. The standard regimen of IVIg is copied from other diseases, and the dosing on body weight alone may not be adequate [15]. Moreover, all patients with GBS are treated with the same standard course independent of clinical severity or estimated prognosis. A recent comparative study showed that a second course of IVIg in severely affected patients with GBS compared to a single course does not improve the outcome on a group level, indicating that more personalised regimens are required [16]. Until now, it is unknown which factors influence the CL of IVIg and how such information could be used to individualise the treatment in patients with GBS.
The current standard to predict the pharmacokinetics of pharmaceutical therapy is the use of nonlinear mixed-effects modelling (NONMEM®) software, which provides a framework to quantify and explain variability in drug exposure and response on a population level. Additionally, simulations can be performed to assess new or alternative treatment regimens, or to attain and maintain a sufficiently high increase in drug concentrations associated with a better clinical outcome. Ultimately, the goal is to define and use a target concentration (e.g. biomarker or drug) that can be used to guide individualised dosing based on pharmacological principles [17].
The aim of this study was to describe the population pharmacokinetics of high-dose IVIg treatment in patients with GBS, and to identify covariates influencing the pharmacokinetics to explain the large variability observed between patients. The population pharmacokinetic (PK) model of IVIg in patients with GBS was externally validated and used to simulate concentration–time profiles of alternative dosing regimens to predict the exposure of IVIg in individual patients with GBS.
Methods
Study Design and Population
Data for this study were obtained from previous trials conducted by the Dutch GBS Study Group investigating the clinical effect of IVIg in patients with GBS [5, 18]. First, a multicenter randomised controlled trial was conducted to compare the effects of IVIg (0.4 g/kg/day for 5 days, intermittent intravenous infusion) with plasma exchange [5]. Later, a double-blind, placebo-controlled, multicenter, randomised trial was performed to investigate the effect of concomitant treatment with methylprednisolone (MP) administered intravenously (500 mg over 5 days) or placebo starting within 48 h of the first IVIg (0.4 g/kg/day for 5 days) course [18]. All patients fulfilled the diagnostic criteria for GBS, were unable to walk independently at study entry, and received the same IVIg regimen of 0.4 g/kg/day for 5 consecutive days. Serum samples were obtained before the start of treatment, if possible; and 2 weeks, 4 weeks, 16 weeks, and 26 weeks after the start of treatment.
To define the pharmacokinetics of IVIg before the first 2-week follow-up visit, and to obtain more robust predictions, we included previous results on serum IgG levels from 15 patients with chronic inflammatory demyelinating polyneuropathy (CIDP). All patients with CIDP had stable disease and were treated with a fixed IVIg maintenance regimen [19].
For the evaluation cohort, we included patients from the SID-GBS trial, in which patients with a poor prognosis were randomised for either a placebo or a second IVIg course [16]. Patients with a good prognosis only received a standard IVIg course (0.4 g/kg/day for 5 days) and were not randomised, but their follow-up and assessment of outcome parameters were equal to randomised patients. The randomised patients were not included in this analysis. Exclusion criteria are described in the SID-GBS study [16]. Additionally, patients were excluded when no serum sample was available after treatment, when dose and weight were missing, or when multiple IVIg courses were given (outside the study protocol). Out of 215 patients with a good prognosis in the SID cohort, 177 patients with GBS met the inclusion criteria for this study. All patients with GBS in the model-building cohort received the same IVIg product (Gammagard S/D®; Baxter, Vienna, Austria). The patients with CIDP were predominantly treated with an IVIg product from the same manufacturer (Kiovig/Gammagard liquid; Baxter) except for three patients taking Privigen® (CSL Behring, Marburg, Germany). The patients with GBS in the validation cohort received the preferred brand of the participating hospital, mostly Nanogam® (Sanquin, Amsterdam, the Netherlands), Privigen® or Kiovig®. This retrospective study was exempted from the Medical Research Involving Human Subjects Act (Dutch law, WMO) by the Institutional Review Board of Erasmus University Medical Center Rotterdam (reference number: MEC-2016-173).
Laboratory Analysis and Clinical Outcomes
Serum samples were aliquoted and stored at – 80 °C until use. Total IgG levels were determined by routine diagnostic turbidimetry, as described earlier [5, 12, 16]. All samples in the model-building cohort and the validation cohort were tested for IgG on the same platform in 2009 and between 2018 and 2019, respectively. Polymerase chain reaction was used in a subset of patients with GBS (n = 71) to determine the Fc Fragment of IgG Receptor and Transporter (FCGRT) variable number of tandem repeats (VNTR) for the IgG recycling neonatal Fc-Receptor (FcRn) [12, 20].
As clinical outcome measures, the Medical Research Council sum score (MRC-SS) and GBS disability score (GBS-DS) were assessed at every visit. The MRC-SS is a measure for limb weakness and ranges from zero (quadriplegic) to 60 (regular strength) [21]. The GBS-DS is the most frequently used outcome measure for GBS and ranges from zero (no disability) to 6 (death) [22].
PK Analyses
The PK model was developed using nonlinear mixed-effects modelling (NONMEM version 7.4.0; ICON Development Solutions, Ellicott City, MD, USA) and PsN version 4.2.0 [23, 24]. Models were fitted using first-order conditional estimation with interaction. Tools used for visual inspection and evaluation of the model were Pirana version 3.0.0 (Certara, Princeton, NJ, USA), R version 4.0.5 (R Foundation for Statistical Computing, Vienna, Austria), Rstudio version 1.4.1106, Xpose version 0.4.13 and Xpose4 version 4.7.1 [25, 26].
Base-Model Development
One-compartment and two-compartment distribution models were considered. To obtain estimates of the total IgG level, which is the sum of endogenous IgG and IVIg-derived IgG, we incorporated the endogenous IgG production as a baseline concentration (CBAS) in the model. Patients with CIDP have a higher steady-state baseline IgG level because of prolonged maintenance treatment. The typical value for CBAS and the effect of disease type were included in the base model according to the following equation:
where θCBAS is the population parameter estimate for CBAS and θT is the population parameter estimate for disease type (TYPE = 1 for GBS, and TYPE = 0 for CIDP). Typical values for CL, inter-compartmental CL (Q), and volume of distribution were estimated. Inter-individual variability (IIV) was evaluated for each PK parameter using an exponential model. Residual variability was evaluated according to an additive and/or proportional error model. To account for the effect of variable body weight across size-dependent parameters, allometric scaling was used [27, 28]. Model selection was based on the objective function value (OFV) and significant models were checked for realistic parameter estimates, shrinkage values (< 20%), conditional number (< 1000), and visual improvement of goodness-of-fit plots [29].
Covariate Model
Available covariates were selected based on known or theoretical interactions with the pharmacokinetics of IVIg. The following covariates were evaluated: GBS-DS, MRC-SS, MP, dose, preceding diarrhea, sex, age, mechanical ventilation and VNTR (if available). Continuous variables were centred on the median and described using an exponential function. Categorical variables were described using a proportional function. The relationship between covariates and IIV was explored graphically, followed by a univariate analysis of covariates that were visually correlated with PK parameters. Significant covariates in the univariate analysis (p < 0.05, ∆OFV > 3.84) were analysed in a forward inclusion (p < 0.05, ∆OFV > 3.84), followed by a backward elimination procedure (p < 0.01, ∆OFV > 6.64) [30].
Internal Model Evaluation
The final model was internally evaluated using two procedures. First, a bootstrap method was applied, in which the dataset was resampled 1000 times [31]. The stability and performance of the final model were evaluated by comparing the estimates from the original dataset with the parameter estimates derived from the bootstrap. Second, the model was graphically evaluated with a visual predictive check (VPC) with 1000 simulated datasets and stratified on disease type.
External Model Evaluation
External evaluation of the final PK model was performed on an independent dataset containing 177 patients with GBS (SID-GBS) [16]. The simulated predictions obtained from the fixed model parameter estimates using the design of the validation dataset were compared with the observations in the validation cohort, and visualised with a VPC (n = 1000). Predictive performance of the model was evaluated by computing the prediction error and the root mean square error [32]. Predictive performance of the model was further evaluated using a normalised prediction distribution error (npde) analysis. This analysis was performed using 1000 iterations with the npde package (version 3.1) in R [33].
Simulations
The impacts of covariates and alternative treatment regimens on the IVIg concentrations were evaluated using simulations. Monte Carlo simulations (n = 1000) were performed using PK parameters obtained from the final model. The effect of significant covariates was visualised using the standard dosing regimen of 0.4 g/kg/day for 5 days and a bodyweight of 75 kg. Dosing regimens of 0.4 g/kg/day for 3 versus 6 days [34], and 1 g/kg/day for 2 days [35] were assessed for target attainment (∆IgG > 7.3 g/L).
Results
Study Population
The final model-building cohort consisted of 589 serum IgG levels from 177 patients with GBS and 222 serum IgG levels from 15 patients with CIDP [5, 18]. The final validation cohort consisted of an independent set of 689 serum samples from 177 patients with GBS. Patient characteristics are presented in Table 1. The median number of samples per patient was three (range 2–7) in the model-building cohort and four (range 1–6) in the validation cohort. The GBS-DS at the nadir (most severe disease state) was higher in the model-building cohort compared with the validation cohort (Table 1). Similarly, the MRC-SS at the nadir was lower in the model-building cohort, indicating more severe limb muscle weakness, and more patients required mechanical ventilation, indicating that the disease activity in the model-building cohort was higher than in the validation cohort (Table 1).
Table 1.
Demographics and clinical characteristics of the model-building and validation cohorts
| Demographics | Model-building cohort n = 177 |
Model validation cohort n = 177 |
|---|---|---|
| Age, years (range) | 53 (5–89) | 55 (18–86) |
| Weight, kg (range) | 72 (18–122) | 79 (52.6–118) |
| Male:female ratio (% male) | 1.31 (57%) | 1.72 (63%) |
| Clinical characteristics | ||
| Preceding diarrhoea | 42 (24%) | 38 (21%) |
| MRC sum score at study entry | 40.4 (11.4) | 49.2 (6.3) |
| GBS disability score at study entry | 3.8 (0.6) | 3.2 (0.8) |
| MRC sum score at nadir | 33.4 (16.8) | 47.4 (6.6) |
| GBS disability score at nadir | 4.1 (0.7) | 3.5 (0.8) |
| Mechanical ventilation needed | 44 (25%) | 17 (10%) |
| GBS disability score of > 2 at 6 months | 30 (17%) | 13 (7%) |
| Treatment characteristics | ||
| Daily IVIg dose in grams | 29.3 (6.8) | 32.1 (6.0) |
| Cumulative dose of IVIg in grams | 146.4 (33.9) | 160.1 (30.6) |
| Methylprednisolone | 61 (34%) | 31 (18%) |
GBS Guillain–Barré syndrome, IVIg intravenous immunoglobulin, MRC Medical Research Council
Data are presented as mean (standard deviation) or number (percentage) of patients unless otherwise indicated. All patients were treated with the same standard regimen of IVIg (2 g/kg over 5 consecutive days)
Base Model
The data were best described using a two-compartment model with first-order elimination. The baseline endogenous IgG concentration (CBAS) was estimated at 10.3 g/L for patients with GBS. Patients with CIDP had an estimated baseline of 15.9 g/L. The patients with CIDP received IVIg maintenance treatment and therefore attained a steady state level with a higher IgG serum concentration. Allometric scaling with fixed exponents (0.75 for CL and inter-compartmental CL, and 1 for central volume of distribution and peripheral volume of distribution) significantly improved the model (p < 0.01). The model was further improved with IIV on CL and CBAS. The residual error model was best described with a proportional function. Parameter estimates for the base model are presented in Table 2.
Table 2.
Pharmacokinetic parameter estimates for the base and final models including the bootstrap (876/1000 runs successful) analysis for the final model
| Parameter | Base-model estimate (RSE%) | Final model estimate (RSE%) | Bootstrap median | Bootstrap 95% CI |
|---|---|---|---|---|
| CL (L/day/70 kg) | 0.38 (6) | 0.28 (9) | 0.28 | 0.24–0.34 |
| Methylprednisolone | – | 1.31 (9) | 1.33 | 1.11–1.59 |
| GBS disability score of 0–2 | – | 1 (fixed) | 1 (fixed) | 1 (fixed) |
| GBS disability score of 3–4 | – | 1.22 (10) | 1.22 | 0.99–1.49 |
| GBS disability score of 5 | – | 1.83 (15) | 1.85 | 1.36–2.55 |
| V1 (L) | 2.83 (7) | 2.87 (7) | 2.87 | 2.54–3.34 |
| Q (L/day) | 0.26 (17) | 0.25 (17) | 0.25 | 0.16–0.36 |
| V2 (L) | 2.85 (11) | 2.65 (13) | 2.65 | 2.05–3.39 |
| CBAS (g/L) | 15.40 (6) | 15.90 (8) | 15.81 | 13.96–17.76 |
| Disease type (if GBS) | 0.67 (7) | 0.65 (9) | 0.66 | 0.57–0.75 |
| Interindividual variability | Estimate (%RSE) [shrinkage] | Estimate (%RSE) [shrinkage] | Bootstrap median | Bootstrap 95% CI |
|---|---|---|---|---|
| CL (%) | 58.8 (9) [17] | 49.9 (10) [19] | 49.0% | 38.5–61.2 |
| CBAS (%) | 23.2 (8) [7] | 23.1 (8) [7] | 23.0% | 19.6–26.8 |
| Residual error | Base model estimate | Final model estimate | Bootstrap median | Bootstrap 95% CI |
|---|---|---|---|---|
| Proportional | 0.12 [20] | 0.12 (7) [19] | 0.12 | 0.10–0.13 |
CBAS baseline immunoglobulin level, CI confidence interval, CL clearance, CV coefficient of variation, GBS Guillain–Barré syndrome, Q intercompartmental clearance, RSE relative standard error, V1 central volume of distribution, V2 peripheral volume of distribution
Covariate Model
The base model was used as a reference for the covariate analysis. In the univariate analysis, a significant association was observed between GBS-DS, mechanical ventilation, MRC-SS and MP on CL; and preceding diarrhoea on CBAS. Sex, age and VNTR were not significantly correlated with any of the PK parameters. After forward inclusion and backward elimination, the final model entailed two significant covariates. First, additional treatment with MP increased IgG CL by 31% compared with patients only treated with IVIg. Second, a higher GBS-DS was correlated with a higher CL. To describe this effect, the score could be reduced to three categories: GBS-DS of 0, 1 or 2 were combined and used as a reference; GBS-DS of 3 and 4 were combined, and a GBS-DS of 5 (mechanical ventilation) as the last category. The estimated increase in CL for patients with a GBS-DS of 4 was 22%, and 83% for patients with a GBS-DS of 5. A GBS-DS of 6 was disregarded as this marks mortality. The following equation described the final model for estimation of the typical value for CL:
Evaluation of the Final Model
An overview of the PK parameters, covariates and IIV of the final model is shown in Table 2. Intravenous immunoglobulin had a relatively small volume of distribution in the central compartment and a CL of 0.28 L/day/70 kg. The CL was considerably higher in patients with a more severe form of disease as reflected by a higher GBS-DS (Fig. 1).
Fig. 1.
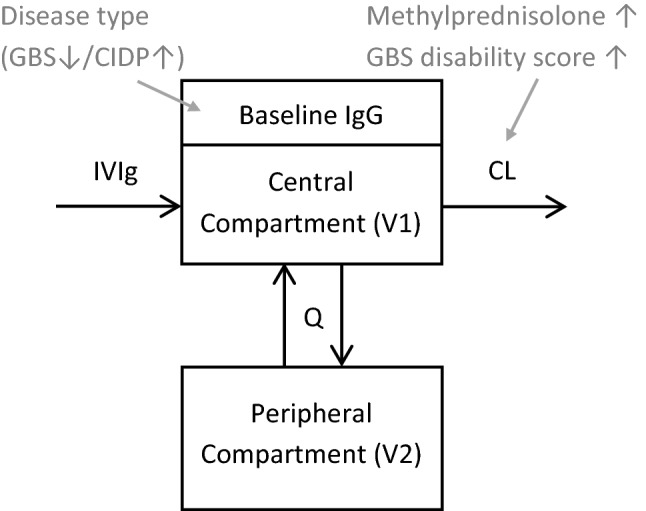
Schematic of the final model. Intravenous immunoglobulin (IVIg) enters the central (vascular) compartment (V1, central volume of distribution) directly. In this compartment, there is already an immunoglobulin G (IgG) concentration at baseline (CBAS) owing to the endogenous production. There is an exchange gradient (Q, intercompartmental clearance) from V1 to the peripheral compartment (V2, peripheral volume of distribution). Clearance (CL) of IgG takes place from the central compartment. The influence of covariates are represented in grey, with a downward-pointing or upward-pointing arrow denoting a decrease or an increase of the respective parameter. CIDP chronic inflammatory demyelinating polyneuropathy, GBS Guillain–Barré syndrome
Goodness-of-fit plots showed an even distribution around the unity line for population-predicted and individual-predicted concentrations, and the residuals were evenly distributed over time (Fig. 2A). Shrinkage was below 20% for all estimates. Visual predictive checks of the model-building dataset stratified for disease type showed that the median and variability of the observations generally fell within the model-predicted boundaries (Fig. 3A, Fig. S1 of the Electronic Supplementary Material [ESM]). Bootstrap analysis (convergence 88%) underlined the stability of the model and denoted acceptable lower and upper limits of the 95% confidence interval (Table 2).
Fig. 2.

Goodness-of-fit plots for the final model. A–D Model-building cohort. A Observed concentration plotted against predicted concentration. B Observed concentration plotted against individual-predicted concentration. C Absolute individual weighted residuals (IWRES) against time. D Conditional weighted residuals against time. E–H similar to A–D but for a model validation cohort. The red line represents the smooth fit.
Fig. 3.

Visual predictive checks using the final model parameter estimates for the A model-building cohort and B validation cohort (n = 1000 simulations). In B, 12 observations after 3000 h were omitted. The bold red line in the middle denotes the 50th percentile of the observations and the lower and upper lines represent the lower 5th percentile and upper 95th percentile of the observed data. The bordering shaded areas represent the 95% confidence interval of the respective percentiles of the predicted data. IgG immunoglobulin G
Next, we evaluated the robustness of the model in the validation cohort. Population and individual predictions distributed evenly around the unity line; however, we observed a minor bias around the 2-week visit (336 h) in the conditional weighted residuals (Fig. 2B). Similarly, the median and variability were adequately described in the VPC, except for minor deviations around that same timepoint (Fig. 3B). Evaluation of the npde analysis on the validation cohort generally showed good agreement, where the majority of the npde fell within the − 1.96 to 1.96 interval, the mean npde did not significantly differ from 0 (p = 0.295), and the npde followed a normal distribution (p = 0.084) [Fig. S2 of the ESM]. However, the variance was significantly different from 1 (p < 0.001). The root mean square error of the model was 19.39% and the prediction error was − 0.25, indicating that there was no bias in the predictions. This indicates that the final model overestimates the variability observed in the validation cohort, but the predictive performance of the model seems adequate.
Simulations in Relation to Pharmacodynamic Outcomes
After identification of the main factors that determine the variation in the pharmacokinetics of IVIg, the extent of these effects could be simulated using several scenarios (Fig. 4). This figure can serve as a starting point to predict a better dosing regimen knowing the patient characteristics.
Fig. 4.

Simulating dosing regimens. A Simulation of 1000 “typical” patients with Guillain–Barré syndrome from our cohort (all variables set on the group median) receiving the standard dose of 0.4 g/kg/day for 5 days. Data represent the median (predicted) immunoglobulin G (IgG) values over time with the shaded area denoting the 90% confidence interval. The other sub-charts show simulations with alternative conditions as follows: B the impact of disease severity (Guillain–Barré syndrome disability score [GBS-DS]); C additional treatment with intravenous methylprednisolone (MP) [500 mg for 5 days]; and D 3 versus 6-day regimen of 0.4 g/kg/day, and 2.0 g/kg in 2 days. The horizontal dashed line B–D represents an increase of 7.3 g/L of IgG compared with baseline (∆IgG); the vertical dashed line denotes the 2-week timepoint after the start of treatment.
First, a “typical” patient with GBS of 75 kg with a GBS-DS of 4 (chair or bedbound) administered 0.4 g/kg of IVIg in 2 hours for 5 subsequent days was simulated (Fig. 3A). The concentration was highest immediately after the fifth dose, and subsequently, levels slowly decreased to baseline after 4 weeks. Second, the effect of several factors influencing the pharmacokinetics of IVIg on this standard dose of 5 days at 0.4 g/kg was simulated (all other variables remained equal). In Fig. 4B, the effect of disease severity represented by the GBS-DS is shown. More severely affected patients based on their GBS-DS had a significantly higher CL of IVIg and were therefore more prone to have a ∆IgG under the cut-off of 7.3 g/L compared with less severely affected patients. The percentage of patients reaching the target ∆IgG of > 7.3 g/L at 2 weeks decreased from 74% of patients with a GBS-DS of 0–2, to 63% of patients with a GBS-DS of 3–4 (wheelchair bound), to only 33% of the patients with a GBS-DS of 5 (mechanical ventilation). Figure 4C represents the effect of the co-treatment with MP. Adding this corticosteroid pulse treatment increased the CL, resulting in lower IgG levels 2 weeks after IVIg treatment. This co-treatment reduced the percentage of patients reaching the target ∆IgG of > 7.3 g/L from 63 to 43%. Finally, the effect of different IVIg dose regimens was simulated in the “typical” patient with GBS as described above. Dose regimens of 0.4 g/kg/day for 6 consecutive days result in higher concentrations at 2 weeks after the start of the treatment, compared with 0.4 g/kg/day during 3 consecutive days (Fig. 4D). The percentage of patients reaching the target ∆IgG of > 7.3 g/L at 2 weeks decreased from 74% of patients on the 6-day regimen to 12% for patients on the 3-day regimen. With the 2-day regimen, 54% of the patients were estimated to reach the target ∆IgG concentration.
Discussion
In this study, the pharmacokinetics of the standard 5-day course of (in total) 2 g/kg body weight of IVIg in patients with GBS was modelled. Our results showed that the pharmacokinetics of IVIg was best described using a two-compartment model with linear elimination, allometric scaling, an endogenous IgG baseline, and IIV on CL and CBAS. Importantly, we demonstrated that the severity of the disease expressed as the GBS-DS and concomitant treatment with MP significantly influenced the CL of IVIg. The robustness of the model was confirmed in an independent cohort of patients with GBS. The final model was used to determine the effect of alternative dosing regimens of IVIg on the PK profile in patients with GBS. These results are a first step to personalise the IVIg treatment regimen for patients with GBS.
Previously, our group showed a high variability in serum IgG levels in patients with GBS after a standard course with IVIg, as well as an association with the clinical course and outcome [12]. In the current study, a more severe form of GBS was related to higher CL of IgG. A possible explanation for this might be that the consumption rate was increased because of more severe inflammation [36, 37]. Moreover, the poor clinical condition could have resulted in a general catabolic state. Methylprednisolone also had a significant impact on IgG CL, which is in line with earlier studies showing an effect of short-term corticosteroid therapy on serum IgG levels [38, 39]. Corticosteroids were previously found to reduce the expression of the IgG recycling FcRn, which may partly explain the lower total serum IgG level after IVIg treatment [40, 41]. In addition, the pleiotropic effects of corticosteroids on the immune system can lead to diminished endogenous IgG synthesis, but the precise mechanisms underlying this immune modulation remain to be elucidated [42]. The effect of corticosteroids on serum IgG levels may underlie the lack of a therapeutic effect of concomitant MP on long-term recovery in GBS [18]. Other factors, including age, sex, preceding symptoms of infections and VNTR polymorphisms of FcRn did not significantly influence the pharmacokinetics. Polymorphisms in FCGRT correspond with different expression and protein levels of FcRn [43]. Previously, a retrospective study in patients with GBS showed no relationship between these polymorphisms and IgG levels or clinical outcome [20]. Moreover, VNTRs did not affect the pharmacokinetics of IVIG in a population PK study based on a small cohort of patients with primary antibody deficiency [44]. In the current study, the VNTR genotype was only available in a subset of patients and the role of these polymorphisms can not be excluded.
We were unable to discriminate between IgG from endogenous production and therapeutic IVIg; therefore, the study was restricted to total serum IgG levels. Despite this limitation, there are several strategies available to take endogenous IgG production into account in a PK model [45]. Here, a baseline variable was used, estimated from individual pre-IVIg IgG levels; a method successfully utilised before, regarding similar endogenous production issues [46]. Even so, the precise effect of endogenous IgG on total IgG CL could not be assessed. Currently, assays are being developed to discriminate between total IgG and therapeutic IgG [47].
The robustness of the model was demonstrated internally by a good agreement in the goodness-of-fit plots, VPC and bootstrap. The shrinkage was small for the residual error and IIV, which ensures a reliable evaluation of diagnostic tools. For the validation cohort, the final model generally provided an adequate description of the data. However, a minor misspecification of the model was detected around the 2-week timepoint. Patients in the validation cohort had a less severe disease course and better clinical outcome compared with the model-building cohort, which may have contributed to the observed discrepancies.
The standard dosage of 2 g/kg body weight in 5 days for GBS is copied from the regimen used in paediatric patients with immune thrombocytopenia [48]. Dose-finding studies with IVIg have been sparsely conducted in GBS and it is unknown if the standard regimen is optimal for this disorder [15, 49]. Whether a higher peak concentration and/or a larger area under the concentration–time curve has clinical significance remains to be unravelled. The correlation between variable treatment response and the pharmacokinetics of IgG infers that the current dosing regimen based on actual body weight may not be optimal. This could pave the way for alternative dosing on adjusted or ideal body weight, which is the focus of ongoing studies and already standard procedure in some regions [50–52]. Interestingly, paediatric patients with GBS treated with the full dosage of IVIg in 2 days more frequently had relapses than those receiving the same dosage in 5 days, also suggesting a suboptimal more rapid CL [35]. In addition, 8–16% of adult patients may develop a secondary deterioration requiring a second standard course of IVIg, indicating that the current treatment dosage was insufficient. Without knowledge of IgG levels, a 6-day course has been studied in the past, where these patients tended to have a better clinical outcome [34]. Combining our PK findings with these clinical observations suggest that a rapid high initial spike with IVIg may not be the most beneficial for patients with GBS; instead, a longer exposure of sufficiently high IVIg levels during the active stage of disease might be more advantageous.
This study has several limitations. Data shortly after IVIg administration were obtained from patients with CIDP, allowing the model to estimate the pharmacokinetics more precisely. Although this disease is clinically similar to GBS, these particular patients were not treatment naïve. They had been receiving IVIg maintenance therapy, which saturated them with higher IgG serum levels reflected by and taken into account in our model through the higher IgG baseline level. Otherwise, the IVIg is pharmacokinetically expected to behave similar in these immune-competent patients. This is supported by our data, where the VPC stratified for disease type showed a good agreement between the observations and the model prediction in the patients with CIDP. In addition, the models’ estimated PK parameters are comparable to a similar model recently developed for patients with CIDP based on both intravenous, as well as subcutaneous immunoglobulin administration [53]. The authors of this study incorporated the treatment response in their model (based on a trough level ∆IgG), underlining the potential of PK/pharmacodynamic modelling to aid clinicians in personalising the dosing of immunoglobulin therapy.
Conclusions
This study reports the first population-PK model for high-dose IVIg in patients with GBS. Utilising the model, we identified the major demographic and clinical covariates that explain variations between subjects and evaluated several alternative dosing regimens. Moreover, we evaluated the robustness of the model and the parameter estimates in an independent validation cohort. This model provides a tool to explore IVIg trial designs and to optimise the high-dose IVIg treatment of individual patients with GBS and other diseases.
Supplementary Information
Below is the link to the electronic supplementary material.
Declarations
Funding
This work has been supported by an unconditional research grant from the Prinses Beatrix Spierfonds (Grant W.OR11-27 and W.OR19-24).
Conflicts of interest/competing interests
P.A.D. received honoraria and/or unrestricted research support from the Prinses Beatrix Spierfonds, Janivo Stichting, Baxalta, Grifols, Shire, Hans Biopharma, Kedrion, Octapharma and Sanquin Plasma Pharmaceuticals. B.C.J. received unrestricted research support from the Netherlands Organization for Health Research and Development, Erasmus MC, Prinses Beatrix Spierfonds, GBS-CIDP Foundation International, Baxalta, CSL-Behring, Grifols, Annexon and Hansa Biopharma. The other authors have no conflicts of interest that are directly relevant to the contents of this study.
Ethics approval
This retrospective study was exempted from the Medical Research Involving Human Subjects Act (Dutch law, WMO) by the Institutional Review Board of Erasmus University Medical Center Rotterdam (reference number: MEC-2016-173).
Consent to participate
Not applicable.
Consent for publication
Not applicable.
Availability of data and material
The data that support the findings of this study are available from the corresponding author upon reasonable request.
Code availability
The final NONMEM model code is provided in the Electronic Supplementary Material.
Author contributions
WJRF, SJT, BCMW, BCPK, PAD and BCJ wrote the manuscript; WJRF, BCPK and BCJ designed the research; WJRF, SJT, BCMW and BCPK performed the research; and WJRF, SJT, BCMW and BCPK analysed the data.
Footnotes
Willem Jan R. Fokkink and Sander J. van Tilburg contributed equally to the article.
References
- 1.Hughes RA, Swan AV, van Doorn PA. Intravenous immunoglobulin for Guillain–Barre syndrome. Cochrane Database Syst Rev. 2014;9:CD002063. doi: 10.1002/14651858.CD002063.pub6. [DOI] [PMC free article] [PubMed] [Google Scholar]
- 2.van den Berg B, Walgaard C, Drenthen J, et al. Guillain–Barre syndrome: pathogenesis, diagnosis, treatment and prognosis. Nat Rev Neurol. 2014;10(8):469–482. doi: 10.1038/nrneurol.2014.121. [DOI] [PubMed] [Google Scholar]
- 3.Willison HJ, Jacobs BC, van Doorn PA. Guillain–Barre syndrome. Lancet. 2016;388(10045):717–727. doi: 10.1016/S0140-6736(16)00339-1. [DOI] [PubMed] [Google Scholar]
- 4.Leonhard SE, et al. Diagnosis and management of Guillain–Barré syndrome in ten steps. Nat Rev Neurol. 2019;15(11):671–683. doi: 10.1038/s41582-019-0250-9. [DOI] [PMC free article] [PubMed] [Google Scholar]
- 5.van der Meche FG, Schmitz PI. A randomized trial comparing intravenous immune globulin and plasma exchange in Guillain–Barre syndrome. Dutch Guillain–Barre Study Group. N Engl J Med. 1992;326(17):1123–1129. doi: 10.1056/NEJM199204233261705. [DOI] [PubMed] [Google Scholar]
- 6.Hughes RAC, Cornblath DR, Willison HJ. Guillain–Barre syndrome in the 100 years since its description by Guillain, Barre and Strohl. Brain. 2016;139(11):3041–3047. doi: 10.1093/brain/aww247. [DOI] [PubMed] [Google Scholar]
- 7.Lunemann JD, Nimmerjahn F, Dalakas MC. Intravenous immunoglobulin in neurology: mode of action and clinical efficacy. Nat Rev Neurol. 2015;11(2):80–89. doi: 10.1038/nrneurol.2014.253. [DOI] [PubMed] [Google Scholar]
- 8.Hou HQ, et al. Changes in lymphocyte subsets in patients with Guillain–Barre syndrome treated with immunoglobulin. BMC Neurol. 2014;14:202. doi: 10.1186/s12883-014-0202-3. [DOI] [PMC free article] [PubMed] [Google Scholar]
- 9.Verboon C, van Doorn PA, Jacobs BC. Treatment dilemmas in Guillain–Barre syndrome. J Neurol Neurosurg Psychiatry. 2017;88(4):346–352. doi: 10.1136/jnnp-2016-314862. [DOI] [PubMed] [Google Scholar]
- 10.Kleyweg RP, van der Meche FG. Treatment related fluctuations in Guillain–Barre syndrome after high-dose immunoglobulins or plasma-exchange. J Neurol Neurosurg Psychiatry. 1991;54(11):957–960. doi: 10.1136/jnnp.54.11.957. [DOI] [PMC free article] [PubMed] [Google Scholar]
- 11.Visser LH, et al. Risk factors for treatment related clinical fluctuations in Guillain–Barre syndrome. Dutch Guillain–Barre Study Group. J Neurol Neurosurg Psychiatry. 1998;64(2):242–244. doi: 10.1136/jnnp.64.2.242. [DOI] [PMC free article] [PubMed] [Google Scholar]
- 12.Kuitwaard K, et al. Pharmacokinetics of intravenous immunoglobulin and outcome in Guillain–Barre syndrome. Ann Neurol. 2009;66(5):597–603. doi: 10.1002/ana.21737. [DOI] [PubMed] [Google Scholar]
- 13.van Doorn PA, et al. IVIG treatment and prognosis in Guillain–Barre syndrome. J Clin Immunol. 2010;30(Suppl. 1):S74–S78. doi: 10.1007/s10875-010-9407-4. [DOI] [PMC free article] [PubMed] [Google Scholar]
- 14.Hughes RA, et al. Immunotherapy for Guillain–Barre syndrome: a systematic review. Brain. 2007;130(Pt 9):2245–2257. doi: 10.1093/brain/awm004. [DOI] [PubMed] [Google Scholar]
- 15.Kerr J, et al. Is dosing of therapeutic immunoglobulins optimal? A review of a three-decade long debate in Europe. Front Immunol. 2014;5:629. doi: 10.3389/fimmu.2014.00629. [DOI] [PMC free article] [PubMed] [Google Scholar]
- 16.Walgaard C, et al. Second intravenous immunoglobulin dose in patients with Guillain–Barre syndrome with poor prognosis (SID-GBS): a double-blind, randomised, placebo-controlled trial. Lancet Neurol. 2021;20(4):275–283. doi: 10.1016/S1474-4422(20)30494-4. [DOI] [PubMed] [Google Scholar]
- 17.Holford N, Ma G, Metz D. TDM is dead. Long live TCI! Br J Clin Pharmacol. 2022;88(4):1406–1413. doi: 10.1111/bcp.14434. [DOI] [PMC free article] [PubMed] [Google Scholar]
- 18.van Koningsveld R, et al. Effect of methylprednisolone when added to standard treatment with intravenous immunoglobulin for Guillain–Barre syndrome: randomised trial. Lancet. 2004;363(9404):192–196. doi: 10.1016/s0140-6736(03)15324-x. [DOI] [PubMed] [Google Scholar]
- 19.Fokkink W, et al. Pharmacokinetics and pharmacodynamics of intravenous immunoglobulin G maintenance therapy in chronic immune-mediated neuropathies. Clin Pharmacol Ther. 2017;102(4):709–716. doi: 10.1002/cpt.693. [DOI] [PubMed] [Google Scholar]
- 20.Fokkink WJ, et al. Neonatal Fc receptor promoter gene polymorphism does not predict pharmacokinetics of IVIg or the clinical course of GBS. Ann Clin Transl Neurol. 2016;3(7):547–551. doi: 10.1002/acn3.307. [DOI] [PMC free article] [PubMed] [Google Scholar]
- 21.Kleyweg RP, van der Meche FG, Meulstee J. Treatment of Guillain–Barre syndrome with high-dose gammaglobulin. Neurology. 1988;38(10):1639–1641. doi: 10.1212/wnl.38.10.1639. [DOI] [PubMed] [Google Scholar]
- 22.Hughes RA, et al. Controlled trial prednisolone in acute polyneuropathy. Lancet. 1978;2(8093):750–753. doi: 10.1016/s0140-6736(78)92644-2. [DOI] [PubMed] [Google Scholar]
- 23.Lindbom L, Pihlgren P, Jonsson EN. PsN-Toolkit: a collection of computer intensive statistical methods for non-linear mixed effect modeling using NONMEM. Comput Methods Progr Biomed. 2005;79(3):241–257. doi: 10.1016/j.cmpb.2005.04.005. [DOI] [PubMed] [Google Scholar]
- 24.Lindbom L, Ribbing J, Jonsson EN. Perl-speaks-NONMEM (PsN): a Perl module for NONMEM related programming. Comput Methods Progr Biomed. 2004;75(2):85–94. doi: 10.1016/j.cmpb.2003.11.003. [DOI] [PubMed] [Google Scholar]
- 25.Jonsson EN, Karlsson MO. Xpose: an S-PLUS based population pharmacokinetic/pharmacodynamic model building aid for NONMEM. Comput Methods Progr Biomed. 1999;58(1):51–64. doi: 10.1016/s0169-2607(98)00067-4. [DOI] [PubMed] [Google Scholar]
- 26.Keizer RJ, Karlsson MO, Hooker A. Modeling and simulation workbench for NONMEM: tutorial on Pirana, PsN, and Xpose. CPT Pharmacometr Syst Pharmacol. 2013;2:e50. doi: 10.1038/psp.2013.24. [DOI] [PMC free article] [PubMed] [Google Scholar]
- 27.Holford NHG, Anderson BJ. Allometric size: the scientific theory and extension to normal fat mass. Eur J Pharm Sci. 2017;109S:S59–64. doi: 10.1016/j.ejps.2017.05.056. [DOI] [PubMed] [Google Scholar]
- 28.Sinha J, Al-Sallami HS, Duffull SB. Choosing the allometric exponent in covariate model building. Clin Pharmacokinet. 2019;58(1):89–100. doi: 10.1007/s40262-018-0667-0. [DOI] [PubMed] [Google Scholar]
- 29.Duffull SB, Wright DF, Winter HR. Interpreting population pharmacokinetic-pharmacodynamic analyses: a clinical viewpoint. Br J Clin Pharmacol. 2011;71(6):807–814. doi: 10.1111/j.1365-2125.2010.03891.x. [DOI] [PMC free article] [PubMed] [Google Scholar]
- 30.Hutmacher MM, Kowalski KG. Covariate selection in pharmacometric analyses: a review of methods. Br J Clin Pharmacol. 2015;79(1):132–147. doi: 10.1111/bcp.12451. [DOI] [PMC free article] [PubMed] [Google Scholar]
- 31.Ette EI. Stability and performance of a population pharmacokinetic model. J Clin Pharmacol. 1997;37(6):486–495. doi: 10.1002/j.1552-4604.1997.tb04326.x. [DOI] [PubMed] [Google Scholar]
- 32.Sheiner LB, Beal SL. Some suggestions for measuring predictive performance. J Pharmacokinet Biopharm. 1981;9(4):503–512. doi: 10.1007/BF01060893. [DOI] [PubMed] [Google Scholar]
- 33.Comets E, Brendel K, Mentre F. Computing normalised prediction distribution errors to evaluate nonlinear mixed-effect models: the npde add-on package for R. Comput Methods Progr Biomed. 2008;90(2):154–166. doi: 10.1016/j.cmpb.2007.12.002. [DOI] [PubMed] [Google Scholar]
- 34.Raphael JC, et al. Intravenous immune globulins in patients with Guillain–Barre syndrome and contraindications to plasma exchange: 3 days versus 6 days. J Neurol Neurosurg Psychiatry. 2001;71(2):235–238. doi: 10.1136/jnnp.71.2.235. [DOI] [PMC free article] [PubMed] [Google Scholar]
- 35.Korinthenberg R, et al. Intravenously administered immunoglobulin in the treatment of childhood Guillain-Barre syndrome: a randomized trial. Pediatrics. 2005;116(1):8–14. doi: 10.1542/peds.2004-1324. [DOI] [PubMed] [Google Scholar]
- 36.Wochner RD. Hypercatabolism of normal IgG; an unexplained immunoglobulin abnormality in the connective tissue diseases. J Clin Investig. 1970;49(3):454–464. doi: 10.1172/JCI106254. [DOI] [PMC free article] [PubMed] [Google Scholar]
- 37.Zhou J, Pop LM, Ghetie V. Hypercatabolism of IgG in mice with lupus-like syndrome. Lupus. 2005;14(6):458–466. doi: 10.1191/0961203305lu2129oa. [DOI] [PubMed] [Google Scholar]
- 38.Posey WC, et al. The effects of acute corticosteroid therapy for asthma on serum immunoglobulin levels. J Allergy Clin Immunol. 1978;62(6):340–348. doi: 10.1016/0091-6749(78)90134-3. [DOI] [PubMed] [Google Scholar]
- 39.Butler WT, Rossen RD. Effects of corticosteroids on immunity in man. I. Decreased serum IgG concentration caused by 3 or 5 days of high doses of methylprednisolone. J Clin Investig. 1973;52(10):2629–2640. doi: 10.1172/JCI107455. [DOI] [PMC free article] [PubMed] [Google Scholar]
- 40.Qiao SW, Lencer WI, Blumberg RS. How the controller is controlled: neonatal Fc receptor expression and immunoglobulin G homeostasis. Immunology. 2007;120(2):145–147. doi: 10.1111/j.1365-2567.2006.02507.x. [DOI] [PMC free article] [PubMed] [Google Scholar]
- 41.Kawano T, et al. Hypogammaglobulinemia in steroid-dependent asthmatics correlates with the daily dose of oral prednisolone. Int Arch Allergy Immunol. 2002;128(3):240–243. doi: 10.1159/000064258. [DOI] [PubMed] [Google Scholar]
- 42.Cain DW, Cidlowski JA. Immune regulation by glucocorticoids. Nat Rev Immunol. 2017;17(4):233–247. doi: 10.1038/nri.2017.1. [DOI] [PMC free article] [PubMed] [Google Scholar]
- 43.Dalakas MC. Update on intravenous immunoglobulin in neurology: modulating neuro-autoimmunity, evolving factors on efficacy and dosing and challenges on stopping chronic IVIg therapy. Neurotherapeutics. 2021;18(4):2397–2418. doi: 10.1007/s13311-021-01108-4. [DOI] [PMC free article] [PubMed] [Google Scholar]
- 44.Lee JL, et al. Population pharmacokinetic modelling of intravenous immunoglobulin in patients with predominantly antibody deficiencies. Br J Clin Pharmacol. 2021;87(7):2956–2966. doi: 10.1111/bcp.14712. [DOI] [PubMed] [Google Scholar]
- 45.Kendrick F, et al. Analysis of a compartmental model of endogenous immunoglobulin G metabolism with application to multiple myeloma. Front Physiol. 2017;8:149. doi: 10.3389/fphys.2017.00149. [DOI] [PMC free article] [PubMed] [Google Scholar]
- 46.Hazendonk H, et al. A population pharmacokinetic model for perioperative dosing of factor VIII in hemophilia A patients. Haematologica. 2016;101(10):1159–1169. doi: 10.3324/haematol.2015.136275. [DOI] [PMC free article] [PubMed] [Google Scholar]
- 47.van Tilburg SJ, et al. Novel approach to monitor intravenous immunoglobulin pharmacokinetics in humans using polymorphic determinants in IgG1 constant domains. Eur J Immunol. 2022;52(4):609–617. doi: 10.1002/eji.202149653. [DOI] [PubMed] [Google Scholar]
- 48.Imbach P, et al. High-dose intravenous gammaglobulin for idiopathic thrombocytopenic purpura in childhood. Lancet. 1981;1(8232):1228–1231. doi: 10.1016/s0140-6736(81)92400-4. [DOI] [PubMed] [Google Scholar]
- 49.Patwa HS. Dosing and individualized treatment: patient-centric treatment: changing practice guidelines. Clin Exp Immunol. 2014;178(Suppl. 1):36–38. doi: 10.1111/cei.12503. [DOI] [PMC free article] [PubMed] [Google Scholar]
- 50.Chow S, et al. Trimming the fat with an IVIG approval process. Transfus Apher Sci. 2012;46(3):349–352. doi: 10.1016/j.transci.2012.03.030. [DOI] [PubMed] [Google Scholar]
- 51.Anderson CR, Olson JA. Correlation of weight-based i.v. immune globulin doses with changes in serum immunoglobulin G levels. Am J Health Syst Pharm. 2015;72(4):285–289. doi: 10.2146/ajhp140171. [DOI] [PubMed] [Google Scholar]
- 52.Stump SE, et al. Comparison of weight-based dosing strategies for intravenous immunoglobulin in patients with hematologic malignancies. Pharmacotherapy. 2017;37(12):1530–1536. doi: 10.1002/phar.2047. [DOI] [PubMed] [Google Scholar]
- 53.Tortorici MA, et al. Pharmacometric analysis linking immunoglobulin exposure to clinical efficacy outcomes in chronic inflammatory demyelinating polyneuropathy. CPT Pharmacometr Syst Pharmacol. 2021;10(8):839–850. doi: 10.1002/psp4.12647. [DOI] [PMC free article] [PubMed] [Google Scholar]
Associated Data
This section collects any data citations, data availability statements, or supplementary materials included in this article.