

Abstract
Objective
To evaluate the impact of the Affordable Care Act's Physician Payments Sunshine Act (PPSA), which mandates disclosure of industry payments to physicians, on physician prescribing of branded statins.
Data Sources
Administrative claims data from 2011 to 2015 from three large national commercial insurers were provided by the Health Care Cost Institute.
Study Design
We adopted a difference‐in‐differences and event study design, leveraging the control group of physicians in two states, MA and VT, which implemented state laws on disclosure of industry payments prior to the national PPSA. To further address potential confounding caused by differences in prescribing patterns across states, our analytical sample includes physicians practicing in border counties between the treatment (NH, NY, and RI) and control (MA and VT) states.
Data Collection
We restricted our sample to physicians who had at least 50 new‐fill prescription claims for statins during the five‐year study period, with at least one new‐fill prescription claim each year.
Principal Findings
We found that the PPSA led to a 7% (p < 0.001) reduction in monthly new prescriptions of brand‐name statin over the study period, with little change in generic prescribing. The reduction in branded prescriptions was concentrated among physicians with the highest tercile of drug spending pre‐PPSA, with a decrease of 15% (p < 0.001) in new branded statin prescriptions. The decline was most prominent after mandated reporting of industry payments began before the payment data was published.
Conclusions
The PPSA may have achieved its intended effect of reducing branded prescriptions at least in the short run, particularly among physicians most likely to have engaged in excessive or low‐value prescribing of branded drugs.
Keywords: Affordable Care Act, disclosure, drug, industry payment, prescribing, Sunshine Act
What is known on this topic
Payments from pharmaceutical companies to physicians are highly prevalent and may represent conflicts of interest.
Prior state‐level legislations mandating disclosure of industry payments to physicians have led to decreases in prescribing of branded drugs, with mixed findings on generic drugs.
What this study adds
The nationwide Physician Payments Sunshine Act (PPSA) led to decreases in branded statin prescribing, with little change in generic statin prescribing.
The reduction in branded prescriptions was concentrated among physicians with the highest tercile of drug spending pre‐PPSA.
There was little change in risk compositions of patients receiving any statin drugs before and after the PPSA.
1. INTRODUCTION
Prescription medications comprise an estimated 17% of total health care spending in the United States. 1 The growth of prescription drug spending consistently outpaces the growth of aggregate health spending. Among contributing factors to the high prescription drug spending in the U.S. are rapidly increasing prices of brand‐name drugs and physicians' prescribing brand‐name drugs when low‐cost alternatives (such as generic equivalents) are available. 2 Physicians' prescription of generic versus brand‐name drugs can be determined by a number of factors, including physicians' beliefs and information about generic equivalence, 3 , 4 the state generic substitution policy, 5 patients' moral hazard behavior, 6 and the payments (to physicians) from the pharmaceutical industry. 7
Industry payments play an important role in determining physician drug prescription. In the U.S., the total dollar value of industry payments exceeded $43 billion between 2013 and 2018, and more than 80% of physicians reported having financial relationships with the industry. 8 , 9 These payments exist in various forms including fees for professional services (such as consulting and speaking bureaus), gifts, and meals. 8 , 9 , 10 , 11 Payments made to physicians, especially small payments such as meals and gifts, can be an important channel for the industry to build connections with physicians and deliver new information about drugs to physicians. 12 However, pharmaceutical companies may also exert undue influence on physicians through gifts and other financial exchanges, which may distort physician prescribing away from the best interests of patients and lead to suboptimal medical decision making including low‐value drug prescriptions. 10 , 13 Several studies suggest that industry payments may have led to biased advice of physicians in the form of over‐prescription of brand‐name drugs. 7 , 14 , 15
To address the potential conflict of interest faced by physicians related to the industry payments, the Center for Medicare and Medicaid Services (CMS) implemented the Physician Payments Sunshine Act (PPSA) as part of the Affordable Care Act. 16 PPSA requires medical product manufacturers including pharmaceutical companies to disclose to the CMS any payments made to physicians. CMS first released the federal proposed rule on PPSA in December 2011, with the final rule published in February 2013. Data collection on industry payments began in August 2013 and those data have been made publicly available annually since 2014. The PPSA represents the first systematic nationwide effort to publicly report the financial interactions between pharmaceutical companies and physicians. 17
In this study, we conducted one of the first evaluations of the impact of the PPSA on prescribing of branded drugs. We used 2011–2015 Health Care Cost Institute data and employed a difference‐in‐differences and event study design to study changes in statin prescriptions. Statins are a class of oral medications that lower cholesterol levels. They are widely prescribed for the prevention of adverse cardiovascular outcomes (such as myocardial infarction and stroke). 18 We focused on the statin drug class because it is not only widely prescribed, but also includes a mixture of branded and generic drugs, and has been associated with high levels of industry payments to providers. 11 , 19 Findings of the study are expected to inform the effectiveness of PPSA in curbing excessive prescribing of expensive brand‐name drugs and rapid growth in drug spending.
2. STUDY DATA AND METHODS
2.1. Data source
Our primary data source was the 2011–2015 Health Care Cost Institute (HCCI) data. HCCI data consist of medical and pharmacy claims from three national commercial insurers, Aetna, Humana, and UnitedHealthcare with plans covering 50 million individuals. The data contain detailed patient, physician, insurance plan, and claim‐level characteristics.
We used two supplementary data sources. First, we drew on data from the publicly available Area Health Resource File to identify county‐level characteristics to be merged with the HCCI data via the prescribing physician's practice zip code. Second, we used the publicly available U.S. Food & Drug Administration Approved Drug Database to determine the launch date for each of the drugs included in our study. This allows us to conduct sensitivity analyses excluding new brand‐name drugs which entered the market during 2011–2015, or brand‐name drugs with new generic entry during 2011–2015 (described further below).
2.2. Study design and sample
We employed a difference‐in‐differences (DD) study design that leverages control group physicians in the two states, Massachusetts (MA) and Vermont (VT), which previously implemented state‐specific legislations mandating public disclosure of payments from pharmaceutical companies to physicians prior to the PPSA. The key assumption underlying the validity of the DD design is that outcomes in the treated and control groups would have followed parallel trends in the absence of the treatment, and the baseline level differences in outcomes do not threaten the validity of the design so long as they remained constant (during the pre‐treatment period and in the absence of the treatment). 20 The choice of the control group relied on the assumption that the PPSA would not have affected drug prescribing in these two states to the same extent as in states without such disclosure legislation pre‐PPSA. This was supported by existing literature showing that the 2008 MA public disclosure law decreased average drug prescriptions, especially for brand‐name drugs. 21 Our treatment group consisted of physicians in three neighboring states of MA and VT: New York (NY), Rhode Island (RI), and New Hampshire (NH). We excluded Connecticut from our study as it experienced an unusually large increase in enrollees of commercial insurance during our study period as a result of the Affordable Care Act relative to all other states in the U.S., 22 which renders it less comparable to the control group.
To ensure further comparability between treatment and control groups, following prior literature, 21 we restricted our study sample to those physicians who practiced in the border counties between treatment and control states and remained in the same state throughout the study period (Figure S1 shows the map highlighting the border counties in our study sample). We further accounted for potential time‐varying confounding by dividing the border counties into three regions, with each region consisting of counties in both treated and control states, and controlling for region‐year‐month fixed effects in our DD specification (described further below). The regions were assigned based on borderlines between treated and control states, as the adjacent MA and VT states border NY on the west (Region 1), RI on the south (Region 2), and NH on the east (Region 3). Table S1 shows socioeconomic characteristics and health care resources of treated and control counties by region. They were broadly similar between treated and control countries in the same region.
We additionally required that physicians in our sample have at least 50 new‐fill prescription claims for statins during the five‐year study period, with at least one new‐fill prescription claim in each year. We focused on new‐fill as opposed to refilling prescriptions, as the former represents a deliberate prescribing decision on the part of the physician (or patient), the quantity of which was likely to change more immediately in response to the PPSA.
Table S2 contains the complete list of branded statins in our data, along with the market entry dates for branded and generic drugs when those dates fall into the study period. The list included branded combinations of statin with another medication (e.g., Advicor [lovastatin plus niacin] and Caduet [lovastatin plus amlodipine]). It also lists the total amount of industry payments associated with each branded drug during the study period. Not surprisingly, the largest payments were associated with branded statins without generic equivalents (e.g., Crestor, Vytorin, and Livalo). The table indicates a generic entry for three statin‐branded drugs (Caduet, Lescol, and Lipitor) that went off patent during the study period. Including these drugs in our sample could potentially introduce confounding from patent expiration and generic entry. We, therefore, excluded these three drugs from our main sample. For sensitivity analysis (described below), we included all statin‐branded drugs in Table S2. There was also no change in generics substitution policies in our sample states during the study period. These policies are shown in Table S3.
2.3. Measures and statistical analyses
Our DD design examined the differential change in monthly new branded‐statin prescriptions after PPSA between physicians in treated and control counties. We estimated the following primary specification:
| (1) |
where i indexes physicians, t indexes months (t ∈ {1,2, … 0.60}) and r indexes regions (r ∈ {West, South, East}). y is the outcome of interest, that is, logged number of monthly new‐fill prescription claims for branded statins. Following prior literature, 21 we added one to the raw number of claims before applying the logarithm transformation to handle the large number of zero claims (alternative Poisson count models yielded similar results). It is important to note that each physician included in our study sample contributes exactly 60 months, conditioning on meeting the inclusion criteria (≥50 new‐fill claims, and at least one new‐fill claim in each year of the study period) regardless of whether she had any relevant drug claim in that month. This is because any given month with zero claims is relevant information that needs to be incorporated in model estimation.
We captured the differential change in new‐fill branded statins in the treated versus control groups using coefficients on interactions between an indicator of treated states , and time period‐specific indicators , where p ∈ {1,2}. Since the PPSA was implemented in stages, we defined the pre‐treatment period and two post‐treatment periods as follows: (1) Pre‐treatment period: January 2011 to November 2011, or before the PPSA proposed rule; (2) Post‐treatment period 1: December 2011 to July 2013, or after the PPSA proposed rule and before payment data collection began; (3) Post‐treatment period 2: August 2013 and onwards, or after payment data reporting began. We defined the two post‐treatment periods based on the timing of the PPSA proposed rule and actual implementation of the PPSA final rule (when payment data reporting began), as it is conceivable that payment from pharmaceutical companies to physicians and/or physician prescribing behavior may have changed in response to the proposed rule in anticipation of the eventual implementation of the PPSA. Further, these changes may have intensified further after the PPSA came into effect, that is, after CMS began collecting payment data from drug companies. The two post‐treatment periods defined above allowed us to distinguish between these two periods and assess these potential staggered responses.
We controlled for η, a vector of physician fixed effects, and region‐year‐month fixed effects. The region‐by‐month fixed effects additionally control for all time‐specific factors common between treated and control counties within a region, and which may differ across regions. γ and δ are the coefficients of the time‐varying controls and region‐by‐month fixed effects, respectively. We also controlled for an extensive set of time‐varying physician and county characteristics X: monthly number of enrollees at the physician's practice zip code, demographic and insurance compositions of the patient panel the physician prescribed to in a given year (proportion female, proportion with Medicare Advantage, and proportions with Health Maintenance Organization [HMO], Preferred Provider Organization [PPO] or point‐of‐service [POS] plans), and year‐specific characteristics of the physician's practice county (percent population aged 65 and above, log median household income, percent population with private insurance, percent population with public insurance, and number of primary care physicians per 1000 population). Later, we show results with and without these controls. The error term is clustered at the physician level.
We conducted a few additional analyses to ensure the robustness of our study design and results. First, we plotted trends in branded statin prescriptions by state and by drug to rule out alternative causes for changes in branded prescriptions, such as insurer‐imposed state or drug‐specific changes in formularies or prior authorization requirements. Second, the validity of our DD design relies on the assumption of parallel trends, that is, there were no differential changes in prescriptions between treated and control group physicians prior to PPSA. We tested this assumption using an event study regression that was similar to Equation (1) but replaced the two DD interactions with interactions between the treatment indicator and an indicator for each year‐month in our study period. Third, to further ensure that the results are not sensitive to our study sample restricting to only physicians practicing in border counties, we included all physicians in the five states (MA, VT, NY, RI, and NH) and re‐estimated the DD model with propensity score matching. Specifically, we estimated the propensity score using logistic regression at the physician level with receiving treatment (being in NY, RI, or NH) as the dependent variable and the pre‐treatment period monthly number of new branded and generic statin prescriptions as the independent variables. We used the nearest‐neighbor matching procedure to select physicians in the control group that were observably similar to those in the treated group. 23 , 24 We used the DD design with the border‐county sample as our preferred study design because of known limitations with the propensity score matching approach used in DD analysis as it can fail to account for certain confounding factors. 23
We also conducted a number of supplementary analyses to better understand the mechanisms and implications of the impact of the PPSA. First, we conducted an analogous DD analysis using monthly generic statin prescriptions as a secondary outcome. Second, we examined potential heterogeneity in physician responses to the PPSA by stratifying physicians according to the tercile of their total adjusted drug spending in 2011 (before the implementation of PPSA). We expect the impact of the PPSA on branded statin prescriptions to be more concentrated among physicians with higher baseline drug spending. These physicians were probably prescribing higher volume and/or more expensive branded drugs than the average physician. Their prescribing of branded drugs was more likely viewed as excessive and could be more easily reduced. Third, we examined whether specific subsets of drugs could have impacted our estimates. Specifically, we constructed the same DD analysis on two alternative samples by (a) additionally excluding new branded statin drugs (Juvisync and Liptruzet), and (b) including all statin drugs in Table S2. Finally, to examine whether the PPSA may have induced physicians to prescribe statins to patients with a different risk profile, we conducted an analogous DD analysis at the physician‐year level with the aggregate risk of patients receiving statin drugs (branded or generic) in a given year from a given physician as the dependent variables. These included: the average Department of Health and Human Services‐Hierarchical Condition Categories risk score, 25 percentages of patients with cancer, heart failure, stroke, diabetes, and depression. The year 2011 was used as the pre‐treatment period, and Periods 1 and 2 included the years 2012–2013 and years 2014–2015, respectively.
3. RESULTS
3.1. Descriptive results
Our final analytic sample consists of 1249 physicians and 74,940 physician‐months (Table 1). The vast majority of physicians in the sample practiced in the East or South Region. On average, physicians in the treated group had more new‐fill prescriptions per month (for both branded and generic drugs) compared to those in the control group. Treated physicians had over four times as many branded statin claims per month on average (0.4) as those for control physicians (0.1). Some of these differences reflect the fact that the treated group had a larger patient base than the control group (3183 enrollees per zip code‐month in the treated group compared to 2038 in the control group). They became smaller after accounting for differences in enrollee populations: branded statin claims per 1000 enrollees per month were 0.1 in the treated group and 0.05 in the control group, a twofold difference. The treated‐control differences for generic claims were smaller in ratio terms (2.2 in the treated group and 1.3 in the control group, or less than a two‐fold difference), and the generic statin claims per 1000 enrollee per month were very similar: 0.69 in the treated group versus 0. 65 in the control group. The characteristics of patients receiving prescriptions from treated and control physicians were broadly similar. Patients of treated physicians were more likely to be Medicare Advantage enrollees or have HMO plans, relative to patients of control physicians.
TABLE 1.
Summary Statistics of the treated and control group
| Variable | Treated | Control |
|---|---|---|
| Prescription volume | ||
| Number of monthly branded prescriptions | 0.4 [0.8] | 0.1 [0.4] |
| Number of monthly generic prescriptions | 2.2 [2.8] | 1.3 [1.3] |
| Patient characteristics | ||
| Number of monthly enrollees in the physician's zip‐code | 3183.4 [1764.3] | 2037.8 [1135.6] |
| Annual number of patients receiving prescriptions | 30.7 [28.7] | 14.1 [7.0] |
| % female patients | 46.2 | 40.4 |
| % patients in Medicare Advantage | 42.0 | 29.3 |
| % patients in HMO plans | 19.6 | 9.1 |
| % patients in PPO plans | 22.9 | 20.9 |
| % patients in POS plans | 44.8 | 55.7 |
| County characteristics | ||
| West region (%) | 19.1 | 2.3 |
| East region (%) | 38.2 | 45.9 |
| South region (%) | 42.8 | 51.8 |
| County median household income | 63435.6 [11433.4] | 74258.2 [12452.9] |
| % county population age 65 and older | 13.9 | 14.1 |
| % county population with private insurance | 73.4 | 78.3 |
| % county population with public insurance | 28 | 30.4 |
| Number of primary care physicians per 1000 population | 8.8 [2.1] | 10.8 [2.7] |
| Number of physician‐months | 32,940 | 42,000 |
| Number of physicians | 549 | 700 |
Note: The treated group includes statin‐prescribing physicians practicing in counties in NY, NH, and RI that border either MA or VT. The control group includes statin‐prescribing physicians practicing in counties in MA and VT that border with either NY, NH, or RI. Each physician contributes 60 months or five years. Variable means are reported, with standard deviations of continuous variables in brackets. Means and standard deviations are across all physician‐months in each group. All prescriptions analyzed are new‐fill. Characteristics of patients other than a number of enrollees vary at the physician‐year level and are characteristics of patients receiving any new‐fill statin prescription from that physician in a given year. County characteristics are those of the physician's practicing county. Counties were assigned to three regions, and the percentages reported are the percentage of all physician‐months observations in the treated or control group that belong to a given region. County income, population, and primary care physicians’ characteristics vary by year.
Figure 1 plots the number of branded statin drug claims for physicians in treated and control counties. They showed largely parallel trends between the treated and control group in 2011, prior to the PPSA proposed rule. By contrast, the branded statin claims declined somewhat more in treated counties after 2011 than in control counties as the Proposed Rule was announced, though it appeared to bounce back up after the announcement of the Final Rule (which postponed the implementation of the reporting period). The sharpest decline in the number of drug claims in the treated group relative to the control occurred during the beginning of payment data reporting. It was then stabilized by 2015. The decline in branded prescriptions after the PPSA mandated reporting was observed in all three treated states (NH, NY, and RI), albeit the trends were nosier (Figure S2). Similar patterns were also observed for each drug or drug group (Figure S3). These patterns provide further support that the decline in branded statin prescriptions in the treated relative to the control group observed in Figure 1 was not unique to a single state or a drug, and may be attributed to broader changes brought about by the PPSA.
FIGURE 1.
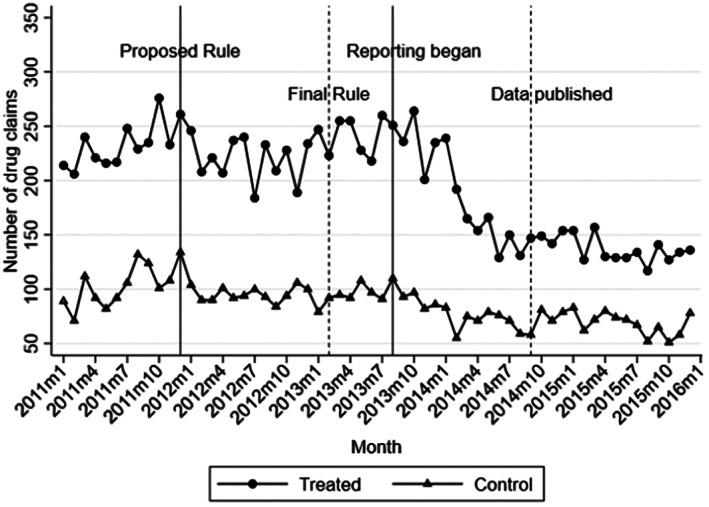
Number of branded statin prescriptions overtime. Monthly number of total new‐fill branded statins prescription claims from all physicians in the treated and control groups. The treated group includes physicians practicing in counties of NH, NY, and RI that border MA or VT. The control group includes physicians practicing in counties of MA and VT that border NH, NY, or RI.
3.2. Difference‐in‐differences estimations
Table 2 presents our main DD regression results in terms of percentage changes in the number of claims during a specific post‐treatment period compared to the pre‐treatment period. The left two columns showed DD regression results for all physicians with and without controlling for time‐varying county and patient characteristics. Results appeared highly stable with or without time‐varying controls. We used the formula (exp[β] − 1) × 100% that converts the coefficient from our log‐linear regression models (β) to percentage changes. In the specification with full controls, during post‐treatment period 1 (Period 1), or the period after the PPSA proposed rule and before payment data collection began, new‐fill prescription claims for branded statins declined by 2.2% (p = 0.015), while the average decrease in post‐treatment period 2 (Period 2) (after data collection began) was 7.3% (p < 0.001). By contrast, analogous results for generic statin prescriptions were statistically insignificant after including the time‐varying controls (Table S3). Propensity‐score matched DD estimates including all statin prescribing physicians from the five states yielded very similar results (Table S4).
TABLE 2.
Impact of the PPSA on log branded statin prescriptions, all and by tertile of drug spending in 2011
| All | By tercile of drug spending in 2011 | ||||
|---|---|---|---|---|---|
| (1) | (2) | (3) | (4) | (5) | |
| Treat × Period 1 | −0.011 (0.009) | −0.022** (0.009) | −0.002 (0.013) | 0.006 (0.014) | −0.036* (0.019) |
| Treat × Period 2 | −0.072**** (0.012) | −0.076**** (0.013) | −0.011 (0.015) | 0.006 (0.018) | −0.157**** (0.025) |
| Time‐varying patient and county controls | No | Yes | Yes | Yes | Yes |
| Mean of Dep Var | 0.14 | 0.14 | 0.08 | 0.12 | 0.22 |
| Observations | 74,940 | 73,920 | 24,360 | 24,660 | 24,900 |
Note: Difference‐in‐differences coefficients are reported, estimated from Equation 1 on statin prescribing physicians practicing in border counties between treated and control states. Each observation is a physician‐month. The dependent variable is the log number of new‐fill branded statin prescriptions. Standard errors in parenthesis clustered by a physician. Period 1 includes December 2011 to July 2013, the period from the release of the PPSA proposed rule to the month before payment data collection began. Period 2 includes August 2013 to December 2015, the period after data collection began. The omitted period is from January 2011 to November 2011. All regressions controlled for physician and region‐by‐year‐month fixed effects. Columns (2)–(5) additionally control for the monthly number of enrollees in the physician's zip code, percentage of patients receiving prescriptions from the physician in a given year who were female, in Medicare Advantage, with mental health coverage, in HMO, PPO, and POS plans, and all county‐year level characteristics in Table 1. *p < 0.1, **p < 0.05, ***p < 0.01, ****p < 0.001.
Columns (3)–(5) in Table 2 show DD results stratified by tertile of physicians' total adjusted drug spending in 2011. Physicians in the highest tertile of drug spending in 2011 had the largest decrease in branded drug claims attributable to the PPSA: a decrease of about 15% during Period 2 (p < 0.001). Physicians in the middle and lowest tertile of Pre‐PPSA drug spending had small and insignificant changes in their branded statin prescriptions.
The results after excluding new branded drugs (Column 1 of Table S4) are very similar to our main results in Table 2, suggesting that reductions in branded statin prescriptions were not driven by reductions in drugs that newly came on the market. The results including all drugs (Column 2 of Table S4) remain highly significant and are quantitatively larger than the main results shown in Table 2, suggesting that prescriptions for branded drugs with new generic entry decreased more in the treated group relative to the control after the PPSA. However, this estimate could overestimate the true impact of the PPSA, potentially consistent with an upward bias introduced by the entry of generic drugs.
3.3. Event study
The results from the event study appeared to lend support to the parallel trends assumption underlying the DD design (Figure 2). There was no evidence of an obvious trend during our pre‐treatment period preceding the PPSA proposed rule. Consistent with the DD regression results in Table 2, branded statins experienced the largest decline after payment data reporting began in 2013. By August 2014, the month before payment data was published, prescriptions were 10.9% (p < 0.001) lower compared to those in November 2011 among the treated group relative to the control.
FIGURE 2.
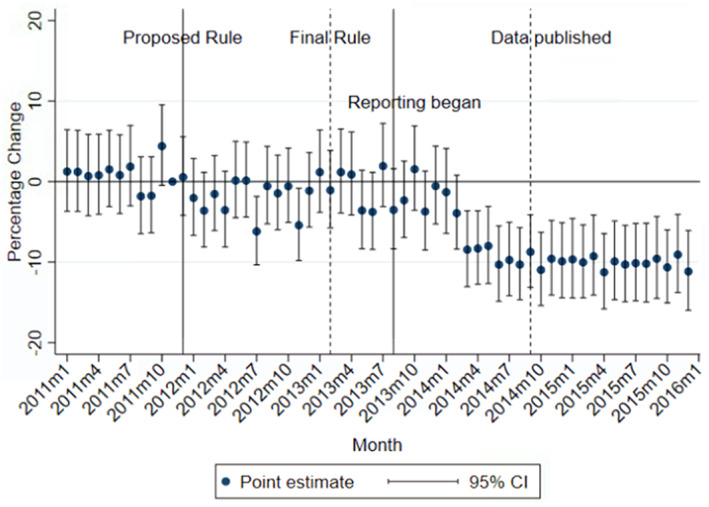
Monthly adjusted changes in branded statin prescriptions among the treated relative to the control group. Percentage changes in the monthly number of new‐fill prescriptions from treated relative to control physicians and their 95% CIs are presented. Converted using the formula (exp[β] − 1) × 100%, where β is an estimated coefficient (or its confidence interval bounds) on the interaction between the indicator for the treated group and the indicator for a specific year‐month in the event study regression. The treated group includes physicians practicing in counties of NH, NY, and RI that border MA or VT. The control group includes physicians practicing in counties of MA and VT that border NH, NY, or RI. The omitted month is November 2011, the month before the release of the PPSA proposed rule. The event study regression additionally controlled for physician fixed effects, region‐by‐year‐month fixed effects, and all patient and county characteristics in Table 1. [Color figure can be viewed at wileyonlinelibrary.com]
3.4. Risk of patients receiving statins
Table S7 shows DD results with aggregated risk characteristics of patients receiving any statins as the dependent variables. The DD coefficients were almost all small and insignificant, suggesting little change in the risk composition of patients receiving statins before and after the PPSA.
4. DISCUSSION
In this study, we examined the impact of the first national policy disclosing payments from the industry to providers on physician prescribing. Using a DD design leveraging as the control group physicians in states with existing legislations similar to the PPSA, we found that the PPSA led to an approximately 7% decrease in the number of new‐fill branded statin prescriptions. The effect emerged shortly after the proposed rule, then intensified after data reporting began. The impact of the PPSA was the largest among physicians with the highest pre‐PPSA statin spending. In addition, we found that the PPSA had little effect on generic statin prescriptions. Neither did we find that the PPSA changed the risk composition of patients receiving statins. To our knowledge, ours is the first study that evaluated the impact of the PPSA on branded drug prescribing.
Given that branded statin drugs were more expensive and industry payments had been shown to influence their prescribing, decreases in branded statin prescribing as a result of the PPSA could be consistent with a decrease in unnecessary or low‐value prescribing. Our estimates are broadly on par with those in prior studies estimating the impact of the MA disclosure legislation: Guo et al. 21 estimated an 11% decrease in branded statin prescribing, and Larkin and Chao found that the MA Sunshine law led to a reduction of 6.4% in branded prescribing across nine drug types including statin. 26 Additionally, the null effect on generic prescriptions suggests that PPSA did not impact the potentially cost‐effective prescribing of statin drugs. On the other hand, it also suggests that physicians may not have engaged in substitution between branded and generic statin prescriptions, but rather reduced prescribing of statin drugs overall. We return to this point below when discussing their implications on patient outcomes.
Our study also provides suggestive evidence on potential mechanisms underlying the impacts of the PPSA. The PPSA may influence prescribing via the following possible mechanisms. First, patients may respond to information disclosed by the PPSA by switching to providers with lower or no industry payments, who may prescribe more conservatively, or by actively demanding generic drugs. Second, Conflict of Interest disclosure may prompt drug companies to reduce payments to physicians or render physicians less willing to accept these payments. Reduced exposure to industry payments might then reduce any undesirable effects of such payment on prescribing especially of branded drugs. 27 , 28 , 29 Third, physicians may not obtain the most up‐to‐date information on drug efficacy and quality if the PPSA decreases physician contact with the pharmaceutical companies, affecting prescribing of the newest drugs. Fourth, regardless of their financial relationship with the drug companies, physicians may reduce prescribing of branded drugs for reasons other than reduced financial payments, such as an enhanced awareness of the need to curb unnecessary prescribing and contain drug spending. 21 , 26
We first rule out a patient response as the main driver of the observed changes in prescribing. Our event study results revealed little change in branded statin prescriptions after the online disclosure of the payment data. This suggests that patients were not responding to the publicized payment information. Decreased access to information on newly marketed drugs is also less likely as a mechanism, since excluding new branded drugs has little impact on our estimates. Since providers are likely to be less familiar with the newest drugs, reduced access to information would be expected to have the greatest impact on prescribing those medications, but this effect was not observed.
We cannot rule out the mechanism involving reduced exposure to industry payments as we could not observe the industry payment to each physician before the PPSA. It is also possible that physicians reduced branded statin prescribing out of concerns for maintaining reputation or prescribing efficiency. Even before it was officially implemented, the PPSA in the form of a proposed rule may be seen as providing signaling information regarding the prevalence and severity of the influence of the pharmaceutical industry in distorting physician prescribing. The legislation also provided more information to physicians regarding the direct linkage between their prescribing behavior and rising health care costs. 16 , 30 Physicians (and their organizations) may have responded to this signal by engaging in enhanced self‐monitoring and more conservative prescribing.
The fact that the largest reductions in branded drugs occurred among physicians in the highest tercile of drug spending pre‐PPSA is also potentially consistent with this mechanism: physicians with a high level of pre‐PPSA drug spending (“heavy prescribers”) may have been more likely to engage in excessive or low‐value prescribing, or be perceived as such. It is noteworthy that they also had the largest average amount of financial payments from pharmaceutical companies post‐PPSA: $3730 per person ($5085 among the treated group) compared to $1502 per person among those in the lower tertiles of drug spending. This suggests that financial payments were still substantial even among the subgroup of physicians experiencing the largest reductions in branded statin prescribing.
Finally, the fact that we found little change in risk composition of patients receiving any statins before and after the PPSA, along with the finding that the PPSA decreased branded statin prescribing but did not change generic statin prescribing, means we could not rule out that the legislation has potentially led to underuse of statin drugs. The reason is that if physicians stopped prescribing statins only to patients who were healthier and may benefit less from the drugs, we would have expected to see a higher risk among patients receiving statins after the PPSA. However, it is still possible that physicians chose to stop prescribing statins to patients who differed in risk profiles not captured in our analysis.
Our study has several limitations. First, to the extent that the PPSA exerted any further impact on physician prescribing in MA and VT beyond the prior state laws, our results may underestimate the true impact of the PPSA. Second, prescription claims data does not capture prescriptions that patients never fill or they purchase out of pocket. However, this limitation is not expected to vary differently over time across the geographic regions examined in this study. Using prescription claims is standard in pharmacoepidemiology studies and is considered more accurate than relying on electronic prescriptions. Third, we were unable to explain drug prescriptions for patients covered by other commercial insurers not included in HCCI data, Medicare fee‐for‐service, or Medicaid program due to data limitations. Finally, our estimates may not be generalizable to physicians practicing in states outside of the five included in our analyses.
Overall, we found that PPSA achieved its intended effect of reducing branded prescriptions at least in the short run. Our findings support extending the disclosure policy to non‐physician providers with prescribing authority who may also be subject to industry influence. 18 , 31 One caveat is the law's potential impact on patient outcomes. It is possible that the PPSA may prompt physicians to prescribe overly conservatively and stop prescribing to patients altogether who could otherwise benefit from taking the drugs. An assessment of the long‐run impact of the PPSA on patient outcomes and hence the value of prescribing is an important topic for future research.
Supporting information
Appendix S1 Supporting information.
ACKNOWLEDGMENTS
This study was supported by the Agency for Health Research and Quality (Grant No. R03HS027001) and the National Institute on Aging of the National Institutes of Health (Grant No. K01AG066946). The funders had no role in the design and conduct of the study; collection, management, analysis, and interpretation of the data; preparation, review, or approval of the manuscript; and decision to submit the manuscript for publication.
Li J, Wu B, Flory J, Jung J. Impact of the Affordable Care Act's Physician Payments Sunshine Act on branded statin prescribing. Health Serv Res. 2022;57(5):1145‐1153. doi: 10.1111/1475-6773.14024
Funding information Agency for Healthcare Research and Quality, Grant/Award Number: R03HS027001; National Institute on Aging, Grant/Award Number: K01AG066946
REFERENCES
- 1. ASPE , Observations on Trends in Prescription Drug Spending. 2016.
- 2. Kesselheim AS, Avorn J, Sarpatwari A. The high cost of prescription drugs in the United States: origins and prospects for reform. JAMA. 2016;316(8):858‐871. [DOI] [PubMed] [Google Scholar]
- 3. Bearden WO, Mason JB. Determinants of physician and pharmacist support of generic drugs. J Consum Res. 1980;7(2):121‐130. [Google Scholar]
- 4. Nightingale SL, Morrison JC. Generic drugs and the prescribing physician. JAMA. 1987;258(9):1200‐1204. [PubMed] [Google Scholar]
- 5. Shrank WH, Choudhry NK, Agnew‐Blais J, et al. State generic substitution laws can lower drug outlays under Medicaid. Health Aff. 2010;29(7):1383‐1390. [DOI] [PMC free article] [PubMed] [Google Scholar]
- 6. Lundin D. Moral hazard in physician prescription behavior. J Health Econ. 2000;19(5):639‐662. [DOI] [PubMed] [Google Scholar]
- 7. Carey C, Lieber EM, Miller S. Drug firms' payments and physicians' prescribing behavior in Medicare Part D. J Publ Econ. 2021;197:104402. [Google Scholar]
- 8. Campbell EG, Gruen RL, Mountford J, Miller LG, Cleary PD, Blumenthal D. A national survey of physician–industry relationships. New England J Med. 2007;356(17):1742‐1750. [DOI] [PubMed] [Google Scholar]
- 9. Campbell EG, Rao SR, DesRoches C, et al. Physician professionalism and changes in physician‐industry relationships from 2004 to 2009. Arch Intern Med. 2010;170(20):1820‐1826. [DOI] [PubMed] [Google Scholar]
- 10. Dana J, Loewenstein G. A social science perspective on gifts to physicians from industry. JAMA. 2003;290(2):252‐255. [DOI] [PubMed] [Google Scholar]
- 11. Larkin I, Ang D, Steinhart J, et al. Association between academic medical center pharmaceutical detailing policies and physician prescribing. JAMA. 2017;317(17):1785‐1795. [DOI] [PMC free article] [PubMed] [Google Scholar]
- 12. LaMattina, J. , A medical leader steps up to defend biopharma: Tom Stossel's “Pharmaphobia.”. Forbes, 2016. https://www.forbes.com/sites/johnlamattina/2016/01/19/a-medical-leader-steps-up-to-defend-biopharma-tom-stossels-pharmaphobia/#4c32f18e3e5a.
- 13. Fugh‐Berman A, Ahari S. Following the script: how drug reps make friends and influence doctors. PLoS Med. 2007;4(4):e150. [DOI] [PMC free article] [PubMed] [Google Scholar]
- 14. DeJong C, Aguilar T, Tseng CW, Lin GA, Boscardin WJ, Dudley RA. Pharmaceutical industry–sponsored meals and physician prescribing patterns for Medicare beneficiaries. JAMA Intern Med. 2016;176(8):1114‐1122. [DOI] [PubMed] [Google Scholar]
- 15. Yeh JS, Franklin JM, Avorn J, Landon J, Kesselheim AS. Association of industry payments to physicians with the prescribing of brand‐name statins in Massachusetts. JAMA Intern Med. 2016;176(6):763‐768. [DOI] [PubMed] [Google Scholar]
- 16. Centers for Medicare Medicaid Services . Medicare, Medicaid, Children's Health Insurance Programs; transparency reports and reporting of physician ownership or investment interests. Final rule. Fed Regist. 2013;78(27):9457‐9528. [PubMed] [Google Scholar]
- 17. Santhakumar S, Adashi EY. The Physician Payment Sunshine Act: testing the value of transparency. JAMA. 2015;313(1):23‐24. [DOI] [PubMed] [Google Scholar]
- 18. Grundy SM, Stone NJ, Bailey AL, et al. Guideline on the management of blood cholesterol: a report of the American College of Cardiology/American heart association Task force on clinical practice guidelines. J Am Coll Cardiol. 2018;73(24):e285‐e350. [DOI] [PubMed] [Google Scholar]
- 19. Johansen ME, Richardson C. Estimation of potential savings through therapeutic substitution. JAMA Intern Med. 2016;176(6):769‐775. [DOI] [PubMed] [Google Scholar]
- 20. Dimick JB, Ryan AM. Methods for evaluating changes in health care policy: the difference‐in‐differences approach. JAMA. 2014;312(22):2401‐2402. [DOI] [PubMed] [Google Scholar]
- 21. Guo T, Sriram S, Manchanda P. “Let the Sunshine In”: The impact of industry payment disclosure on physician prescription behavior. Market Sci. 2020;39:516‐539. [Google Scholar]
- 22. Becker, A.L. , Connecticut is only state enrolling more in private insurance than Medicaid under Obamacare. https://ctmirror.org/2013/11/12/connecticut-only-state-enrolling-more-private-insurance-medicaid-under-obamacare/, 2013.
- 23. Lindner S, McConnell KJ. Difference‐in‐differences and matching on outcomes: a tale of two unobservables. Health Serv Outcomes Res Methodol. 2019;19(2):127‐144. [Google Scholar]
- 24. Ryan AM, Burgess JF Jr, Dimick JB. Why we should not be indifferent to specification choices for difference‐in‐differences. Health Serv Res. 2015;50(4):1211‐1235. [DOI] [PMC free article] [PubMed] [Google Scholar]
- 25. Kautter J, Pope G, Freeman S, Patterson L, Cohen M, Keenan P. The HHS‐HCC risk adjustment model for individual and small group markets under the Affordable Care Act. Medicare Medicaid Res Rev. 2014;4(3):E1‐E46. [DOI] [PMC free article] [PubMed] [Google Scholar]
- 26. Chao M, Larkin I. Regulating conflicts of interest through public disclosure: Evidence from a physician payments sunshine law. Manag Sci. 2022;68(2):1078‐1094. [Google Scholar]
- 27. Chen DL, Levonyan V, Reinhart SE, Taksler G. Mandatory disclosure: Theory and evidence from industry‐physician relationships. J Legal Stud. 2019;48(2):409‐440. [Google Scholar]
- 28. Inderst R, Ottaviani M. Competition through commissions and kickbacks. Am Econ Rev. 2012;102(2):780‐809. [Google Scholar]
- 29. Sah S. Conflict of interest disclosure as a reminder of professional norms: Clients first! Organ Behav Hum Decis Process. 2019;154:62‐79. [Google Scholar]
- 30. Centers for Medicare Medicaid Services . Medicare, Medicaid, Children's Health Insurance Programs; transparency reports and reporting of physician ownership or investment interests. Proposed Rule. Fed Regist. 2011;76:82129‐82131. [PubMed] [Google Scholar]
- 31. Karanges EA, Grundy Q, Bero L. Understanding the nature and extent of pharmaceutical industry payments to nonphysician clinicians. JAMA Intern Med. 2019;179(10):1430‐1432. [DOI] [PMC free article] [PubMed] [Google Scholar]
Associated Data
This section collects any data citations, data availability statements, or supplementary materials included in this article.
Supplementary Materials
Appendix S1 Supporting information.