

Abstract
The most common nonstandard nucleotides found in genomic DNA are ribonucleotides. Although ribonucleotides are frequently incorporated into DNA by replicative DNA polymerases, very little is known about the distribution and signatures of ribonucleotides incorporated into DNA. Recent advances in high-throughput ribonucleotide sequencing can capture the exact locations of ribonucleotides in genomic DNA. Ribose-Map is a user-friendly, standardized bioinformatics toolkit for the comprehensive analysis of ribonucleotide sequencing experiments. It allows researchers to map the locations of ribonucleotides in DNA to single-nucleotide resolution and identify biological signatures of ribonucleotide incorporation. In addition, it can be applied to data generated using any currently available high-throughput ribonucleotide sequencing technique, thus standardizing the analysis of ribonucleotide sequencing experiments and allowing direct comparisons of results. This protocol describes in detail how to use Ribose-Map to analyze ribonucleotide sequencing data, including preparing the reads for analysis, locating the genomic coordinates of ribonucleotides, exploring the genome-wide distribution of ribonucleotides, determining the nucleotide sequence context of ribonucleotides and identifying hotspots of ribonucleotide incorporation. Ribose-Map does not require background knowledge of ribonucleotide sequencing analysis and assumes only basic command-line skills. The protocol requires less than 3 h of computing time for most datasets and ~30 min of hands-on time. Ribose-Map is available at https://github.com/agombolay/ribose-map.
Introduction
High-throughput sequencing techniques have been developed recently to capture the locations of the most abundant type of noncanonical nucleotides in the genome, ribonucleoside monophosphates (rNMPs). These sequencing techniques include ribose-seq1 (captures the embedded rNMP from its 3′ end), emRiboSeq2 (captures the deoxyribonucleotide upstream of the embedded rNMP from the 5′ side), RHII-HydEn-seq3 (captures the embedded rNMP from its 5′ side), Alk-HydEn-seq4 (captures the deoxyribonucleotide downstream of the embedded rNMP from the 3′ side) and Pu-seq5 (captures the deoxyribonucleotide downstream of the embedded rNMP from the 3′ side). Each of these rNMP sequencing techniques can capture potentially millions of rNMPs embedded in the genome of a population of cells, generating large, complex datasets requiring software that can accurately and efficiently transform raw sequencing data into biologically meaningful results. In addition, such software should be able to accommodate data generated from any currently available high-throughput rNMP sequencing technique to standardize the analysis of rNMP sequencing experiments. Such standardization would facilitate direct comparisons of results obtained using different rNMP sequencing techniques to assess their reproducibility. The analysis pipeline for rNMP sequencing data can be divided into three main tasks: (i) alignment of sequencing reads to the reference genome, (ii) mapping the genomic coordinates of rNMPs and (iii) identifying biological signatures of rNMP incorporation. To accurately and efficiently accomplish these tasks for any type of rNMP sequencing data, we developed the Ribose-Map bioinformatics toolkit6, which includes the Alignment, Coordinate, Sequence, Distribution, and now also the Composition and Hotspot modules. The Alignment module aligns the data to the reference genome, and then the Coordinate module uses the alignment results to map the single-nucleotide genomic coordinates of rNMPs based on the rNMP sequencing technique used. Collectively, the Composition, Sequence, Distribution and Hotspot modules identify biological signatures of rNMP incorporation. In particular, the Composition module determines the rNMP composition (i.e., frequencies of r[A, C, G, U]MP normalized to those of the reference genome), the Sequence module determines the nucleotide sequence context of rNMPs, the Distribution module assesses the genome-wide distribution of rNMPs and the Hotspot module identifies genomic sites that are enriched for rNMP incorporation and their consensus sequence.
Ribose-Map is a proven technique that we previously applied to characterize the biological signatures of rNMP incorporation in rNMP sequencing libraries of different strains, genotypes and species of yeast prepared using two markedly different rNMP sequencing techniques, i.e., ribose-seq and emRiboSeq7. Here we outline a detailed protocol for Ribose-Map and demonstrate how to use each of its modules to analyze yeast rNMP sequencing data generated using ribose-seq and emRiboSeq. The steps outlined in this protocol could be easily adapted to analyze rNMP sequencing data derived from any organism with a sequenced reference genome and generated using any currently available rNMP sequencing technique. Ribose-Map is fully documented and actively maintained by the developers at https://github.com/agombolay/ribose-map. By following this protocol, researchers can gain insight into the biological mechanisms that regulate the presence of rNMPs in DNA and their effects on genome stability, DNA metabolism and disease.
Applications of Ribose-Map
Researchers can use Ribose-Map to study the biological signatures of rNMP incorporation in any genome of interest provided a reference genome is available. To standardize the analysis of rNMP sequencing data and facilitate comparisons of results among different rNMP sequencing experiments, Ribose-Map allows researchers to analyze any type of rNMP sequencing data regardless of the rNMP sequencing technique used. In addition to rNMPs, Ribose-Map can also be used to study the biological signatures of any single-nucleotide genomic coordinates of interest, such as single-nucleotide polymorphisms. To perform such an analysis, the user should bypass the Alignment and Coordinate modules of Ribose-Map and directly input a browser extensible data (BED) file containing the coordinates of interest into the Composition, Sequence, Distribution and/or Hotspot modules.
Comparison of Ribose-Map with related methods
Ribose-Map is currently the only available rNMP mapping computational toolkit that can process and analyze rNMP sequencing data generated using any currently available rNMP sequencing technique. In contrast to Ribose-Map, the computational methods applied in previously published rNMP sequencing studies are customized to analyze rNMP sequencing data generated using only the rNMP sequencing technique applied in that particular study, and thus are not standardized. In addition, these current computational methods depend on proprietary software, do not output the genomic coordinates of rNMP sites, do not produce visualizations of the data, and/or are limited in scope. In contrast, Ribose-Map processes and analyzes rNMP sequencing data for any currently available rNMP sequencing technique, outputs the genomic coordinates of rNMPs, depends upon only open-source software, and produces summary datasets and visualizations for the nucleotide composition, DNA sequence context, genome-wide distribution and hotspots of rNMPs. Ribose-Map also generates well-formatted output files (e.g., BED/BedGraph) containing the genomic coordinates of rNMPs that can be directly input into other commonly used bioinformatics software, such as JBrowse8, UCSC genome browser9 and Bedtools10.
Experimental design
The Ribose-Map bioinformatics toolkit consists of six analytical modules that collectively align rNMP sequencing data to the reference genome, calculate the single-nucleotide genomic coordinates of rNMPs and uncover biological signatures of rNMP incorporation in the genome of interest. Figure 1 shows the input/output of the six modules of Ribose-Map.
Fig. 1 |. Input/output of Ribose-Map’s modules.
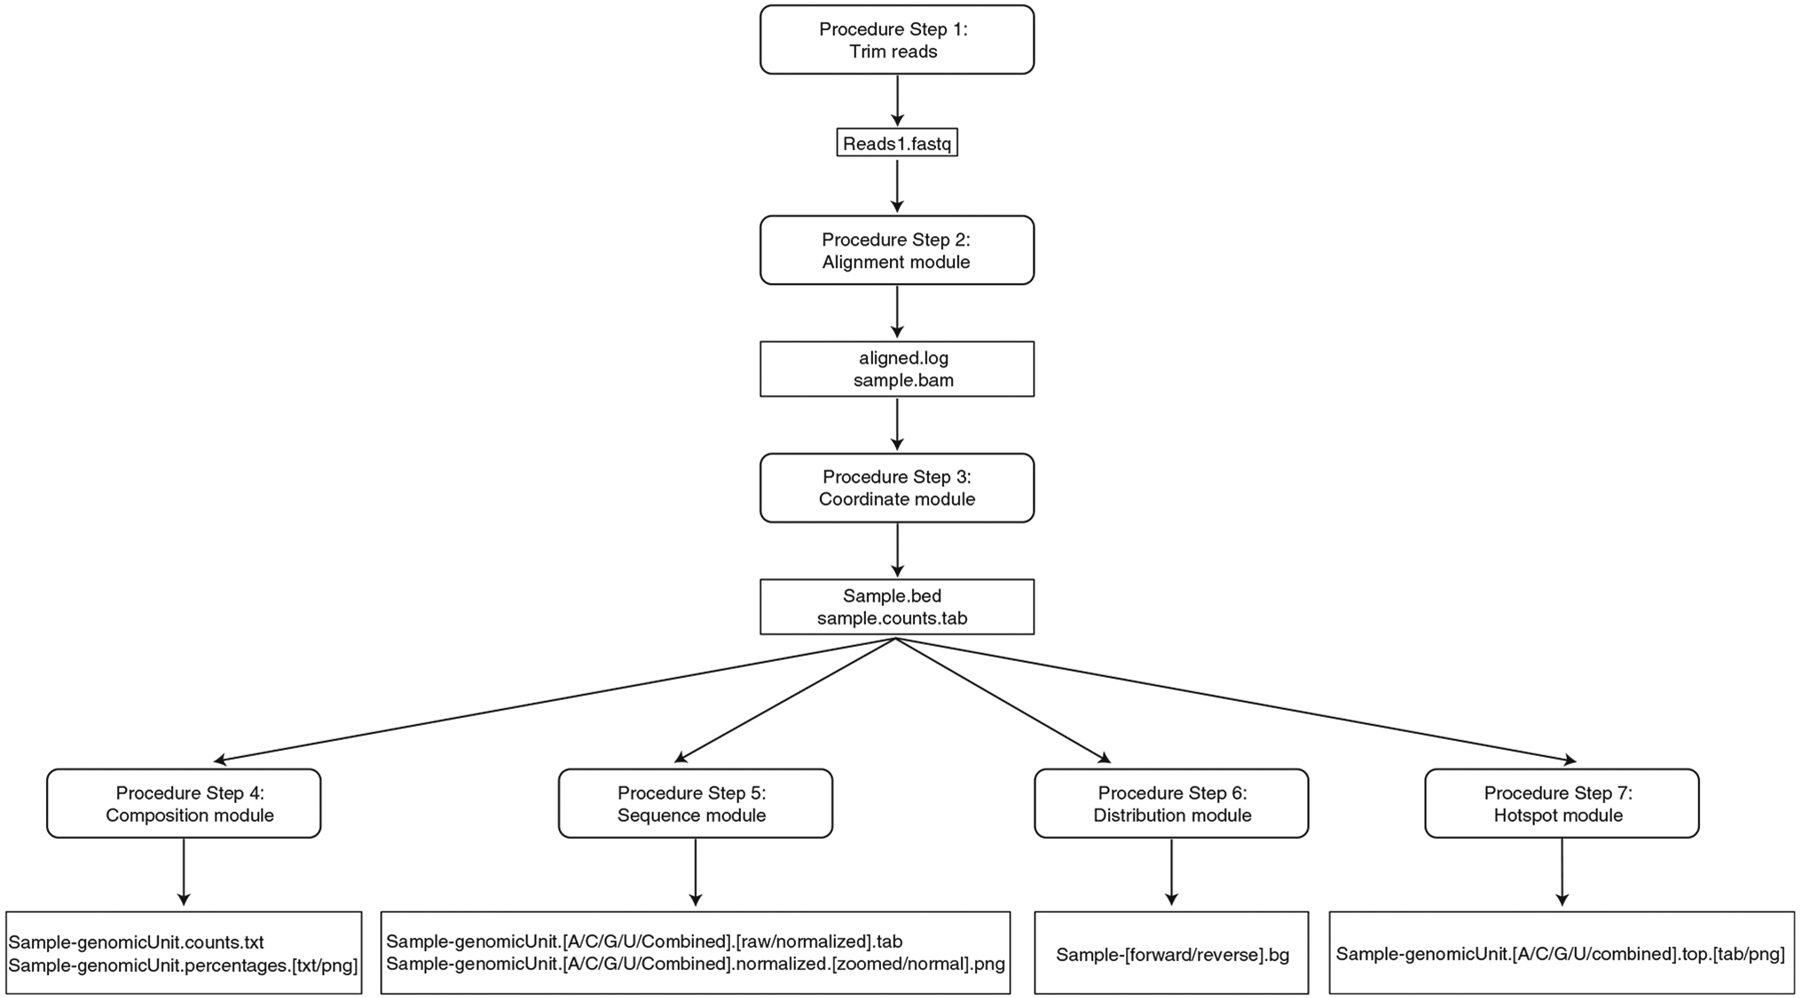
Ribose-Map transforms raw reads into publication-ready visualizations of results through a series of six modules.
Read alignment with Alignment Module
Analysis of rNMP sequencing data begins by aligning reads to the corresponding reference genome to locate their genomic positions. Ribose-Map’s Alignment module aligns single- or paired-end sequencing reads to the reference genome using Bowtie 2. The Alignment module also processes reads for unique molecular identifiers (UMIs) and molecular barcodes using UMI-tools11 and seqtk (https://github.com/lh3/seqtk), respectively. If PCR was used during library preparation, a UMI is critical to remove PCR duplicates from the data. In addition, a molecular barcode is helpful to separate real data from artifacts. If necessary, the reads should be processed with Cutadapt12 or similar data cleaning software to trim low-quality base calls and sequencing adapters prior to alignment. However, since rNMPs are tagged relative to the 5′ end of the sequencing read, this end should not be trimmed; otherwise, the Coordinate module would incorrectly calculate the genomic coordinates of the rNMPs.
During alignment, Bowtie 2 searches for multiple alignments and reports the best one by default. If reads align to more than one location equally well, Bowtie 2 uses a pseudo-random number to choose one. To allow the user to assess the level of multi-mapping in their dataset, the Alignment module outputs a file (‘alignment.log’) containing alignment statistics, including the percentage of multi-mapping reads. To allow flexibility for different rNMP sequencing datasets, the Alignment module allows the user to specify thresholds for mismatches allowed by Bowtie 2 in the configuration file (see ‘Equipment setup’). It is important to note that alignment of rNMP sequencing reads generated using any currently available rNMP sequencing technique should be done using Bowtie 2’s default ‘end-to-end’ alignment mode rather than ‘local’ alignment mode. During ‘local’ alignment mode, the nucleotides from one or both ends of the reads might be trimmed (or ‘soft-clipped’) to maximize alignment scores. Since the 5′ end of the read should not be trimmed as previously mentioned, the Alignment module uses Bowtie 2’s ‘end-to-end’ mode to align the reads to the reference genome. It is also important to note that Bowtie 2 does not directly allow thresholds for insertions and deletions. Instead, the user may convert the binary alignment map (BAM) file output by the Alignment module into a sequence alignment map (SAM) file and examine the compact idiosyncratic gapped alignment report (CIGAR) string to assess the number(s) of insertions and deletions (https://samtools.github.io/).
Locating rNMPs with the Coordinate module
During rNMP sequencing library preparation, rNMPs are tagged relative to the 5′ end of the sequencing read (read 1 if paired-end). Figure 2 compares the rNMP position relative to the 5′ end of the sequencing read for ribose-seq, emRiboSeq, RHII-HydEn-seq, Alk-HydEn-seq and Pu-seq data. To calculate the genomic coordinates of rNMPs, the Coordinate module converts the BAM file containing the aligned positions of sequencing reads output by the Alignment module into a BED file containing the zero-based start/end positions of the aligned reads using BEDTools. Then, the Coordinate module uses the threshold for alignment quality specified in the configuration file to select reads that meet or exceed that threshold. Next, the Coordinate module uses customized shell commands to calculate the single-nucleotide genomic coordinates of rNMPs relative to the 5′ positions of the sequencing read for the rNMP sequencing technique specified in the configuration file. Table 1 presents the genomic arithmetic used to calculate the genomic coordinates of rNMPs for ribose-seq, emRiboSeq, RHII-HydEn-seq, Alk-HydEn-seq and Pu-seq data. Each read generated from rNMP sequencing experiments (after deduplication if a UMI is used) represents a unique rNMP at a particular coordinate in the genome of a particular cell in the population, and thus the 5′ ends of all aligned reads (even coordinates with a read count of 1) represent valid sites of rNMP incorporation and should be retained for analysis. For example, an rAMP may be present at a particular coordinate in the genome of just one cell in the population, while an rGMP may be present at that particular coordinate in another cell in the population. Although unlikely, contamination or inefficiencies during library preparation could result in sequencing reads that align to the 5′-most ends of chromosomes, resulting in rNMP coordinates that are located beyond the chromosome ends and thus biologically meaningless. Therefore, once the genomic coordinates of rNMPs have been calculated, the Coordinate module checks if the coordinates are located within the bounds of the corresponding chromosome and removes any meaningless coordinates to prevent computational issues during downstream analyses.
Fig. 2 |. rNMP position in sequencing reads for each rNMP sequencing technique.
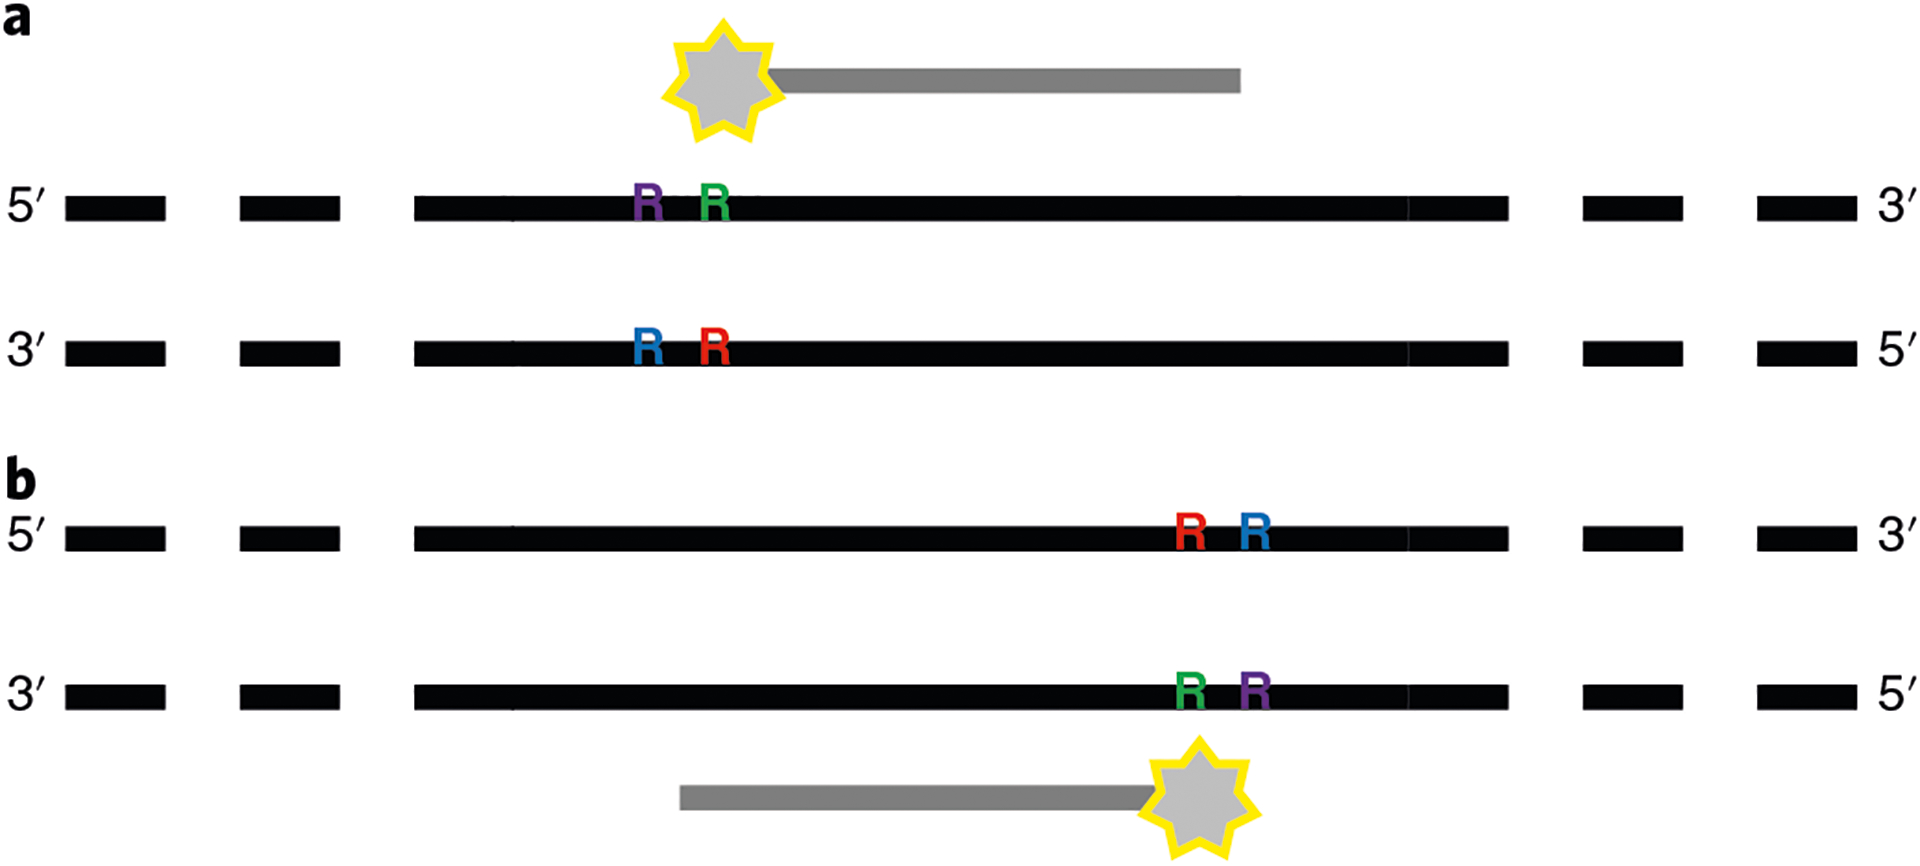
a,b, Comparison of positions of an rNMP (‘R’) embedded in genomic DNA (black lines) relative to the tagged 5′-most nucleotide (star) of a sequencing read (gray line) for reads that align to the Watson strand (a) and Crick strand (b) for ribose-seq (red ‘R’), emRiboSeq (blue ‘R’), RHII-HydEn-seq (green ‘R’), Alk-HydEn-seq (purple ‘R’) and Pu-seq (purple ‘R’). ribose-seq: the rNMP (red ‘R’) is the reverse complement of the tagged nucleotide; emRiboSeq: the rNMP (blue ‘R’) is one nucleotide downstream from the reverse complement of the tagged nucleotide; RHII-HydEn-seq: the rNMP (green ‘R’) is in the same position as the tagged nucleotide; Alk-HydEn-seq and Pu-seq: the rNMP (purple ‘R’) is one nucleotide upstream from the tagged nucleotide.
Table 1 |.
Genomic arithmetic used to calculate the genomic coordinates of rNMPs for ribose-seq, emRiboSeq, RHII-HydEn-seq, Alk-HydEn-seq and Pu-seq
| Reads aligned to + DNA strand | Reads aligned to − DNA strand | |||||
|---|---|---|---|---|---|---|
| Start | End | Strand | Start | End | Strand | |
| ribose-seq | S | S + 1 | − | E − 1 | E | + |
| emRiboSeq | S − 1 | S | − | E | E + 1 | + |
| RHII-HydEn-seq | S | S + 1 | + | E − 1 | E | − |
| Alk-HydEn-seq and Pu-seq | S − 1 | S | + | E | E + 1 | − |
Start represents the 0-based start coordinate of rNMP; End represents the 0-based end coordinate of rNMP; S represents the 0-based start coordinate of a read; E represents the 0-based end coordinate of a read; Strand represents the Strand of rNMP; + represents the Watson strand and – represents the Crick strand.
Studying biological signatures of rNMP incorporation using the Composition, Sequence, Distribution and Hotspot modules
Once the genomic coordinates of rNMPs have been calculated, researchers can input these coordinates into Ribose-Map’s Composition, Sequence, Distribution and Hotspot modules to uncover biological signatures of rNMP incorporation in the genome of interest. In particular, researchers can use these modules to explore four important questions: (i) What is the genome-wide distribution of rNMP incorporation? (ii) Are there biases in the type of rNMP nucleotide incorporated into genomic DNA? (iii) Is rNMP incorporation influenced by the surrounding DNA sequence context? (iv) Are there hotspots of rNMP incorporation?
The Sequence module calculates and plots the frequencies of the nucleotides at the sites of rNMP incorporation and up-/downstream from those sites. These frequencies are normalized to those of the reference genome. The Distribution module calculates and plots the per-nucleotide coverage of rNMPs at each position in the genome and normalizes the coverage to the total read count to allow for direct comparison among libraries of different sequencing depth. The Distribution module also creates BedGraph files of rNMP counts at each genomic coordinate for each strand of DNA that the user can upload to a genome browser, such as the UCSC Genome Browser (http://genome.ucsc.edu/), as custom annotation tracks to explore rNMP incorporation across the genome. In addition to the Sequence and Distribution modules, we have now added two additional modules to the Ribose-Map toolkit, the Composition module and the Hotspot module. The Composition module calculates the percentages of r[A, C, G, U]MP and normalizes the percentages to those of the reference genome. The Hotspot module identifies the top 1% (or other %, as desired) most abundant sites of rNMP incorporation and uses MEME (http://meme-suite.org/tools/meme) to identify any consensus sequences of those sites.
To demonstrate the potential of Ribose-Map, we consider previously published rNMP sequencing data derived from ribonuclease (RNase) H2-defective strains of Saccharomyces cerevisiae (S. cerevisiae) using ribose-seq library SRR11364933 (strain background E134)7 and emRiboSeq library SRR1734967 (strain background (Δl(−2)l-7BYUNI300)2.
Expertise needed to implement the protocol
This protocol assumes experience with the Unix/Linux command-line interface. Users should be able to run programs from the command line and edit text files in the Unix/Linux environment.
Limitations of the protocol
Since Ribose-Map’s Alignment module employs the short-read aligner, Bowtie 2, longer reads generated using third-generation sequencing technology, such as Pacific Biosciences, should not be input into the Alignment module. However, after aligning longer reads using an appropriate software, the user can directly input the aligned reads into Ribose-Map’s Coordinate module.
Materials
Equipment
Git version-control system (https://git-scm.com/)
Ribose-Map (https://github.com/agombolay/ribose-map)
Hardware (64-bit computer running Linux or Mac OS X)
Equipment setup
Installing software
Ribose-Map utilizes a combination of open-source bioinformatics software and custom Linux and R commands. To create a software environment in which to run Ribose-Map, we recommend using mamba (see ‘Equipment‘). The YAML file required to create such an environment for Linux or MacOSX is provided in the lib folder of the Ribose-Map GitHub repository (ribose-map/lib). Instructions on installing mamba are provided at https://github.com/mamba-org/mamba. Instructions on installing git are provided at https://git-scm.com/. All commands shown below assume a Bash Shell and should be run via the Unix/Linux command-line (indicated by ‘$’). The user should replace all instances of path/to/ with their own filepath.
Clone Ribose-Map repository:
$ git clone https://github.com/agombolay/ribose-map.git
Create software environment:
Prefix should be set to the full path of the user-preferred location of the environment
$ mamba env create -p PREFIX -f path/to/ribose-map/lib/ribosemap.yaml
Required data
Ribose-Map requires (i) a FASTQ file of single- or paired-end rNMP sequencing data (ribose-seq, emRiboSeq, RHII-HydEn-seq, Alk-HydEn-seq, or Pu-seq), (ii) a FASTA file of the reference genome nucleotide sequence, (iii) a file containing the reference genome chromosome sizes (extension.chrom. sizes), (iv) Bowtie 2 indexes for the reference genome (extension.bt2), and (v) a configuration (config) file. The FASTQ files used in this protocol can be downloaded from NCBI’s Sequence Read Archive via accession numbers SRR11364933 (ribose-seq library) and SRR1734967 (emRiboSeq library). The FASTA and chrom.sizes files for many genomes, including the 2008 build of the S. cerevisiae genome (sacCer2) used in this protocol, are available at the UCSC genome browser website (https://genome.ucsc.edu/). Instructions on building the Bowtie 2 indexes from the FASTA file and creating the configuration files are provided below.
Downloading and preparing required data files
First, the conda software environment should be activated. Next, the FASTQ file of ribose-seq data should be downloaded from NCBI’s Sequence Read Archive using the fastq-dump tool of the SRA Toolkit. Then, the FASTA and chrom.sizes files for S. cerevisiae should be downloaded from the UCSC genome browser website, and the Bowtie 2 indexes should be built.
Download FASTA file from UCSC genome browser for sacCer2 reference genome:
$ wget http://hgdownload.soe.ucsc.edu/goldenPath/sacCer2/bigZips/sacCer2.fa.gz
Download chrom.sizes file from UCSC genome browser for sacCer2 reference genome:
$ wget http://hgdownload.soe.ucsc.edu/goldenPath/sacCer2/bigZips/sacCer2.chrom.sizes
Unzip FASTA file:
$ gunzip path/to/sacCer2.fa.gz
If the chrom.sizes file is not readily available for download for the particular genome of interest, see Box 1 below on creating this file from the FASTA file using SAMtools and Linux commands. Activate the software environment:
$ conda activate PREFIX
Box 1 |. Create file containing the reference genome chromosome sizes.
If the chrom.sizes file is not readily available for download for the genome of interest, this file can be created from the reference genome FASTA file using the following commands:
$ samtools faidx sacCer2.fa > sacCer2.fa.fai
$ cut -f1,2 sacCer2.fa.fai > sacCer2.chrom.sizes
Download FASTQ files of rNMP sequencing data from NCBI’s Sequence Read Archive:
$ fastq-dump SRR11364933
$ fastq-dump SRR1734967
Create Bowtie 2 indexes for reference genome:
$ bowtie2-build path/to/sacCer2.fa sacCer2
Create configuration file
To run any of the Ribose-Map modules, a configuration file must be created for each sample and specified on the command line as shown in Procedure Steps 2–7. The configuration file should contain the following parameters: ‘sample’, ‘technique’, ‘fasta’, ‘basename’, ‘repository’, ‘read1’ (and ‘read2’ if paired-end), ‘mismatches’, ‘quality’, ‘threads’ and ‘percentile’.
First, the user should specify the parameter ‘sample’ as the sample name with which to label the output of each module. The ‘technique’ parameter should be specified as one of the currently available rNMP sequencing techniques (e.g., ‘ribose-seq’, ‘emRiboseSeq’, ‘RHII-HydEn-seq’, ‘Alk-HydEn-seq’ or ‘Pu-seq’). The ‘fasta’ parameter should be specified as the path to the reference genome FASTA file (e.g., sacCer2.fa). The ‘basename’ parameter should be specified as the path to the Bowtie 2 index files excluding the bt2 extension. The ‘repository’ parameter should be specified as the location to which to save the results. The ‘read1’ parameter should be specified as the path to the read 1 FASTQ file. If the input data is paired-end, an additional parameter, the ‘read2’ parameter, should be specified as the path to the read 2 FASTQ file.
The ‘mismatches’ parameter should be specified as the number of mismatches allowed in a seed alignment during multi-seed alignment (0 or 1). The ‘quality’ parameter should be specified as the minimum alignment Phred quality score threshold for the aligned reads. The ‘threads’ parameter should be specified as the number of parallel computing threads used during the Alignment module. The ‘percentile’ parameter should be specified as the percentile used to identify sites with increased rNMP incorporation by the Hotspot module. For example, to identify sites that rank in the 99th percentile for rNMP incorporation, ‘percentile’ should be specified as 0.99.
By default, Ribose-Map analyzes all genomic units of the reference genome (e.g., chromosome 1, chromosome 2, chromosome 3, etc.) collectively unless the ‘units’ parameter is specified as one or more units that should be analyzed individually. If a barcode is present in the reads, the ‘barcode’ parameter should be specified as the nucleotide sequence of the barcode. If a UMI (with or without a barcode) is present in the reads, then the ‘pattern’ parameter should be specified as the pattern of the UMI (e.g., ‘NNNNNNXXXNN’). The number of ‘N’ characters represents the length of the UMI sequence, and the number of ‘X’ characters represents the length of the barcode sequence (the position of these characters represents the position of the barcode relative to the UMI).
The configuration files required for this protocol are provided in the lib folder of the Ribose-Map GitHub repository (ribose-map/lib) (see Procedure). To adapt these configuration files for different datasets, the user should delete any parameters that do not apply to their particular dataset and replace the built-in values for each parameter with the values appropriate for their dataset.
Procedure
Trim reads based on quality, length and adapter content ● Timing <5 min
-
1
The first 12 nucleotides of the raw ribose-seq reads contain an 11-nucleotide UMI/barcode sequence plus the tagged nucleotide. Therefore, the minimum allowed read length was selected as 62 nucleotides so that at least 50 nucleotides of genomic DNA remain after the UMI/barcode sequence is removed during the Alignment module. The raw emRiboSeq reads do not contain a UMI or barcode, so the minimum allowed read length was selected as 51 nucleotides (the tagged nucleotide + 50 nucleotides of genomic DNA for alignment). ‘AGTTGCGACACGGATCTATCA’ is the custom adapter present at the 3′ end of ribose-seq reads and should be trimmed from the reads before alignment. The user should replace path/to/ with their own filepaths. ‘Output’ should be set to the user-preferred location of the output files.
Trim the ribose-seq reads with the following command:$ trim_galore -a AGTTGCGACACGGATCTATCA -q 15 --length 62 path/to/SRR11364933.fastq -o ‘output’
Trim the emRiboSeq reads with the following command:$ trim_galore --illumina -q 15 --length 50 path/to/SRR1734967.fastq -o ‘output’
SRR11364933.config and SRR1734967.config are provided in ribose-map/lib. The user should replace all instances of path/to/ in the configuration files and below with their own filepaths.
? TROUBLESHOOTING
Alignment module ● Timing <5 min
-
2Run the Alignment module with the following commands:
$ path/to/ribose-map/modules/ribosemap alignment path/to/ribose-map/lib/SRR11364933.config
$ path/to/ribose-map/modules/ribosemap alignment path/to/ribose-map/lib/SRR1734967.config
? TROUBLESHOOTING
Coordinate module ● Timing <5 min
-
3Run the Coordinate module with the following commands:
$ path/to/ribose-map/modules/ribosemap coordinate path/to/ribose-map/lib/SRR11364933.config
$ path/to/ribose-map/modules/ribosemap coordinate path/to/ribose-map/lib/SRR1734967.config
? TROUBLESHOOTING
Composition module ● Timing <5 min
-
4Run the Composition module with the following commands:
$ path/to/ribose-map/modules/ribosemap composition path/to/ribose-map/lib/SRR11364933.config
$ path/to/ribose-map/modules/ribosemap composition path/to/ribose-map/lib/SRR1734967.config
? TROUBLESHOOTING
Sequence module ● Timing ~2 h
-
5Run the Sequence module with the following commands:
$ path/to/ribose-map/modules/ribosemap sequence path/to/ribose-map/lib/SRR11364933.config
$ path/to/ribose-map/modules/ribosemap sequence path/to/ribose-map/lib/SRR1734967.config
? TROUBLESHOOTING
Distribution module ● Timing ~30 min
-
6Run the Distribution module with the following commands:
$ path/to/ribose-map/modules/ribosemap distribution path/to/ribose-map/lib/SRR11364933.config
$ path/to/ribose-map/modules/ribosemap distribution path/to/ribose-map/lib/SRR1734967.config
? TROUBLESHOOTING
Hotspot module ● Timing <5 min
-
7Run the Hotspot module with the following commands:
$ path/to/ribose-map/modules/ribosemap hotspot path/to/ribose-map/lib/SRR11364933.config
$ path/to/ribose-map/modules/ribosemap hotspot path/to/ribose-map/lib/SRR1734967.config
? TROUBLESHOOTING
Troubleshooting
Troubleshooting advice can be found in Table 2.
Table 2 |.
Troubleshooting table
| Step(s) | Problem | Possible reason | Solution |
|---|---|---|---|
| 1–7 | Module cannot be located | Path to modules not specified | Specify full path to ribose-map/modules when running any module or directly run module from within ribose-map/modules |
| Software cannot be located | ribosemap_env software environment not activated | Activate software environment with the following command: conda activate ribosemap_env | |
| 3 | Coordinate module outputs empty BED file to results folder | Technique parameter is not specified correctly in config file | Technique parameter should be set to ribose-seq, emRiboSeq, RHII-HydEn-seq, Alk-HydEn-seq or Pu-seq in config file |
| 4–7 | Composition, Sequence, Distribution and/or Hotspot modules do not output results | These modules depend on BED file created by Coordinate module. Thus, BED file must be present in Coordinate module’s results folder for subsequent modules to run | Run Coordinate module to obtain BED file |
Timing
Running this protocol on the example data provided will take ~30 min of hands-on time and 3 h of computing time. This protocol was run using a high-performance computer cluster with two nodes, four processors per node and 5 GB of memory per core; however, a more standard set-up (e.g., a 64 bit computer running Linux or Mac OS X) can be used to run this protocol, and timing would be comparable. For other datasets, the timing may take longer depending on the volume of sequencing data, the size of the reference genome, and the computer used.
Anticipated results
The output files of each module of Ribose-Map are outlined in Fig. 1. The following results were obtained using each module of Ribose-Map for the sample datasets stated previously.
Alignment module
The Alignment module outputs a BAM file of the aligned reads (also demultiplexed and deduplicated if needed) and a log file including the number of input reads, the number of reads that aligned zero times, the number of reads that aligned exactly one time, the number of reads that aligned more than one time, and the overall alignment rate. If the reads contain a barcode and/or UMI, the log file will also include the percentage of reads containing the barcode and/or the percentage of reads remaining after deduplication. If the number of reads present in the BAM file is substantially less than the number of input reads, the user should check the alignment.log file to assess if this discrepancy is due to low alignment rate, low barcode rate and/or high duplication rate. Approximately 90% or more of the input reads should align to the reference genome13. Lower alignment rates could indicate low-quality reads and/or the presence of contaminants (e.g., custom sequencing adapter) in the reads. In addition, lower alignment rates could result from mismatched nucleotides, insertions and/or deletions compared with the reference genome. Table 3 presents the read alignment statistics for libraries SRR11364933 and SRR1734967.
Table 3 |.
Read alignment statistics for libraries SRR11364933 and SRR1734967
| Library | Aligned reads (%) | Multi-mapping reads (%) | Barcoded reads (%) | Unique reads (%) |
|---|---|---|---|---|
| SRR11364933 | 98.88 | 18.92% | 81.69 | 39.39 |
| SRR1734967 | 98.95 | 12.42% | N/A | N/A |
Aligned reads represents the reads aligned to both nuclear and mitochondrial DNA. Barcoded reads represents the reads containing the barcode specified in configuration file. Unique reads represents the reads remaining after reads are deduplicated. Barcoded reads = not applicable (N/A) for library SRR1734967 since the reads were not barcoded during library preparation. Unique reads = not applicable (N/A) for library SRR1734967 since the library was not PCR amplified.
Coordinate module
Based on the BAM file output from the Alignment module, the Coordinate module outputs a BED file of the genomic coordinates of all rNMPs present in the sequencing library (six columns: chromo-some, 0-based start coordinate, 0-based end coordinate, read name, and DNA strand (+/−)). Each line of this file represents the genomic coordinates of an rNMP, and multiple lines may have the same coordinates. The number of aligned reads (concordantly aligned reads for paired-end data) in the BAM file should be equal to the number of rNMPs in the BED file unless some reads were removed during quality control for emRiboSeq, Alk-HydEn-seq or Pu-seq data (see ‘Locating rNMPs with the Coordinate module‘ under ‘Experimental design‘) or if some of the reads did not meet the quality threshold specified in the configuration file. In addition, the Coordinate module also outputs a tab-delimited file of unique rNMP sites. Table 4 presents the total number of rNMPs and the number of unique rNMP sites in the mitochondrial DNA of the ribose-seq and emRiboSeq example datasets. If a genomic unit does not contain any rNMPs, the Coordinate module will not output a file for that particular unit.
Table 4 |.
rNMP genomic coordinate statistics for mitochondrial and nuclear ribose-seq data (library SRR11364933) and emRiboSeq data (library SRR1734967)
| Library | Nucleus | Mitochondria | ||
|---|---|---|---|---|
| Total rNMPs | rNMP sites | Total rNMPs | rNMP sites | |
| SRR11364933 | 693,359 | 388,437 | 48,131 | 13,335 |
| SRR1734967 | 2,745,709 | 2,280,795 | 47,037 | 25,102 |
Total rNMPs represents the number of rNMPs in library after alignment, demultiplexing and deduplication (if required). rNMP sites represents the number of genomic coordinates where at least one rNMP is present.
Composition module
One of the first steps that should be taken to identify possible biological signatures of rNMP incorporation is determining if there are any biases in the composition of rNMPs incorporated into the genome of interest, meaning the relative frequencies of the four types of rNMPs (r[A, C, G, U] MP) that can be incorporated into the genome. The Composition module outputs the raw counts of each type of rNMP and the percentages of each rNMP normalized to the corresponding nucleotide frequencies of the reference genome. In addition, the Composition module plots the normalized percentages of rNMP composition. Based on these plots, the user can readily determine if certain types of rNMPs are preferentially incorporated into the genome of interest. In this example, rCMP is the most frequently incorporated rNMP relative to the reference genome in the mitochondrial DNA of the ribose-seq dataset, and rGMP is the most frequently incorporated rNMP in the mitochondrial DNA of the emRiboSeq dataset, while rUMP and rAMP are the least frequently incorporated rNMPs in both of these datasets (Fig. 3).
Fig. 3 |. rNMP composition in nuclear and mitochondrial yeast DNA.
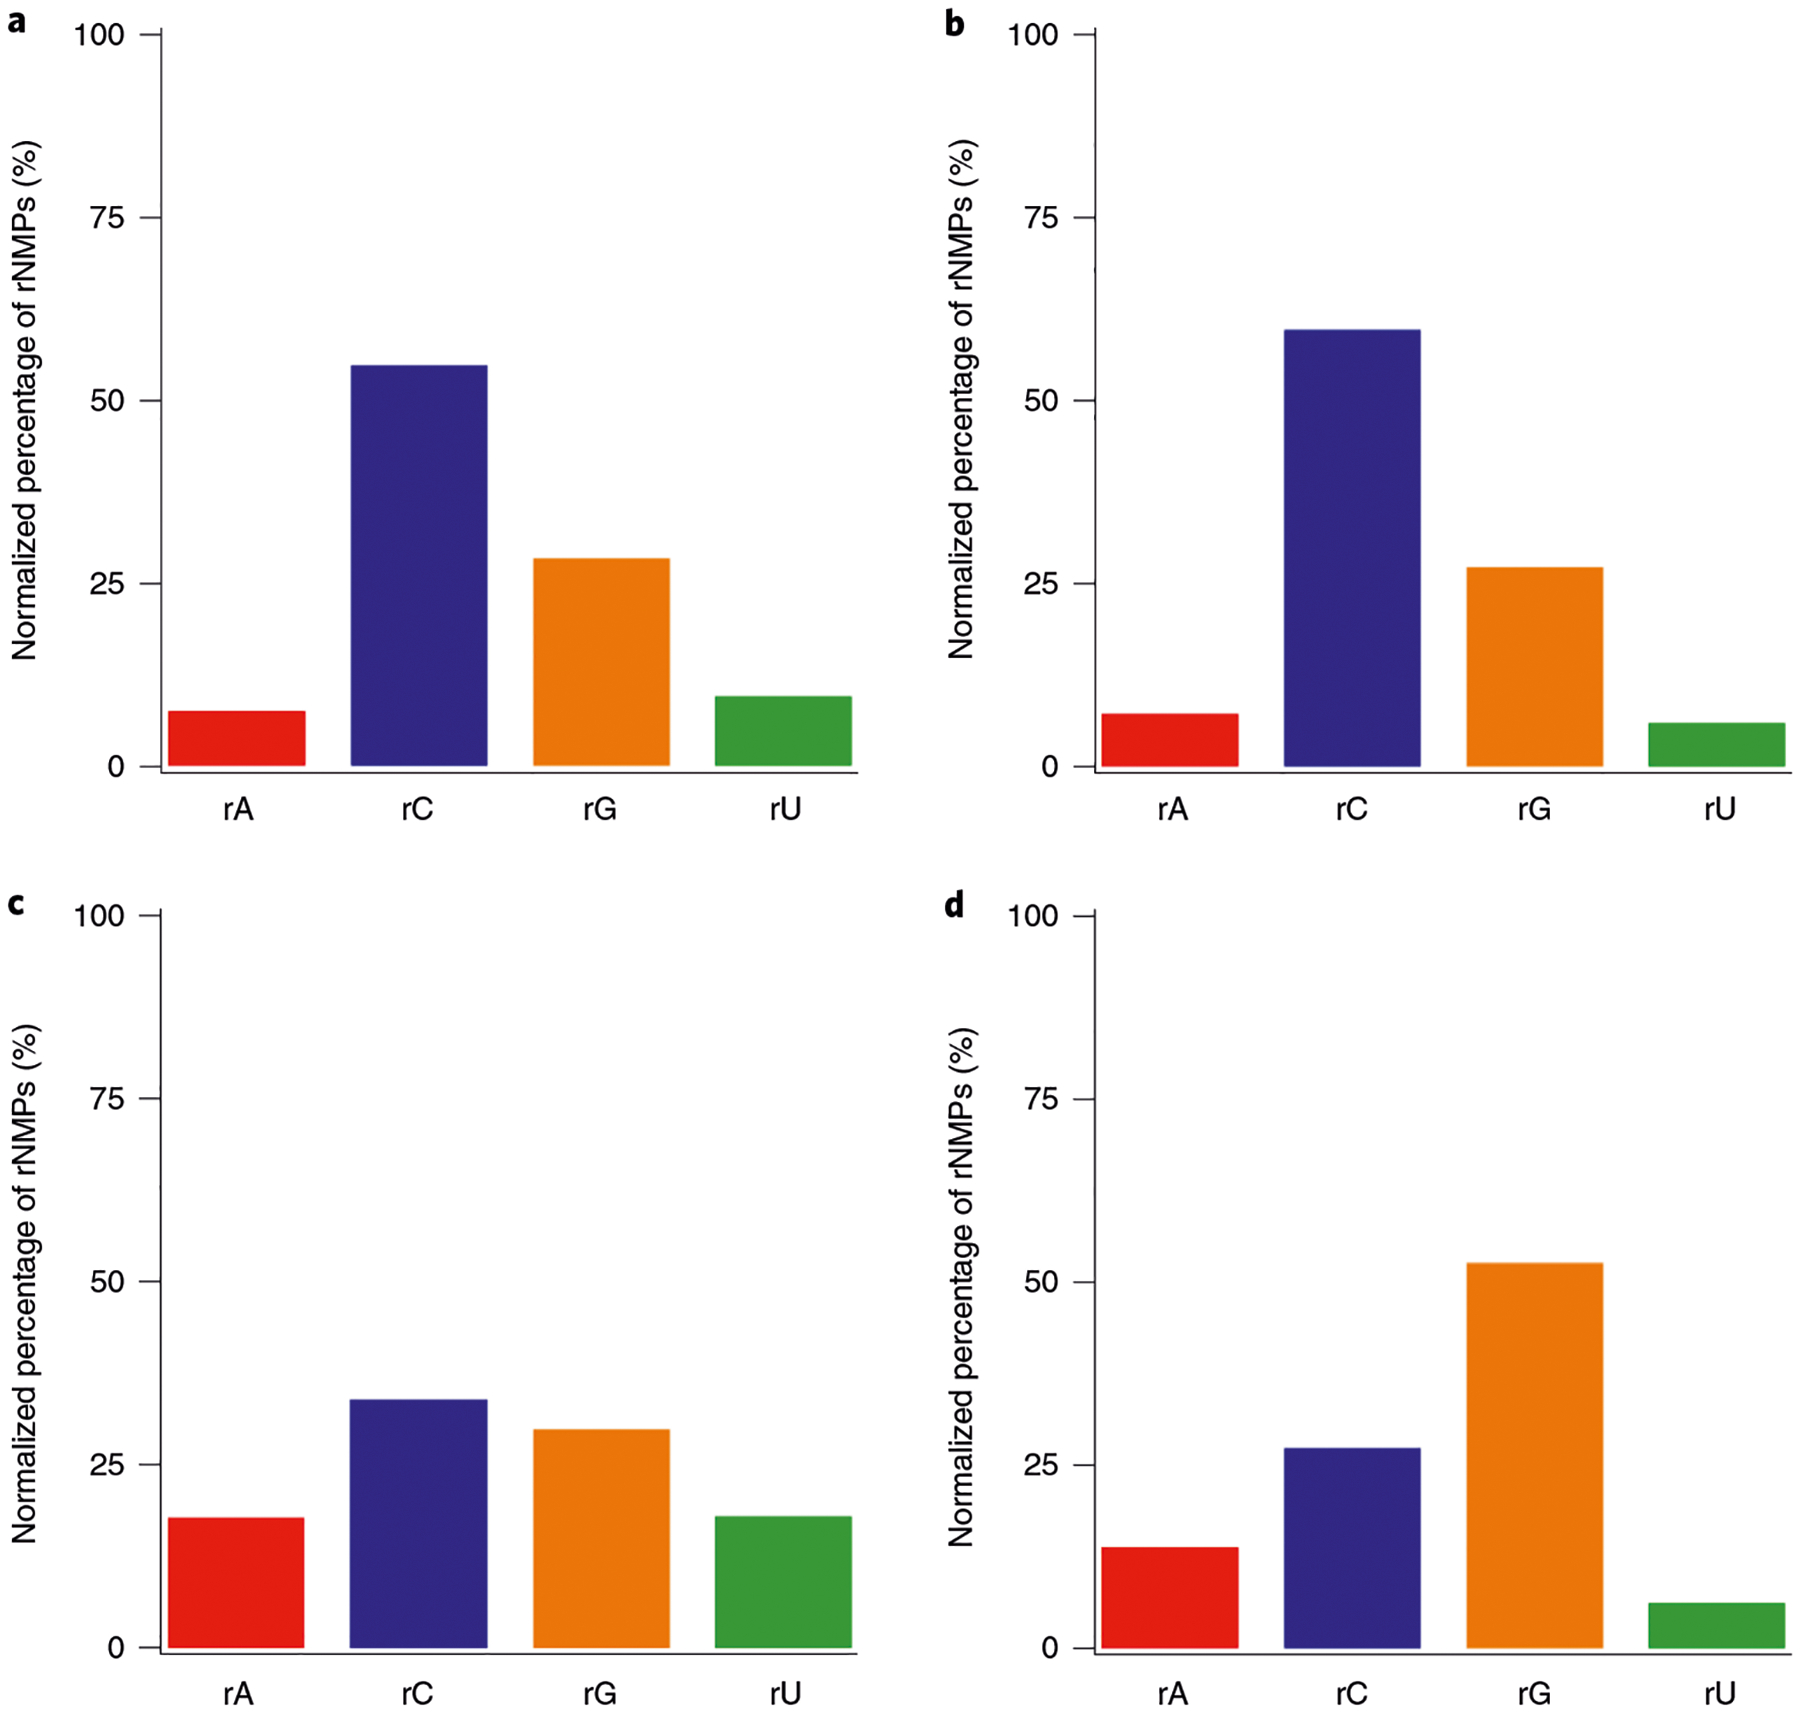
a–d, rNMP composition in RNase H2 defective S. cerevisiae DNA; nuclear (a) and mitochondrial DNA (b) of strain E134 (library SRR11364933) captured using ribose-seq; nuclear (c) and mitochondrial DNA (d) of strain (Δl(−2)l-7BYUNI300 (library SRR1734967) captured using emRiboSeq. Percentages for each type of rNMP were normalized to corresponding percentages of sacCer2 and plotted using Ribose-Map’s Composition module. Each bar represents a single value.
Sequence module
To reveal if rNMP incorporation is influenced by DNA sequence context, the Sequence module calculates and plots the frequencies of each type of nucleotide (A, C, G and U/T) at sites of rNMP incorporation and surrounding those sites for all rNMPs combined as well as for each of the four types of rNMPs individually. In this example, rNMPs are more frequently incorporated into GC-rich regions of S. cerevisiae mitochondrial DNA than would be expected given the nucleotide frequencies of the reference genome (Fig. 4). By examining the DNA sequence context for each type of rNMP individually, the user can explore if this GC-rich sequence context is specific to all types of rNMPs or only one particular type of rNMP. Based on these individual plots, it becomes clear that, although all four types of rNMPs are more frequently incorporated up/downstream from deoxyribonucleotide C/G, rCMP and rGMP are incorporated into GC-rich areas of the mitochondrial DNA at a much higher frequency than r[A/U]MP.
Fig. 4 |. DNA sequence context of rNMPs in mitochondrial yeast DNA.

a–l, DNA sequence context of rNMPs (position 0 on x-axis = rNMP) in S. cerevisiae mitochondrial DNA strain E134 (library SRR11364933) captured using ribose-seq (a–f) and strain (Δl(−2)l-7BYUNI300 (library SRR1734967) captured using emRiboSeq and plotted using Ribose-Map’s Sequence module (g–l). Ribose-seq data zoomed-out for r[A, C, G, U]MP combined (a), zoomed-in for r[A, C, G, U]MP combined (b), zoomed-in for rAMP (c), zoomed-in for rCMP (d), zoomed-in for rGMP (e) and zoomed-in for rUMP (f). emRiboSeq data zoomed-out for r[A, C, G, U]MP combined (g), zoomed-in for r[A, C, G, U]MP combined (h), zoomed-in for rAMP (i), zoomed-in for rCMP (j), zoomed-in for rGMP (k) and zoomed-in for rUMP (l). Nucleotide frequencies were normalized to the corresponding frequencies of sacCer2.
Distribution module
To assess the genome-wide distribution of rNMP incorporation, the Distribution module outputs tab-delimited files containing the per-nucleotide coverage of rNMPs across each genomic unit of interest (e.g., chromosomes, mitochondria, plasmids) normalized to reads per million to allow datasets of different sequencing depth to be readily compared (Fig. 5). The Distribution module also outputs BedGraph files of rNMP counts at each genomic coordinate that the user can upload to a genome browser, such as the UCSC genome browser (http://genome.ucsc.edu/), as custom annotation tracks to explore rNMP incorporation across the genome.
Fig. 5 |. Distribution of rNMPs in yeast mitochondrial DNA.
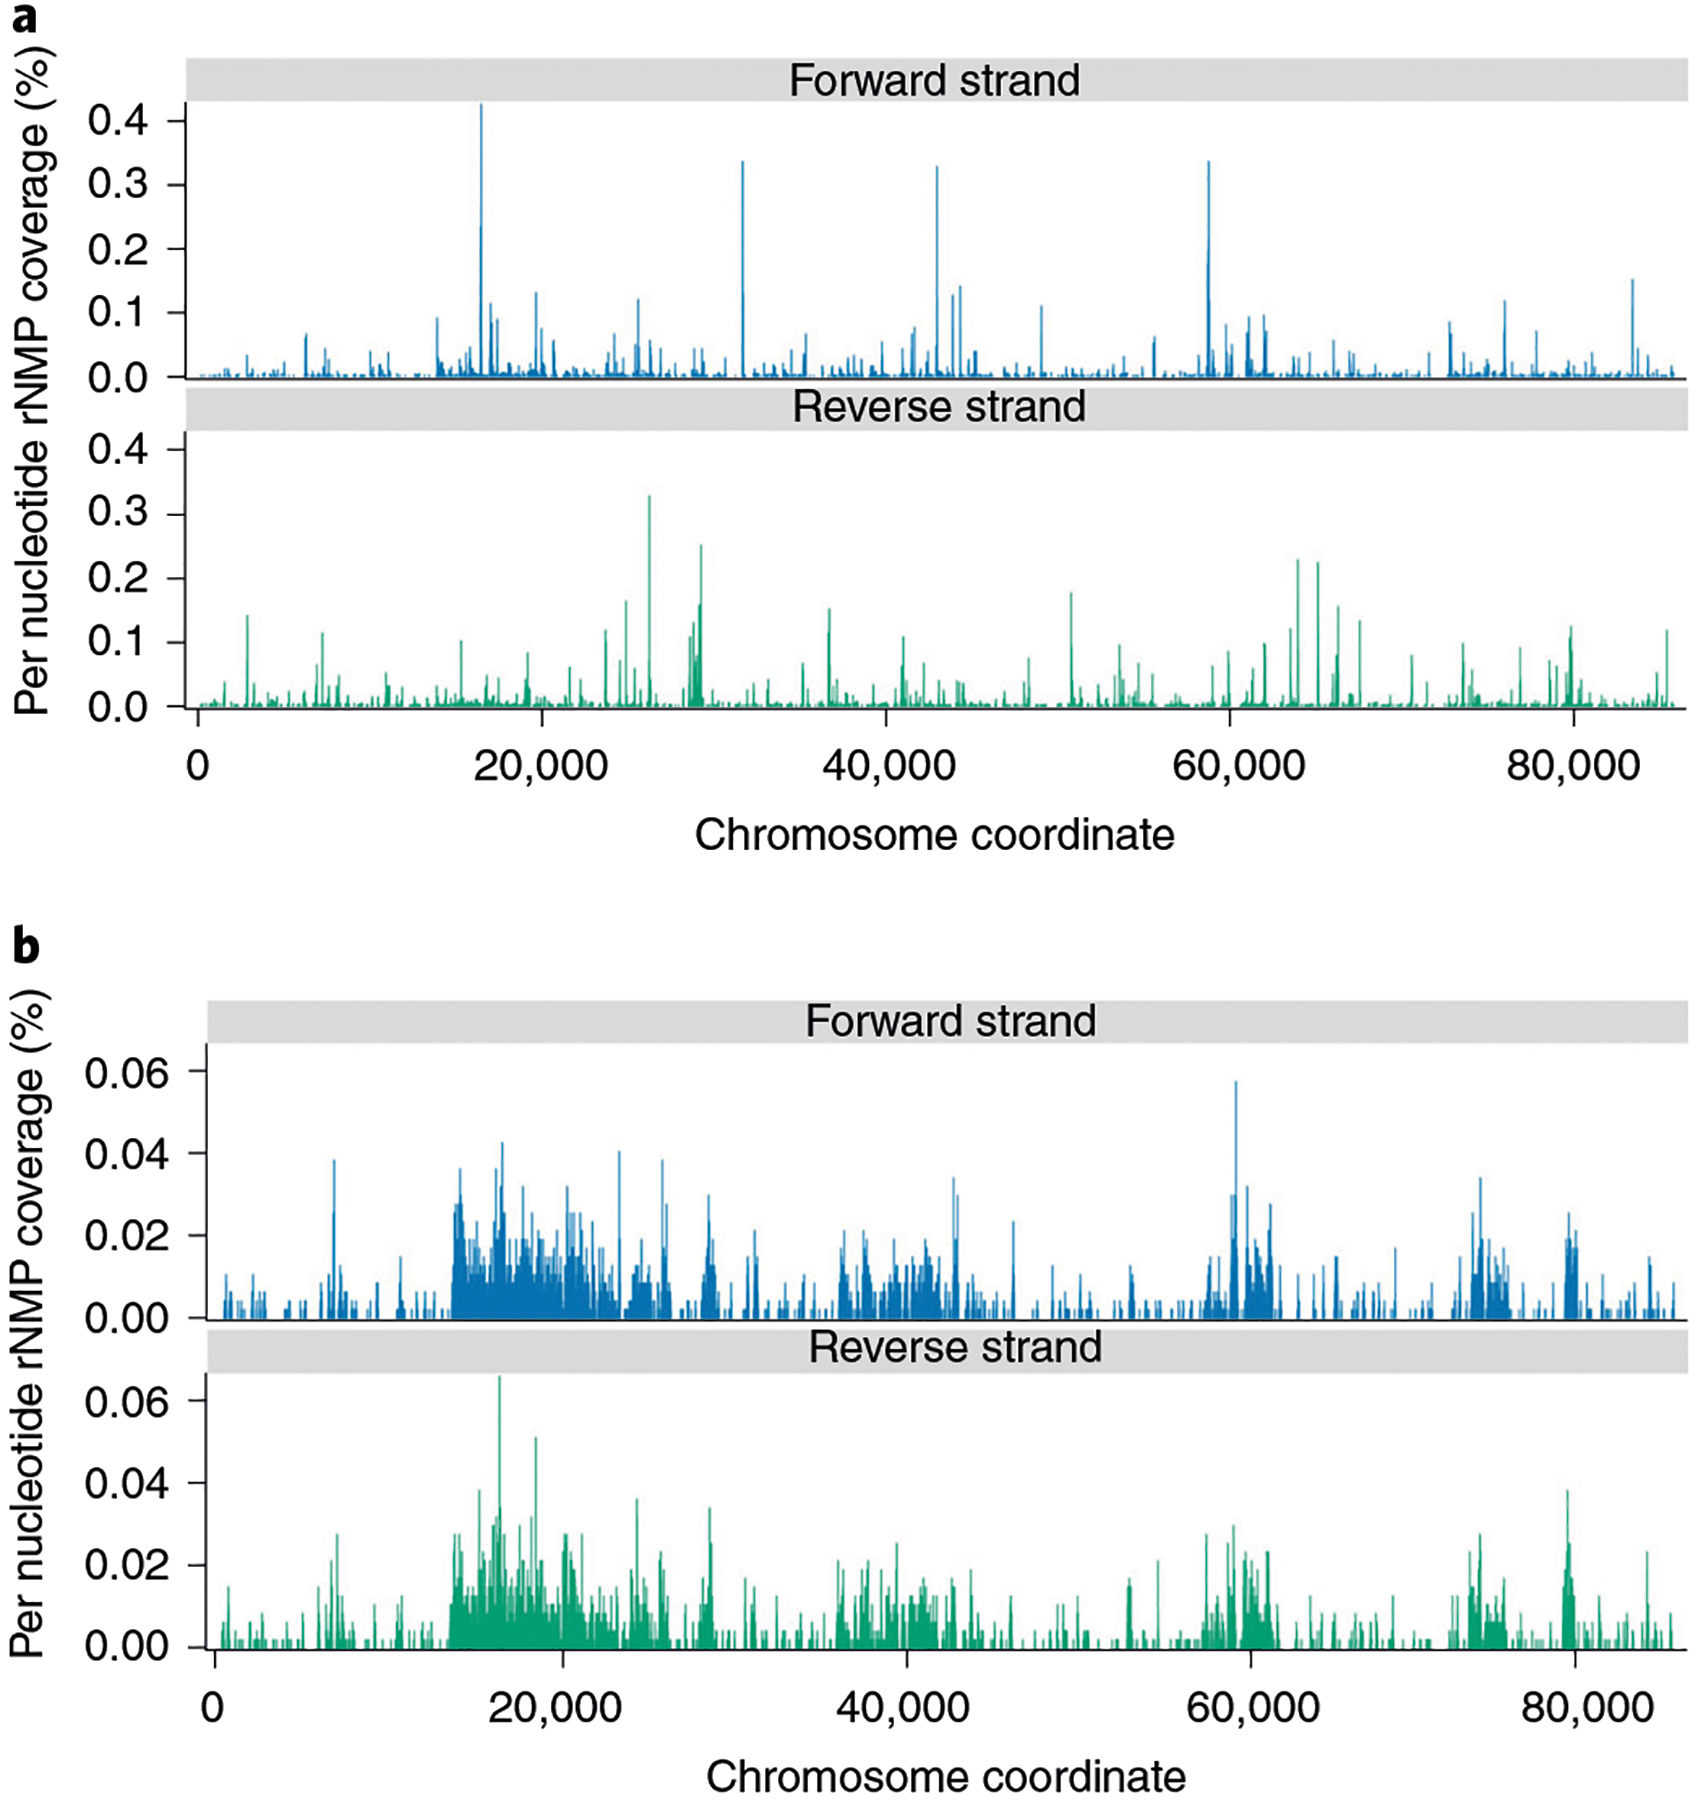
a,b, Distribution of rNMPs in S. cerevisiae mitochondrial DNA strain E134 (library SRR11364933) captured using ribose-seq (a) and strain (Δl(−2)l-7BYUNI300 (library SRR1734967) captured using emRiboSeq and obtained using Ribose-Map’s Distribution module (b). Per-nucleotide coverage of rNMPs is normalized to reads per million.
Hotspot module
To identify sites that are susceptible to rNMP incorporation and determine if these sites share a consensus sequence, the Hotspot module outputs the genomic coordinates of the top 1% most abundant sites of rNMP incorporation and plots their consensus sequence (Fig. 6). This is performed for all four types of rNMPs combined as well as each type of rNMP individually to assess if the consensus sequence is associated with a specific type(s) of rNMP or with all types. These hotspots can also be cross-referenced with gene annotations to explore genetic or epigenetic consequences of rNMP incorporation in the genomic DNA of interest.
Fig. 6 |. Consensus sequences of hotspots in yeast mitochondrial DNA.

a,b, Consensus sequences of the top 1% most abundant sites of rNMP incorporation (x-axis represents nucleotide position (position 0 = rNMP); y-axis represents sequence conservation measured in bits) in S. cerevisiae mitochondrial DNA strain E134 (library SRR11364933) captured using ribose-seq (a), corresponding to one of the panels in Fig. 7A (ref.7); and strain (Δl(−2)l-7BYUNI300 (library SRR1734967) captured using emRiboSeq and plotted using Ribose-Map’s Hotspot Module (b), corresponding to one of the panels in Supplementary Fig. 8A in ref.7.
Acknowledgements
We are grateful to P. Xu, T. Yang, K. Mukherjee and D. Kundnani for suggestions on this manuscript as well as M. Borodovsky, I.K. Jordan, S. Yi, F. Vannberg and all members of the Storici laboratory for their advice during the course of this study. This research was supported by the National Institutes of Health (R01ES026243-01 to F.S.); the Parker H. Petit Institute for Bioengineering and Bioscience at Georgia Institute of Technology (12456H2 to F.S.), and the Howard Hughes Medical Institute Faculty Scholar grant (55108574 to F.S.).
Related links
Key references using this protocol
Gombolay, A. L. et al. Nucleic Acids Res. 47, e5 (2019): https://doi.org/10.1093/nar/gky874
Balachander, S. et al. Nat. Commun. 11, 2447 (2020): https://doi.org/10.1038/s41467-020-16152-5
Key data used in this protocol
Balachander, S. et al. Nat. Commun. 11, 2447 (2020): https://doi.org/10.1038/s41467-020-16152-5
Footnotes
Code availability
Ribose-Map is available for download at GitHub (https://doi.org/10.5281/zenodo.4574403).
Competing interests
The authors declare no competing interests.
Data availability
The ribose-seq dataset used for this study is available in NCBI’s Sequence Read Archive via accession number SRR113649337. The emRiboSeq dataset used for this study is available in NCBI’s Gene Expression Omnibus via accession number SRR17349677.
References
- 1.Koh KD, Balachander S, Hesselberth JR & Storici F Ribose-seq: global mapping of ribonucleotides embedded in genomic DNA. Nat. Methods 12, 251–257 (2015). [DOI] [PMC free article] [PubMed] [Google Scholar]
- 2.Reijns MAM et al. Lagging-strand replication shapes the mutational landscape of the genome. Nature 518, 502–506 (2015). [DOI] [PMC free article] [PubMed] [Google Scholar]
- 3.Zhou ZX, Lujan SA, Burkholder AB, Garbacz MA & Kunkel TA Roles for DNA polymerase delta in initiating and terminating leading strand DNA replication. Nat. Commun 10, 3992 (2019). [DOI] [PMC free article] [PubMed] [Google Scholar]
- 4.Clausen AR et al. Tracking replication enzymology in vivo by genome-wide mapping of ribonucleotide incorporation. Nat. Struct. Mol. Biol 22, 185–191 (2015). [DOI] [PMC free article] [PubMed] [Google Scholar]
- 5.Daigaku Y et al. A global profile of replicative polymerase usage. Nat. Struct. Mol. Biol 22, 192–198 (2015). [DOI] [PMC free article] [PubMed] [Google Scholar]
- 6.Gombolay AL, Vannberg FO & Storici F Ribose-Map: a bioinformatics toolkit to map ribonucleotides embedded in genomic DNA. Nucleic Acids Res. 47, e5 (2019). [DOI] [PMC free article] [PubMed] [Google Scholar]
- 7.Balachander S et al. Ribonucleotide incorporation in yeast genomic DNA shows preference for cytosine and guanosine preceded by deoxyadenosine. Nat. Commun 11, 2447 (2020). [DOI] [PMC free article] [PubMed] [Google Scholar]
- 8.Skinner ME, Uzilov AV, Stein LD, Mungall CJ & Holmes IH JBrowse: a next-generation genome browser. Genome Res. 19, 1630–1638 (2009). [DOI] [PMC free article] [PubMed] [Google Scholar]
- 9.Kent WJ et al. The human genome browser at UCSC. Genome Res. 12, 996–1006 (2002). [DOI] [PMC free article] [PubMed] [Google Scholar]
- 10.Quinlan AR & Hall IM BEDTools: a flexible suite of utilities for comparing genomic features. Bioinformatics 26, 841–842 (2010). [DOI] [PMC free article] [PubMed] [Google Scholar]
- 11.Smith T, Heger A & Sudbery I UMI-tools: modeling sequencing errors in Unique Molecular Identifiers to improve quantification accuracy. Genome Res. 27, 491–499 (2017). [DOI] [PMC free article] [PubMed] [Google Scholar]
- 12.Martin M Cutadapt removes adapter sequences from high-throughput sequencing reads. EMBnet J. 17, 10–12 (2011). [Google Scholar]
- 13.Thankaswamy-Kosalai S, Sen P & Nookaew I Evaluation and assessment of read-mapping by multiple next-generation sequencing aligners based on genome-wide characteristics. Genomics 109, 186–191 (2017). [DOI] [PubMed] [Google Scholar]
Associated Data
This section collects any data citations, data availability statements, or supplementary materials included in this article.
Data Availability Statement
The ribose-seq dataset used for this study is available in NCBI’s Sequence Read Archive via accession number SRR113649337. The emRiboSeq dataset used for this study is available in NCBI’s Gene Expression Omnibus via accession number SRR17349677.