

Abstract
Objectives.
To examine variation in the delivery of fluoride varnish during pediatric medical visits by rurality.
Methods.
This observational study used private health insurance claims (2016–2018) for children aged 1 to 5 years from Connecticut, Maine, New Hampshire, and Rhode Island linked to the county-level Rural-Urban Continuum codes. County-level Rural-Urban Continuum codes were categorized into three groups: metropolitan, rural, and remote rural. Logistic regression models were used to estimate the odds of a well-child medical visit including fluoride varnish by county rurality, adjusting for other individual and county characteristics.
Results.
Among 328,661 pediatric well-child visits paid by private insurance, fluoride varnish was included in 4.3% of visits in metropolitan counties, 6.2% of visits in rural counties, and 10.3% of visits in remote rural counties. There were significantly higher odds of a visit including fluoride varnish in rural remote counties (odds ratio [OR]=3.5, 95% confidence interval [CI]=2.3–5.3, P<0.001) and in rural counties (OR=2.4, 95% CI=1.4–4.0, P<0.001) compared to metropolitan counties. Rates of fluoride varnish during well-child visits increased since 2016 in metropolitan counties and remained stable in rural counties.
Conclusions.
All young children are recommended to receive fluoride varnish applications in medical settings, yet overall rates were low. For privately insured young children, pediatric well-child medical visits were more likely to include fluoride varnish in rural and rural remote counties than metropolitan counties.
Keywords: Children, Rural Population, Preventive Health Services, Health Services Accessibility, Dental Care
Introduction
Fluoride varnish is a preventive oral health service that is effective in reducing tooth decay (1). To increase young children’s receipt of fluoride varnish, since 2014 the US Preventive Services Task Force has recommended that medical providers apply fluoride varnish to the teeth of all children younger than 6 years of age in medical settings (2, 3). Although many state Medicaid programs have covered the delivery of fluoride varnish in medical settings since the mid-2000s, most private health plans only began covering this preventive service in 2015 (4). This is due to a provision in the Affordable Care Act that required many health plans to cover a set of evidence-based preventive health services for children without cost sharing, including fluoride varnish (5).
Expanded coverage of fluoride varnish in medical settings may be particularly beneficial to children living in rural areas, who have lower rates of dental visits than children living in urban areas (6, 7). Lower rates of dental visits in rural areas are driven, in part, by provider shortages, as rural areas account for two-thirds of all dental health professional shortage areas (8). Dental provider shortages are exacerbated for young children living in rural areas, as many general dentists are reluctant to treat young children and few pediatric dentists practice in rural communities (9, 10). For example, a study of children in Iowa found the average travel distance to the nearest dentist was more than two times greater for children living in rural areas than urban areas (11). Improving access to oral health services is important because untreated tooth decay has consequences, including pain, decreased quality of life, worse school performance, and missed days of school (12, 13). Delivery of fluoride varnish in medical settings may help to increase young children’s access to preventive oral health services because children are more likely to make medical visits than dental visits (14), at least in part because children are recommended to have seven well-child medical visits between six months and three years of age (15).
There is conflicting evidence about delivery of fluoride varnish in medical settings by rurality. A study of 39 states using Medicaid claims from 2012–2014 found that rates of fluoride varnish in medical settings were higher in urban counties than rural counties (16). However, a study using Wisconsin Medicaid claims from 2002–2006 found higher rates of fluoride varnish applications in rural counties than urban counties, results that may have been driven by the authors’ examination of applications in both medical and dental settings (17). There are no studies, to our knowledge, that have examined whether fluoride varnish applications in medical settings to privately insured children vary by rurality. Because guidance from Bright Futures and the American Academy of Pediatrics (AAP) encourages delivery of fluoride varnish in medical settings for children without a dental home (18) and because rates of dental visits are low for children living in rural areas (6, 7), we hypothesized that rates of fluoride varnish applications during medical visits may be higher in rural areas than urban areas. Using private health insurance claims data from four states during 2016–2018, this study sought to examine rates of pediatric medical visits with fluoride varnish in rural and urban counties and to assess changes in these patterns over time.
Methods
Data and Sample.
We used health insurance claims data for privately insured children in four New England states to estimate the association between county rurality and receipt of fluoride varnish during well-child medical visits. Private health insurance claims data (2016–2018) were obtained from the Connecticut Office of Health Strategy, the Maine Health Data Organization, New Hampshire Department of Health and Human Services, and the State of Rhode Island Department of Health. These databases included privately insured children in each state, including those with employer sponsored insurance (excluding some self-insured employers) and non-group insurance. Supplemental Appendix Figure A1 describes the process we used to construct the analytic sample. Because our data included information on member age in years, we first identified well-child medical visits received by children aged one through five years of age paid by private health insurance. We examined this age range because children are recommended to receive fluoride varnish during medical visits during these ages (2, 3). The unit of analysis for this study was well-child medical visits, identified using current procedural terminology (CPT) codes for a new or established visit (99381, 99382, 99383, 99391, 99392, 99393). Our unit of analysis was well-child medical visits because guidelines from Bright Futures and the AAP recommend fluoride varnish applications during these visits (15) and because visit periodicity schedules vary by age. This approach gives each well-child visit an equal weighting in our analysis. We excluded 31,089 visits that had claims for children who live in a different state than the database, denied claims, and claims with missing information on any of the variables included in the models, resulting in a final sample of 328,661 visits.
Variables.
The dependent variable was a dichotomous indicator that a visit included fluoride varnish application. Fluoride varnish applications had the same day of service as the medical visit and were identified using CPT code 99188 and Current Dental Terminology code D1206. The key explanatory variable, county rurality, was defined based on the 2013 Rural-Urban Continuum (RUC) codes (19). Consistent with prior research (16), we grouped the nine RUC codes into three mutually exclusive categories:
Metropolitan counties (RUC codes 1–3) are defined by the Office of Management and Budget based on population size and worker commuting status.
Rural counties (RUC codes 4, 6, and 8) are nonmetropolitan counties that are adjacent to a metropolitan area. A county is considered adjacent based on geography (i.e., if it physically adjoins one or more metropolitan areas) and if it has 2 percent or more of its residents commuting for work to metropolitan counties.
Remote rural counties (RUC codes 5, 7, and 9) are nonmetropolitan counties that are not adjacent to a metropolitan area.
County rurality information was merged to our visit-level data using the patient’s county of residence for Maine and New Hampshire and a ZIP code-county crosswalk for Connecticut and Rhode Island. In Connecticut, we lacked patient geographic information, so we used the provider’s location. Seven of Connecticut’s eight counties are metropolitan, suggesting misclassification is likely to be rare.
We constructed visit-level measures of the child’s age, sex, insurance type, year of visit, and state. Additional county-level characteristics were obtained from the Area Health Resources Files and merged to visit-level claims by county and year to adjust for provider supply and demand for services. Provider supply was measured by the number of dentists, pediatricians, and family medicine physicians per 10,000 county population. Demand was measured by the county-level percentage of individuals enrolled in Medicaid as we hypothesized that providers in counties with larger populations of Medicaid patients, who were already eligible to received fluoride varnish, may be more likely to deliver this service to their privately insured pediatric patients.
Analytic approach.
We reported descriptive statistics of the sample across the three levels of rurality. We used t-tests for continuous variables and chi-squared tests of independence for categorical variables to compare the distribution of each variable among (1) metropolitan counties vs. rural counties and (2) metropolitan counties vs. remote rural counties. We constructed maps to illustrate county-level variation in rurality and rates of fluoride varnish.
To determine whether fluoride varnish applications during visits varied by rurality, we estimated a logistic regression model with the dependent variable indicating receipt of fluoride varnish during a medical visit. The primary explanatory variable was a three-level measure of rurality. The model also controlled for age, sex, insurance type, the county characteristics described above, and state and year fixed effects. We also estimated this model with an interaction between year and rurality to examine whether fluoride varnish applications changed over time within and between each rurality category. All models were estimated using county-level cluster robust standard errors.
Results are presented as odds ratios and as regression-adjusted predicted probabilities. We calculated predicted probabilities of fluoride application during a visit for each rurality category and for the interaction between year and each rurality category. To do so, we used model estimates to calculate adjusted probabilities of the outcome by computing the mean of predicted probabilities for the entire sample after setting county rurality to metropolitan, for example, while keeping all other covariates at their observed values. Standard errors for predicted probabilities were calculated using the delta method. Wald tests were used to compare regression-adjusted predictions, with metropolitan county and 2016 year of visit used as reference groups.
Analyses were conducted using Stata-MP version 16 (College Station, TX) and used a significance level of 0.05. This study was approved by the corresponding author’s Institutional Review Board and followed the Strengthening the Reporting of Observational Studies in Epidemiology (STORBE) reporting guideline.
Results
Among 328,661 well-child visits paid by private insurance, fluoride varnish was included in 4.3% of visits in metropolitan counties, 6.2% of visits in rural counties, and 10.3% of visits in remote rural counties nonadjacent to metropolitan areas (Table 1). Most visits (83.5%) were for children living in metropolitan counties. The age distribution of pediatric visits was similar across rurality, with most visits received by children younger than three years of age in metropolitan and rural counties.
Table 1.
Characteristics of Pediatric Well-Child Visits, by County Rurality
| County Rurality (N, %) | |||
|---|---|---|---|
| Metropolitan counties | Rural counties | Remote rural counties | |
| Visit included fluoride varnish | * | * | |
| No | 262,543 (95.7) | 39,528 (93.8) | 10,834 (89.7) |
| Yes | 11,915 (4.3) | 2,594 (6.2) | 1,247 (10.3) |
| Child age | * | * | |
| 1 year | 111,185 (40.5) | 16,646 (39.5) | 4,732 (39.2) |
| 2 years | 58,986 (21.5) | 8,855 (21.0) | 2,524 (20.9) |
| 3 years | 38,115 (13.9) | 6,370 (15.1) | 1,860 (15.4) |
| 4 years | 33,087 (12.1) | 5,102 (12.1) | 1,504 (12.5) |
| 5 years | 33,085 (12.1) | 5,149 (12.2) | 1,461 (12.1) |
| Child sex | |||
| Female | 133,119 (48.5) | 20,625 (49.0) | 5,916 (49.0) |
| Male | 141,339 (51.5) | 21,497 (51.0) | 6,165 (51.0) |
| Insurance type | * | * | |
| Exclusive Provider Organization | 3,885 (1.4) | 642 (1.5) | 110 (0.9) |
| Health Maintenance Organization | 64,491 (23.5) | 15,072 (35.8) | 4,486 (37.1) |
| Preferred Provider Organization | 146,920 (53.5) | 18,698 (44.4) | 5,655 (46.8) |
| Point of Service | 59,162 (21.6) | 7,710 (18.3) | 1,830 (15.2) |
| State | * | * | |
| Connecticut | 129,837 (47.3) | 4,825 (11.5) | 0 (0) |
| Maine | 52,527 (19.1) | 20,998 (49.9) | 6,649 (55.0) |
| New Hampshire | 42,853 (15.6) | 16,299 (38.7) | 5,432 (45.0) |
| Rhode Island | 49,241 (17.9) | 0 (0) | 0 (0) |
| Year | * | * | |
| 2016 | 91,882 (33.5) | 14,747 (35.0) | 4,527 (37.5) |
| 2017 | 92,913 (33.9) | 14,049 (33.4) | 3,930 (32.5) |
| 2018 | 89,663 (32.7) | 13,326 (31.6) | 3,624 (30.0) |
| Mean number of dentists per 10,000 county population (SD) | 7.0 (1.7) | 5.1 (1.6)* | 5.3 (2.0)* |
| Mean number of pediatricians per 10,000 county population (SD) | 2.3 (0.9) | 1.2 (0.5)* | 2.7 (2.4)* |
| Mean number of family medicine physicians per 10,000 county population (SD) | 2.3 (1.3) | 4.6 (2.3)* | 4.2 (1.0)* |
| Percent of county population insured by Medicaid (SD) | 14.7 (4.6) | 14.9 (3.8)* | 17.3 (5.6)* |
| N (%) | 274,458 (83.5) | 42,122 (12.8) | 12,081 (3.7) |
We compared the distribution of each variable for (1) metropolitan counties vs. rural counties and (2) metropolitan counties vs. remote rural counties. To obtain P-values for these comparisons, we used t-tests for continuous variables and chi-squared tests of independence for categorical variables.
P<0.001.
SD, standard deviation.
Figure 1 illustrates county-level variation in rurality (Panel A) and receipt of fluoride varnish during medical visits (Panel B). Counties in Rhode Island and Connecticut were primarily metropolitan (Panel A). Across these two states, only one county in Connecticut was not a metropolitan county. Most counties in Maine and New Hampshire were rural or rural remote. Of Maine’s 16 counties, five were metropolitan counties, eight were rural counties, and three were remote rural counties. Of New Hampshire’s 10 counties, three were metropolitan counties, four were rural counties, and three were remote rural counties. Counties with the highest rates of fluoride varnish applications during well-child visits were primarily located in Maine (Panel B). Among the 15 counties with the highest fluoride varnish rates, nine counties were located in Maine, six counties were rural, and four counties were rural remote.
Figure 1.
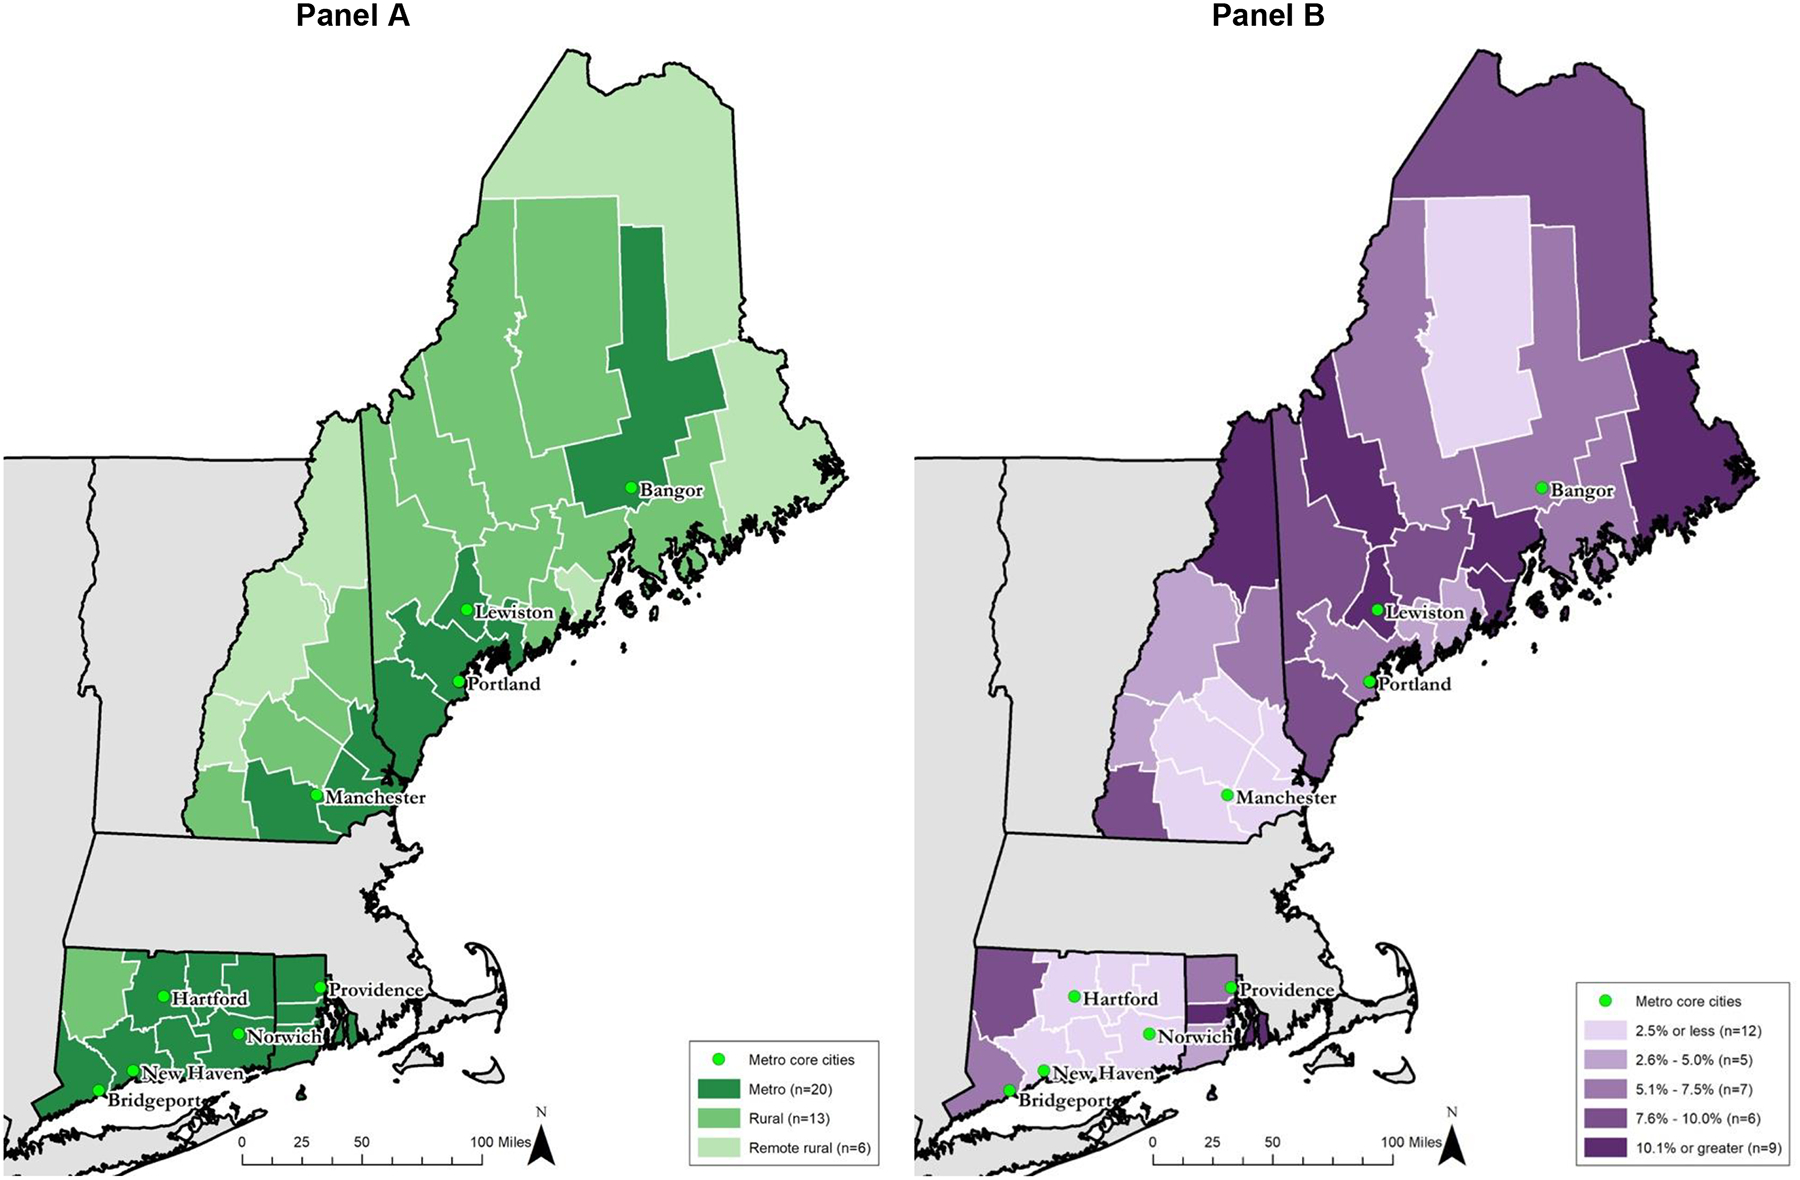
County-level variation in rurality (Panel A) and rates of well-child medical visits with fluoride varnish (Panel B)
In adjusted regression analyses, which controlled for state along with the aforementioned characteristics, we found that well-child visits for children living in rural and rural remote counties were more likely to include fluoride varnish than visits for children living in metropolitan counties (Table 2). The odds of a visit including fluoride varnish was 3.5 times greater in a rural remote county than in a metropolitan county (95% confidence interval (CI)=2.3–5.3, P<0.001) and 2.4 times greater in a rural county than in a metropolitan county (95% CI=1.4–4.0, P=0.001).
Table 2.
Odds of a well-child medical visit including fluoride varnish (N=328,661)
| Covariates | Odds Ratio | 95% Confidence Interval |
|---|---|---|
| County rurality (reference group = metropolitan) | ||
| Rural | 2.41*** | 1.44, 4.00 |
| Remote rural | 3.47*** | 2.25, 5.32 |
| Age (reference group = 1 year) | ||
| 2 | 1.48** | 1.16, 1.89 |
| 3 | 0.74 | 0.50, 1.08 |
| 4 | 0.13*** | 0.08, 0.22 |
| 5 | 0.07*** | 0.04, 0.12 |
| Sex (reference group = male) | ||
| Female | 0.99 | 0.95, 1.02 |
| Insurance Type (reference group = Exclusive Provider Organization) | ||
| Health Maintenance Organization | 0.85 | 0.69, 1.04 |
| Preferred Provider Organization | 0.81* | 0.66, 0.98 |
| Point of Service | 0.80* | 0.65, 0.97 |
| State (reference group = Connecticut) | ||
| Maine | 3.82*** | 1.72, 8.47 |
| New Hampshire | 0.67 | 0.29, 1.52 |
| Rhode Island | 4.57*** | 2.12, 9.83 |
| Year (reference group = 2016) | ||
| 2017 | 1.43** | 1.10, 1.84 |
| 2018 | 1.70*** | 1.28, 2.24 |
| County pediatricians per 10,000 population | 1.04 | 0.91, 1.17 |
| County family medicine physicians per 10,000 population | 0.87* | 0.76, 0.99 |
| County dentists per 10,000 population | 1.08 | 0.96, 1.20 |
| County % of population insured by Medicaid | 0.04 | 0.001, 3.03 |
| Intercept | 0.03*** | 0.01, 0.11 |
P<0.05,
P<0.01,
P<0.001.
McFadden’s adjusted R2=0.11. Standard errors clustered at the county-level.
Figure 2 shows regression-adjusted predicted probabilities of fluoride varnish application during a well-child visit by rurality. On average, a well-child medical visit in a remote rural county had a 12.0% predicted probability of including a fluoride varnish application (95% CI=7.7–16.4), which was significantly greater than the 4.1% predicted probability observed in a metropolitan county (95% CI=3.2–5.0, P<0.001). Similarly, a well-child medical visit in a rural county had an 8.9% predicted probability of including a fluoride varnish application (95% CI=5.4–12.4), which was significantly greater than the probability observed in a metropolitan county (P=0.007). The difference in regression-adjusted predicted probabilities of fluoride varnish application was not statistically significantly different for a visit in a rural county and a rural remote county (P=0.18).
Figure 2.

Adjusted predicted probabilities of well-child medical visits with fluoride varnish, by county rurality
Regression-adjusted predicted probabilities were derived from the regression model presented in Table 2. Wald tests were used to compare these predictions, with metro used as the reference group. *P<0.01 for comparison to metro counties. FV, fluoride varnish. Metro, metropolitan.
Figure 3 shows that the regression-adjusted predicted probabilities of fluoride varnish applications increased since 2016 in metropolitan and remote rural counties. In a metropolitan county, the predicted probability of a visit including fluoride varnish was significantly higher in 2017 than 2016 (4.4% vs. 3.0%, P=0.02) and significantly higher in 2018 than 2016 (5.0% vs. 3.0%, P=0.003). In a rural remote county, the predicted probability of a fluoride varnish application during a visit was significantly higher in 2017 than 2016 (13.5% vs. 9.7%, P=0.001). No other significant differences in predicted probabilities over time within categories of rurality were observed.
Figure 3.

Adjusted predicted probabilities of well-child medical visits with fluoride varnish, by county rurality and year
Regression-adjusted predicted probabilities were derived from the regression model described in the text, which includes an interaction between year and rurality. Wald tests were used to compare these predictions, with 2016 used as the reference group. *P<0.05 for within rurality comparisons to 2016. For example, in metropolitan counties, the regression-adjusted predicted probability of a fluoride varnish application was significantly higher in 2017 than 2016 (4.4% vs. 3.0%, P=0.02). FV, fluoride varnish. Metro, metropolitan.
Figure 3 also shows that the differences in predicted probabilities of fluoride varnish applications increased between metropolitan and remote rural counties over time. The difference in the probabilities of a fluoride varnish application in 2016 in metropolitan vs. remote rural counties increased significantly from 6.7 percentage points (95% CI=3.3–10.1) in 2016 to 9.1 percentage points in 2017 (95% CI=4.9, 13.2)—indicating increasingly higher rates in remote rural counties (P=0.001). No other significant changes in differences over time and across rurality were observed.
Discussion
This cross-sectional study using private medical claims data from four states in New England found significantly higher rates of fluoride varnish applications during medical visits in rural and remote rural counties than in metropolitan counties. Overall rates of fluoride varnish applications were low during 2016–2018, ranging from regression-adjusted probabilities of 4.1% in metropolitan counties to 12.0% in remote rural counties, suggesting that efforts are needed to increase fluoride varnish applications overall. Delivery of this service in medical settings may help children living in rural areas obtain needed preventive oral health services.
Our finding that young children living in rural and remote rural counties had the highest rates of fluoride varnish applications during medical visits is promising because of the challenges in accessing dental care and preventive oral health services encountered by children living in rural areas. Prior research has found that rates of annual preventive dental visits for children aged one to five years are lower in large rural areas (48.3%) compared with small rural areas (52.9%) and urban areas (55.3%) (7). Additionally, recent analysis of the 2017–18 National Survey of Child Health found that, compared to children living in urban areas, children living in rural areas were less likely to have teeth in “excellent or very good” condition and to report receiving fluoride treatment (inclusive of varnish and other fluoride treatments) (20). Although there are no studies, to our knowledge, that have examined delivery of fluoride varnish in medical settings to privately insured children by rurality, our findings that rates were highest in rural counties align with research by Okunseri and colleagues, which found higher rates of fluoride varnish applications in rural counties than urban counties among Wisconsin Medicaid-enrollees (17). Our findings, however, differ from Geiger and colleagues, who found that rates were higher for young Medicaid-enrollees in urban counties than rural counties (16). These differences may arise for several reasons, including that we examined different populations (we examined privately insured children), time periods (our data are more recent), and services (we examined fluoride varnish, the only preventive oral health service covered by health insurers). Together, our findings and prior research indicate that overall rates of fluoride varnish in medical settings for young children are very low, but that children in rural communities are benefitting from this evidence-based service.
While rates of fluoride varnish applications were lowest in metropolitan counties, the rate of visits with fluoride varnish in metropolitan counties increased since 2016. Only in metropolitan counties did we observe significant increases in rates in both 2017 and 2018 as compared to 2016. This trend may reflect an adjustment period for medical settings immediately following mandated coverage for fluoride varnish application by private insurers, which began in mid-2015. Prior research on Medicaid-enrolled children found that rates of preventive oral health services in medical settings increased over time after coverage was enacted (21). There may be less of an adjustment period in rural areas, where a higher percentage of the pediatric population is insured by Medicaid, if medical practices are already accustomed to providing fluoride varnish to their Medicaid-enrolled patients.
In considering the importance of these results, readers should keep in mind that fewer than five percent of overall well-child medical visits paid by private health insurers in these states included fluoride varnish. Increasing the delivery of fluoride varnish in medical offices, in both rural and metropolitan areas, is important for several reasons. First, rates of dental visits among young children are low (22), particularly among children in rural areas, despite professional recommendations that children visit a dentist at or before one year of age (23). Delivery of fluoride varnish in medical settings can facilitate access to preventive oral health services because children are more likely to receive medical than dental visits, at least in part because they are recommended to have frequent well-child medical visits during early childhood (24, 25) and rates of compliance with well-child visit recommendations are high in rural and non-rural areas (7). While financial barriers to dental care are common (26, 27), by requiring private health insurers to cover preventive services without cost sharing (i.e., no deductible and no co-payments), the Affordable Care Act has helped to eliminate financial barriers to preventive oral health services in medical settings for many children (5).
This study is the first, to our knowledge, to examine fluoride varnish applications in medical settings for a privately-insured population across rurality, revealing higher rates in rural communities. Our use of medical claims data allowed us to calculate rates of fluoride varnish received during medical visits, while controlling for important individual and county-level factors. There were several limitations to the analysis. Although we have a large sample of privately insured children from four New England states, these states may not be generalizable nationally. Additionally, there are numerous way to define rurality, and we acknowledge that using a county-level measure of rurality may mask heterogeneity of counties. We lacked sub-county geographic identifiers for most of our study sample, but we used the detailed RUC codes to distinguish between metropolitan, rural, and remote rural counties. Nationally, over the study period, nine to 13 percent of those with private insurance were covered by grandfathered plans, which are not subject to ACA requirements for coverage of preventive services (28, 29). Because we cannot identify these plans in the data, we assume that all insurance plans we observe should pay for fluoride varnish. However, this type of complication in insurance coverage for fluoride varnish may be a potential barrier to medical provider delivery of fluoride varnish.
We also examined only fluoride varnish applied during well-child visits, rather than including all fluoride varnish applications in the medical setting (e.g., during sick visits). Although this restriction may miss some fluoride varnish applications, the vast majority of fluoride varnish applications paid by health insurers occur during well-child medical visits, with only 8% of fluoride varnish applications occurring outside of well-child medical visits (authors’ calculations). Given the overall very low rates of fluoride varnish receipt, changing the restriction of services received during the well-child medical visit would not meaningfully change the fluoride varnish rates we observed. Furthermore, we did not have information about whether children were receiving fluoride varnish applications elsewhere (e.g., dentist office); however, the US Preventive Services Task Force recommends all children less than six years of age receive fluoride varnish in medical settings, whether or not they have a dental home (2, 3). Because studies suggest that children need to receive multiple applications of fluoride varnish or other preventive dental care to reduce caries and caries-related treatment (30, 31), additional research should examine how many children receive fluoride varnish in medical settings and how many applications each child receives. Future research is also needed to examine the number of medical providers who apply fluoride varnish to understand where they are located and how volume of applications varies across providers.
A variety of strategies are likely needed to increase rates of young children receiving fluoride varnish. Evidence from Medicaid suggests that requiring medical providers to obtain training related to oral health prior to delivering fluoride varnish and paying more can substantially increase receipt of fluoride varnish in medical settings (21, 32). It remains unknown if these factors impact privately-insured children’s receipt of fluoride varnish. The Centers for Medicare & Medicaid Services recently reaffirmed commitment to their Oral Health Initiative, which launched in 2010 (33). This effort aims to increase Medicaid-enrolled children’s receipt of preventive dental care, including fluoride varnish, and has the potential to increase access to fluoride varnish for privately insured children if more medical practices deliver this service to their entire patient panel.
Conclusion
Our results provide new evidence on variation in the rates of fluoride varnish applications during pediatric medical visits. Fluoride varnish applications are recommended by the US Preventive Services Task Force and private health plans are required to cover it without cost-sharing. We found that well-child medical visits in rural areas were more likely to include fluoride varnish applications than visits in urban areas. This finding suggests delivery of preventive oral health services outside of traditional dental settings may help to expand access to care for a population with high dental needs and poor access to dental care. Although overall rates of fluoride varnish applications were low, these results suggest increased delivery of this service is critical for addressing rural oral health disparities and children’s overall well-being.
Supplementary Material
Acknowledgements:
The authors extend thanks to Teague Ruder and Brenna O’Neill, both from the RAND Corporation, for assistance with mapping and statistical programming, respectively. This research was supported by the National Institute of Dental and Craniofacial Research [grant number R01 DE028530-01A1]. The content is solely the responsibility of the authors and does not necessarily represent the official views of the National Institute of Dental and Craniofacial Research or the National Institutes of Health. The funding source had no involvement in study design; collection, analysis, and interpretation of data; the writing of the report; nor in the decision to submit the article for publication.
References
- 1.Marinho VC, Worthington HV, Walsh T, Clarkson JE. Fluoride varnishes for preventing dental caries in children and adolescents. Cochrane Database Syst Rev. 2013(7):CD002279. [DOI] [PMC free article] [PubMed] [Google Scholar]
- 2.Moyer VA, US Preventive Services Task Force. Prevention of dental caries in children from birth through age 5 years: US Preventive Services Task Force recommendation statement. Pediatrics. 2014;133(6):1102–11. [DOI] [PubMed] [Google Scholar]
- 3.Davidson KW, Barry MJ, Mangione CM, Cabana M, Caughey AB, Davis EM, et al. Screening and interventions to prevent dental caries in children younger than 5 years: US Preventive Services Task Force recommendation statement. JAMA. 2021;326(21):2172–8. [DOI] [PubMed] [Google Scholar]
- 4.Sams LD, Rozier RG, Wilder RS, Quinonez RB. Adoption and implementation of policies to support preventive dentistry initiatives for physicians: a national survey of Medicaid programs. Am J Public Health. 2013;103(8):e83–90. [DOI] [PMC free article] [PubMed] [Google Scholar]
- 5.HealthCare.Gov. Preventive care benefits for children [Website]. US Center for Medicare & Medicaid Services: Baltimore, MD; 2021. [ [Google Scholar]
- 6.Simon L, Karhade DS, Fox K, Barrow J, Palmer N. Dental Services Utilization by Rurality Among Privately Insured Children in the United States. Pediatr Dent. 2020;42(5):387–91. [PubMed] [Google Scholar]
- 7.Health Resources and Services Administration, Maternal and Child Health Bureau. The health and wellbeing of children in rural areas Rockville, MD: U.S. Department of Health and Human Services; 2015. [Available from: https://mchb.hrsa.gov/sites/default/files/mchb/Data/NSCH/nsch11-12-health-well-child-rural-apr2015.pdf. [Google Scholar]
- 8.Designated Health Professional Shortage Areas Statistics, First Quarter of Fiscal Year 2021 Rockville, MD: Health Resources and Services Administration; March 31, 2021. [Available from: https://www.google.com/url?sa=t&rct=j&q=&esrc=s&source=web&cd=&ved=2ahUKEwjOtNSb1-PwAhXBGVkFHYA3CwgQFjAAegQIBRAD&url=https%3A%2F%2Fdata.hrsa.gov%2FDefault%2FGenerateHPSAQuarterlyReport&usg=AOvVaw1LT8qWBehcYcTuxRIrUkEe. [Google Scholar]
- 9.Garg S, Rubin T, Jasek J, Weinstein J, Helburn L, Kaye K. How willing are dentists to treat young children? A survet of dentists affiliated with Medicaid managed care in New York, 2010. J Am Dent Assoc. 2013;144(4):416–25. [DOI] [PubMed] [Google Scholar]
- 10.McFarland KK, Salama F, Yaseen M. Access to dental care for rural children: a survey of Nebraska general dentists. J Rural Health. 2011;27(2):205–10. [DOI] [PubMed] [Google Scholar]
- 11.McKernan SC, Pooley MJ, Momany ET, Kuthy RA. Travel burden and dentist bypass among dentally insured children. J Public Health Dent. 2016;76(3):220–7. [DOI] [PubMed] [Google Scholar]
- 12.Jackson SL, Vann WF Jr., Kotch JB, Pahel BT, Lee JY. Impact of poor oral health on children’s school attendance and performance. Am J Public Health. 2011;101(10):1900–6. [DOI] [PMC free article] [PubMed] [Google Scholar]
- 13.Abanto J, Carvalho T, Mendes F, Wanderley M, Bönecker M, Raggio D. Impact of oral diseases and disorders on oral health‐related quality of life of preschool children. Community Dent Oral Epidemiol. 2011;39(2):105–14. [DOI] [PubMed] [Google Scholar]
- 14.Stella MY, Bellamy HA, Kogan MD, Dunbar JL, Schwalberg RH, Schuster MA. Factors that influence receipt of recommended preventive pediatric health and dental care. Pediatrics. 2002;110(6):e73–e. [DOI] [PubMed] [Google Scholar]
- 15.Bright Futures/American Academy of Pediatrics. Recommendations for Preventive Pediatric Health Care Elk Grove Village (IL)2021. [Available from: https://downloads.aap.org/AAP/PDF/periodicity_schedule.pdf. [Google Scholar]
- 16.Geiger CK, Kranz AM, Dick AW, Duffy E, Sorbero M, Stein BD. Delivery of Preventive Oral Health Services by Rurality: A Cross-Sectional Analysis. J Rural Health. 2019;35(1):3–11. [DOI] [PMC free article] [PubMed] [Google Scholar]
- 17.Okunseri C, Szabo A, Garcia RI, Jackson S, Pajewski NM. Provision of fluoride varnish treatment by medical and dental care providers: variation by race/ethnicity and levels of urban influence. J Public Health Dent. 2010;70(3):211–9. [DOI] [PMC free article] [PubMed] [Google Scholar]
- 18.Bright Futures. Early childhood visits Itasca, IL: American Academy of Pediatrics; 2017. [Available from: https://brightfutures.aap.org/Bright%20Futures%20Documents/BF4_EarlyChildhoodVisits.pdf. [Google Scholar]
- 19.Rural-Urban Continuum Codes Washington, DC:: USDA Economic Research Service; December 10, 2020. [Available from: https://www.ers.usda.gov/data-products/rural-urban-continuum-codes.aspx. [Google Scholar]
- 20.Crouch E, Nelson J, Merrell MA, Martin A. The oral health status of America’s rural children: An opportunity for policy change. J Public Health Dent. 2021;81(4):251–60. [DOI] [PubMed] [Google Scholar]
- 21.Goldstein EV, Dick AW, Ross R, Stein BD, Kranz AM. Impact of state‐level training requirements for medical providers on receipt of preventive oral health services for young children enrolled in Medicaid. Journal of Public Health Dentistry. 2021: 10.1111/jphd.12442. [DOI] [PMC free article] [PubMed] [Google Scholar]
- 22.Medicaid and CHIP Payment and Access Commission. Medicaid Access in Brief: Children’s Dental Services. MacPac; 2016. [Google Scholar]
- 23.American Academy of Pediatric Dentistry. Periodicity of examination, preventive dental services, anticipatory guidance/ counseling, and oral treatment for infants, children, and adolescents. Chicago, IL: American Academy of Pediatric Dentistry; 2020. [Google Scholar]
- 24.Lebrun-Harris L, Canto M, Vodicka P. Preventative oral health care use and oral health status among US children: 2016 National Survey of Children’s Health. The Journal of the American Dental Association. 2019;150(4):246–58. [DOI] [PubMed] [Google Scholar]
- 25.Bright Futures, American Academy of Pediatrics. Recommendations for Preventive Pediatric Health Care Elk Grove Village, IL: American Academy of Pediatrics; 2017. [February 20, 2021]. Available from: https://www.aap.org/en-us/documents/periodicity_schedule_oral_health.pdf. [Google Scholar]
- 26.Zhou J, Elyasi M, Amin M. Associations among dental insurance, dental visits, and unmet needs of US children. The Journal of the American Dental Association. 2017;148(2):92–9. [DOI] [PubMed] [Google Scholar]
- 27.Karaca-Mandic P, Choi-Yoo SJ, Lee J, Scal P. Family out-of-pocket health care burden and children’s unmet needs or delayed health care. Acad Pediatr. 2014;14(1):101–8. [DOI] [PubMed] [Google Scholar]
- 28.Kaiser Family Foundation. Section 13: Grandfathered Health Plans Kaiser Family Foundation: Kaiser Family Foundation; 2019. [Available from: https://www.kff.org/report-section/ehbs-2019-section-13-grandfathered-health-plans/. [Google Scholar]
- 29.Kaiser Family Foundation. Health Insurance Coverage of the Total Population Kaiser Family Foundation: Kaiser Family Foundation; 2019. [Available from: https://www.kff.org/other/state-indicator/total-population/?currentTimeframe=0&sortModel=%7B%22colId%22:%22Location%22,%22sort%22:%22asc%22%7D. [Google Scholar]
- 30.Kranz AM, Preisser JS, Rozier RG. Effects of physician-based preventive oral health services on dental caries. Pediatrics. 2015;136(1):107–14. [DOI] [PMC free article] [PubMed] [Google Scholar]
- 31.Blackburn J, Morrisey MA, Sen B. Outcomes associated with early preventive dental care among Medicaid-enrolled children in Alabama. JAMA pediatrics. 2017;171(4):335–41. [DOI] [PMC free article] [PubMed] [Google Scholar]
- 32.Kranz AM, Opper IM, Stein BD, Ruder T, Gahlon G, Sorbero M, et al. Medicaid Payment and Fluoride Varnish Application during Pediatric Medical Visits. Medical Care Research and Review. Accepted 2021. [DOI] [PMC free article] [PubMed] [Google Scholar]
- 33.Center for Medicaid and CHIP Services. CMS Oral Health Initiative and Dental Technical Support Opportunity Baltimore, MD: Centers for Medicare and Medicaid Services; June 2020. [Available from: https://www.hhs.gov/guidance/document/cms-oral-health-initiative-and-dental-technical-support-opportunity. [Google Scholar]
Associated Data
This section collects any data citations, data availability statements, or supplementary materials included in this article.