

Abstract
PURPOSE:
To compare the differences in retinal vessel density (VD) between topical administration of latanoprostene bunod (LBN) ophthalmic solution 0.024% and timolol maleate 0.5% in patients with open-angle glaucoma (OAG) or ocular hypertension (OHT) and normal subjects.
DESIGN:
Randomized, single center, crossover clinical trial.
METHODS:
Eligible subjects were examined during 6 study visits over 12 weeks. All subjects were randomized in a 1:1 ratio to LBN dosed once daily or timolol dosed twice daily in both eyes (OU) for a duration of 4 weeks each, separated by a 2-week washout period. A comprehensive eye examination OU was performed at each visit. Testing was performed with optical coherence tomography and optical coherence tomography angiography (optic nerve and macula), as well as visual field examination, on the study eye at baseline and before and after each treatment.
RESULTS:
One eye from each of 50 patients was enrolled (10 healthy patients, 26 patients with OHT, and 14 patients with OAG). After administration of LBN there was significantly increased macular VD (0.76% [0.20%–1.33%], P = 0.009) and a trend in increasing peripapillary VD in patients with OAG and patients with OHT. In contrast, after administration of timolol, there were no differences in macular VD, and a decrease in peripapillary VD only was observed in the nasal inferior sector (−0.56% [−1.08% to −0.03%], P = .04) in patients with OAG and patients with OHT. No change in peripapillary or macular VD was observed in the normal subjects (P > .05 for all).
CONCLUSIONS:
Topical administration of LBN enhanced macular VD in patients with OAG or patients with OHT. In contrast, timolol administration did not have any effect on VD.
Glaucoma, a multifactorial optic neuropathy,1 is a leading cause of irreversible blindness worldwide. Elevated intraocular pressure (IOP) is considered a major risk factor for the pathogenesis of glaucomatous visual field (VF) loss. Lowering IOP slows the progression of VF loss in patients with open-angle glaucoma (OAG) and reduces the risk of onset of OAG in patients with ocular hypertension (OHT).2–5 To date, reduction of IOP is the only proven method to treat glaucoma,6 and pharmacologic reduction of IOP is the most common initial treatment in patients with OAG or OHT.7
Several classes of topical ocular hypotensive agents are used for the treatment of OAG and OHT. One class of drugs is β-adrenergic receptor antagonists that includes timolol maleate. The administration of timolol lowers IOP by decreasing the production of aqueous humor. Another class of ocular hypotensive agents is the prostaglandin analogs, including latanoprost.8–11 This class of agents increases aqueous humor outflow through the uveoscleral pathway and possibly the trabecular meshwork.12–15 Latanoprostene bunod (LBN) is a prostaglandin analog similar to latanoprost that also has a nitric oxide (NO)–donating moiety. Both latanoprost acid and NO lower IOP in humans.16–20 Moreover, NO activates a signaling cascade that results in the relaxation of smooth muscle cells and contributes to basal retinal vascular tone in humans.21
In addition to IOP, there is increasing evidence that abnormalities in retinal vasculature and blood flow are involved in the pathogenesis of glaucoma.5,22–24 It has been proposed that high IOP or other risk factors (eg, vascular dysregulation) can diminish ocular blood flow, particularly in susceptible individuals.24,25 Previous studies have investigated the effect of topical ocular hypotensive medications on microcirculation and observed an improvement in the perfusion of the optic disc and retina in patients with OAG. Kiseleva and associates26 reported the effects of topical latanoprost and a combination of dorzolamide/timolol on the optic nerve head (ONH) and retinal and choroidal microcirculation. They observed an improvement of ocular hemodynamics using latanoprost in patients with POAG, which was related to its IOP-lowering effect. No changes were observed using the combination of dorzolamide/timolol.26 Conversely, Takusagawa and associates27 reported that topical beta-blocker administration caused lower macular VD (3.3%) compared with prostaglandins, carbonic anhydrase inhibitors, and alpha agonists.
Several studies using optical coherence tomography angiography (OCT-A) have reported that alterations in the microvasculature, including vessel density (VD), are detectable in the optic nerve and macula of glaucomatous eyes.28–31 Moreover, some topical ocular hypotensive medications, but not all, previously have been shown to influence VD. For instance, ripasudil, a topical Rho-assisted coiled-coil forming protein kinase inhibitor, improved VD in the peripapillary retina of patients with POAG and patients with OHT, while brimonidine, an alpha 2 agonist, had no effect.32 Similarly, a recent study evaluated the response of VD to topical brimonidine, dorzolamide, and carteolol in patients with normal-tension glaucoma and did not find any change in the microcirculation with brimonidine. In this study, however, topical dorzolamide and carteolol, a beta-blocking agent similar to timolol, had different effects on VD of the peripapillary retina; dorzolamide enhanced VD and carteolol decreased VD.33 Therefore, there is considerable interest in understanding the potential ocular hemodynamic effects of available ocular hypotensive drugs and whether this might influence glaucoma progression.
The purpose of this investigation was to compare the effect of topical LBN ophthalmic solution 0.024% dosed once daily and timolol maleate ophthalmic solution 0.5% dosed twice daily on the peripapillary and macular VD.
METHODS
All research conformed to the tenets of the Declaration of Helsinki and the Health Insurance Portability and Accountability Act and was authorized by the institutional review boards at the University of California, San Diego. Informed consent was obtained from all study subjects. The registration information for this human clinical trial is available at http://www.clinicaltrials.gov (identifier NCT03931317).
STUDY POPULATION:
Forty subjects with OAG (n = 14) or OHT (n = 26) and 10 healthy participants were evaluated in this randomized, single-center, investigator-masked treatment, crossover study. Subjects were randomized in a 1:1 ratio to 1 of 2 treatment sequences: LBN 0.024% once daily and timolol maleate 0.5% twice a day, which were dispensed by 1 technician. The investigator who performed the examination and imaging was masked to treatment. Each treatment sequence consisted of two 4-week treatment periods, separated by a 2-week washout period.
Inclusion criteria at study entry were age >40 years, open angles on gonioscopy, diagnosis of OAG (including primary, pigmentary, or pseudoexfoliative glaucoma) or OHT in 1 or both eyes, intraocular pressure ≥22 mm Hg in ≥1 eye, and ≤36 mm Hg in both eyes in treatment-naïve subjects at the screening visit (visit 1) and pretreated subjects at the end of the washout period (visit 2). Patients with no ocular diseases were included in the normal group.
Subjects with a central corneal thickness >600 μm in either eye, significant corneal surface abnormalities, such as severe dry eye, angle-closure, advanced or secondary glaucoma, active optic disc hemorrhage, nonglaucomatous optic neuropathy, coexisting retinal diseases, any intraocular infection, inflammation, laser, incisional ocular surgery, or trauma in either eye within 3 months before the screening visit were excluded from the study.
Glaucomatous eyes were defined as having repeatable glaucomatous VF loss that was consistent with glaucomatous structural damage (ie, neuroretinal rim thinning, cupping, and/or retinal nerve fiber layer [RNFL] loss on ONH stereophotography). Glaucomatous VF damage was defined as glaucoma hemifield test and pattern standard deviation outside 95% normal limits confirmed on a minimum of 2 consecutive reliable tests with fixation losses and false-negatives ≤33% and false-positives ≤15%. Patients with OHT were required to have a postwashout IOP ≥22 mm Hg, a normal-appearing optic disc with intact neuroretinal rim and RNFL, and ≥2 normal reliable VF tests. Healthy subjects were required to have IOP ≤21 mm Hg and no structural abnormalities or functional loss.
STUDY VISITS:
Eligible subjects were seen for ≤6 study visits over the course of approximately 12 weeks for treatment-naïve subjects and approximately 12 to 19 weeks for pretreated subjects, who required a minimum 28-day washout period.
All subjects were screened before treatment randomization to confirm that they met the subject selection and preliminary eligibility criteria during the first visit (screening visit; visit 1, performed by M.S.). During the same visit, subjects underwent a comprehensive ophthalmic examination, including refraction (visit 1 only), best-corrected visual acuity using an Early Treatment of Diabetic Retinopathy Study logarithm of the minimum angle of resolution chart, slit-lamp biomicroscopy, IOP using Goldmann applanation tonometry, gonioscopy (visit 1 only), pachymetry (visit 1 only), and dilated fundus examination. In addition, vital signs (resting blood pressure and heart rate) were recorded in a sitting position.
Eligible pretreated subjects were asked to discontinue their current IOP medication 28 to 56 days before starting the randomized treatment depending on the pharmacologic class of their IOP-lowering therapy. IOP was measured at the end of the washout period for these subjects (visit 2). For patients with OAG/OHT, the study eye was the eye with the highest IOP value at visit 1 (treatment-naïve subjects) or visit 2 (pretreated subjects). If both eyes had the same IOP value, the right eye was chosen to be the study eye. For normal subjects, the study eye was the one with the highest IOP value at visit 1. Both eyes of each subject were treated for the duration of the study.
During the remaining visits (visits 3–6), all subjects underwent a comprehensive ophthalmic examination for both eyes. In addition, they all had optic disc and macula OCT-A (Avanti Angiovue [performed postdilation]), OCT (Avanti Angiovue [postdilation]), stereophotography (postdilation), Humphrey Field Analyzer SITA standard 24–2 and 10–2 (Carl Zeiss Meditec), and Swedish Interactive Thresholding Algorithm VF testing (predilation) for the study eye. ONH and macula OCT-A were repeated 2 hours after the initial OCT-A measurement for all subjects. Any adverse systemic and ocular events and vital signs were recorded on each visit. All measurements were made around the same time of the day.
During visit 3 and after performing a comprehensive examination, baseline imaging, and VF tests, subjects were randomized to 1 of the 2 treatment sequences and were instructed to take LBN once daily in the evening at approximately 8 pm, or timolol twice daily in the morning at approximately 8 am and the evening at approximately 8 pm for 4 weeks. After performing the same required measurements at visit 4, subjects were instructed to stop the IOP-lowering medication for 2 weeks to wash out the effect of the current topical treatment. All measurements were repeated after the washout period during visit 5. At the end of that visit, the second study drug was dispensed, and administration instructions were given to each subject. The same examination and imaging protocols were repeated on the final visit (visit 6; Figure 1 and Supplemental Figure S1).
FIGURE 1.
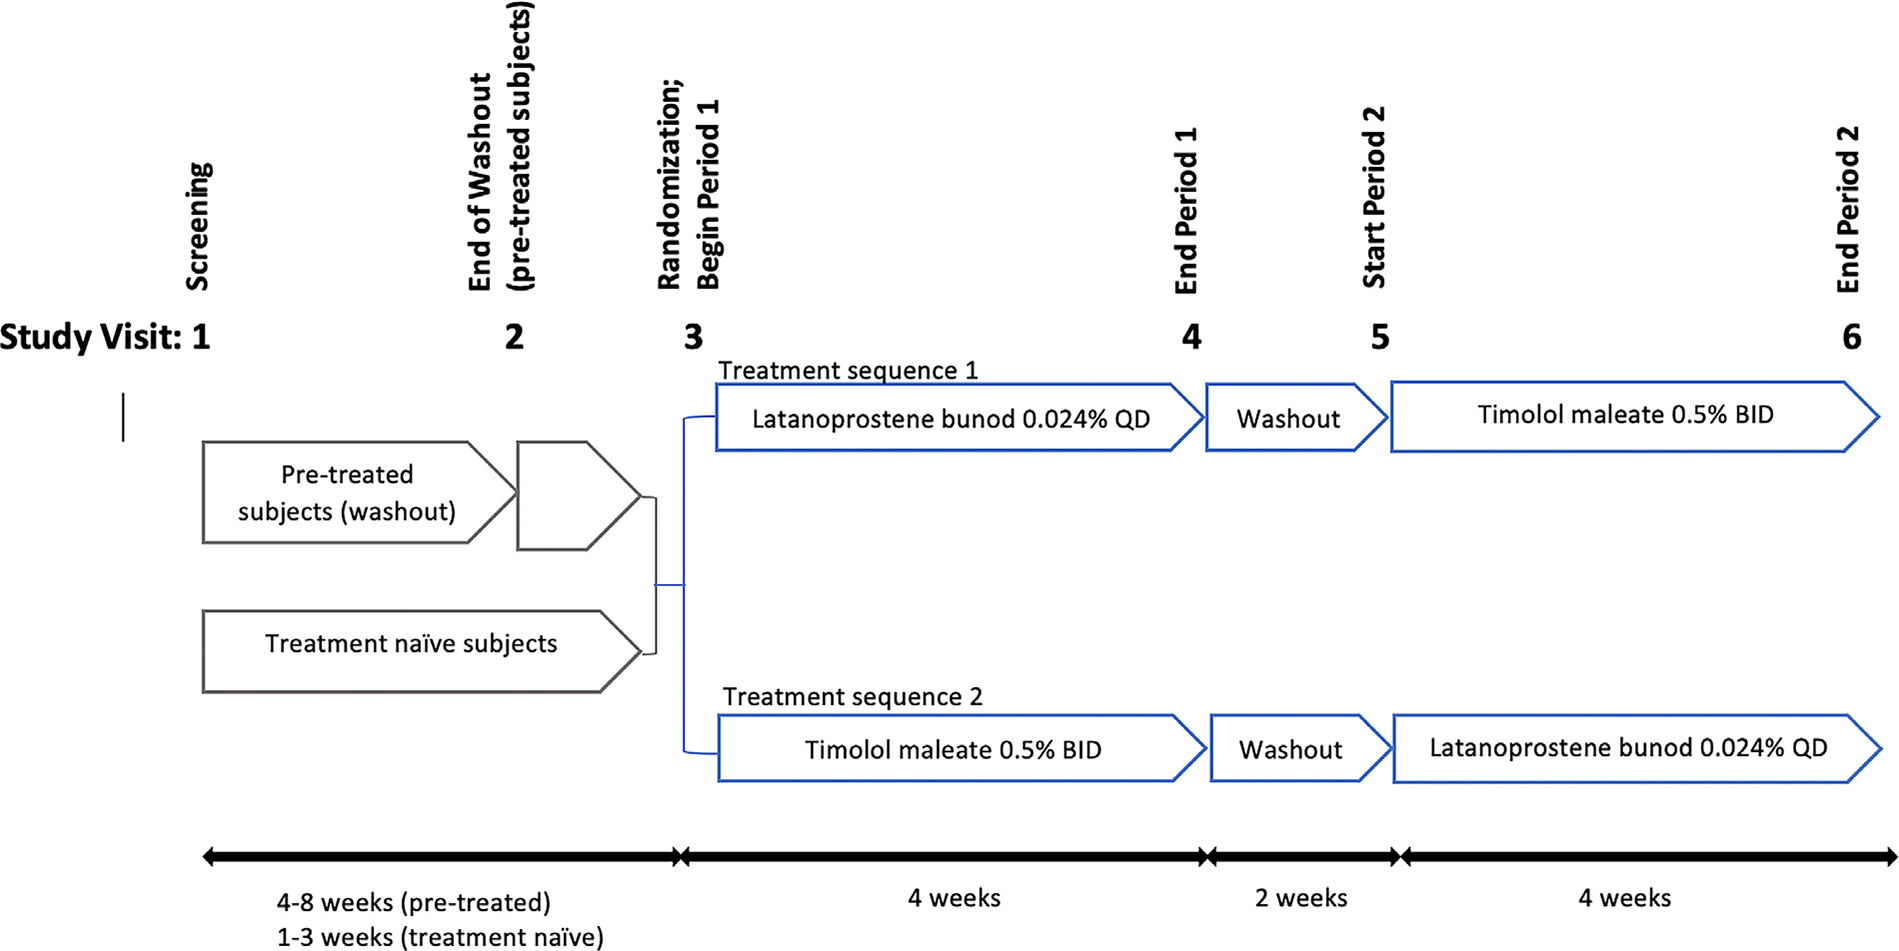
Schematic of the study design.
OCT-A IMAGING AND PROCESSING:
OCT-A imaging was performed using the Avanti Angiovue system (OptoVue Inc,; software version 2017.1.0.151). This technique provides a noninvasive high-resolution visualization of the retinal capillary vasculature using the split-spectrum amplitude decorrelation angiography algorithm that detects red blood cell motion by measuring differences in the reflectance amplitude between consecutive B-scans.34 Vascular information is characterized as percentage VD, which is calculated as the percentage of measured area occupied by flowing blood vessels.
High-density (HD) 4.5- × 4.5-mm2 ONH and 6- × 6-mm2 macula OCT-A scans were acquired. The scans consisted of merged Fast-X volume of 400 horizontal B-scans of 400 A-scans per B-scan and Fast-Y volume of 400 vertical B-scans of 400 A-scans per B-scan. In the ONH OCT-A images, whole image (wi) and peripapillary capillary densities were derived. Macular wiVD, parafoveal VD (pfVD), and foveal avascular zone including area and perimeter were derived from the macula OCT-A images.
Due to the importance of superficial capillary plexus layer in glaucoma diagnosis and progression and its better diagnostic accuracy for detecting glaucoma than deep capillary plexus layer,27,30,35,36 VD measurements were only evaluated in the superficial capillary plexus layer.
The image quality of all scans was reviewed by a trained grader (N.W.E.), who followed the standard protocol of the Imaging Data Evaluation and Analysis Reading Center at the University of California at San Diego. Scans with poor quality, which were defined as image quality <4 (1 = minimum, 10 = maximum), Signal Strength Index (SSI) <48, poor clarity images, residual motion artifacts, uncorrectable RNFL segmentation errors, or local weak signal, were excluded.
STATISTICAL ANALYSIS:
Patient and eye characteristics were presented as mean (95% confidence intervals [CIs]) for continuous data and count (percentage) for categorical data. Significance across randomized groups was determined using 2-sample t tests and the Fisher exact test for continuous and categorical variables. Random allocation sequence was determined by generating a random drug list in R statistical software by a statistician (software available at http://www.R-project.org/).
Conjunctival hyperemia was also summarized using descriptive statistics for discrete variables for safety analyses.
The differences in VD, foveal avascular zone, retinal thickness, best-corrected visual acuity, and vital signs from the start to the end of the treatment period for each treatment group and between the 2 treatment groups (LBN 0.024% minus timolol maleate 0.5%) were compared using linear mixed-effects models, with fixed effect terms for treatment, period, and randomization sequence, and a within-participant random intercept. The 2-sided 95% CI for the difference and the P values were also calculated. P < .05 was considered statistically significant. All statistical analyses were performed using R statistical software.
RESULTS
The study included patients with OHT (n = 26, 52.0%) and OAG (n = 14, 28.0%; n = 12 POAG and n = 2 pseudoexfoliation), as well as healthy eyes (n = 10, 20.0%). Patient demographic data and ophthalmic measurements stratified by drug randomization are shown in Table 1. There were no differences in any patient and eye characteristics among the stratified groups (P values ranged from .05–1.00). Recruitment started between December 2018 and February 2021 and follow-up assessments ended in May 2021. We chose to include combined data from all subjects because the results were similar among the separate groups (diseased vs healthy eyes).
TABLE 1.
Patient Demographic and Clinical Characteristics
| LBN → Timolol (Tx Sequence 1), n = 24 | Timolol → LBN (Tx Sequence 2), n = 26 | Overall, N = 50 | P Valuea | |
|---|---|---|---|---|
|
| ||||
| Patient characteristics | ||||
| Age (y) (95% CI) | 66.7 (63.4–70.1) | 68.4 (64.8–72.1) | 676 (65.2–70.1) | .48 |
| Gender, n (%) | ||||
| Female | 14 (60.9) | 19 (70.4) | 33 (66.0) | .56 |
| Male | 9 (39.1) | 8 (29.6) | 17 (34.0) | |
| Ethnicity, n (%) | ||||
| African American | 1 (4.3) | 1 (3.7) | 2 (4.0) | .30 |
| Asian | 0 (0.0) | 2 (7.4) | 2 (4.0) | |
| White | 17 (73.9) | 22 (81.5) | 39 (78.0) | |
| Other | 5 (21.7) | 2 (7.4) | 7 (14.0) | |
| Hypertension, n (%) | ||||
| No | 16 (69.6) | 18 (66.7) | 34 (68.0) | 1.00 |
| Yes | 7 (30.4) | 9 (33.3) | 16 (32.0) | |
| Diabetes, n (%) | ||||
| No | 22 (95.7) | 27 (100.0) | 49 (98.0) | .46 |
| Yes | 1 (4.3) | 0 (0.0) | 1 (2.0) | |
| Eye Characteristics (95% CI) | ||||
| 24-2 MD | −1.04 (−2.35 to 0.27) | −1.22 (−2.02 to −0.41) | −1.14 (−1.85 to −0.42) | .81 |
| 24-2 PSD | 2.59 (1.61–3.58) | 1.91 (1.74–2.08) | 2.22 (1.77–2.67) | .17 |
| 10-2 MD | −0.67 (−1.68 to 0.33) | −0.75 (−1.51 to 0.02) | −0.71 (−1.31 to −0.12) | .90 |
| 10-2 PSD | 2.08 (0.86–3.30) | 1.36 (1.23–1.48) | 1.67 (1.15–2.19) | .23 |
| Baseline IOP (mm Hg) | 22.3 (19.9–24.8) | 25.2 (21.3–29.1) | 23.9 (21.5–26.2) | .21 |
| Baseline CCT (μm) | 564.4 (552.2–576.6) | 548.5 (537.6–559.4) | 555.8 (5476–564.0) | .05 |
| Eye classification, n (%) | ||||
| Glaucoma | 6 (26.1) | 8 (29.6) | 14 (28.0) | .94 |
| Healthy | 5 (21.7) | 5 (18.5) | 10 (20.0) | |
| Ocular hypertension | 12 (52.2) | 14 (51.9) | 26 (52.0) | |
CCT = central corneal thickness; CI = confidence interval; IOP = intraocular pressure; LBN = latanoprostene bunod; MD = mean deviation; PSD = pattern standard deviation; Tx = treatment.
P < .05 is considered statistically significant
Baseline systemic blood pressure for patients starting on timolol first was 126.1 mm Hg (119.0–133.2 mm Hg) (systolic) and 84.0 mm Hg (79.4–88.6 mmHg) (diastolic) and for patients starting on LBN first was 134.3 mm Hg (127.8–140.8 mm Hg) (systolic) and 87.1 mm Hg (82.4–91.8 mm Hg) (diastolic) (Psystolic = .09, Pdiastolic = .33). Baseline heart rate for patients starting on timolol first was 73.3 beats/min (70.0–76.7 beats/min) and for patients starting on LBN first was 74.2 beats/min (68.0–80.4 beats/min) (P = .81).
Blood pressure did not change after timolol use (systolic: −0.5 mm Hg [−3.6 to 4.5 mm Hg], P = .81; diastolic: −1.1 mm Hg [−4.4 to 2.2 mm Hg], P = .51) or LBN use (systolic: −1.9 mm Hg [−5.9 to 2.1 mm Hg], P = .36; diastolic: −1.4 mm Hg [4.7–2.0 mm Hg], P = .42). Alternatively, heart rate (beats/min) significantly decreased after timolol use (−4.1 beats/min [−6.4 to −1.7 beats/min], P = .001) but not LBN use (0.6 beats/min [−1.7 to 3.0 beats/min], P = .60; Supplemental Table S1).
IOP was lower after timolol and LBN applications. The differences in IOP (95% CI) post-timolol and post-LBN were −5.3 mm Hg (−8.6 to −1.9 mm Hg; P = .002) and −7.2 mm Hg [−10.1 to −4.2 mm Hg, P < .001), respectively. Although not statistically significant, the IOP difference was larger after LBN use when compared with timolol (−1.9 mm Hg [−4.9 to 1.0 mm Hg; P = .2]). No worsening in best-corrected visual acuity was observed after either medication use (Supplemental Table S1).
The percentage of study or fellow treated eyes experiencing conjunctival hyperemia was slightly higher in the LBN group (study eye: 8.0 %, fellow eye: 6.0 %) compared with the timolol group (study eye: 4.0 %, fellow eye: 2.0%; Supplemental Table S1). All other ocular adverse effects, including stinging, eye irritation, dry eye, and/or eye pain, were similar between LBN and timolol (P > .05). All ocular adverse effects were considered mild in severity and no systemic adverse effects were reported.
Although there was a general trend of peripapillary capillary density (CD) decrease post-timolol, the differences in CD did not reach statistical significance (P > .05 for all; Table 2) in any region, except for the nasal inferior peripapillary sector (−0.56% [−1.08% to −0.03%], P = .04). There was a trend of peripapillary CD enhancement for most regions after LBN use (P > .05 for all; Table 2). Moreover, there was a trend of increased peripapillary CD with LBN compared with timolol (wiCD: 0.37% [−0.03% to 0.77%], P = .07).
TABLE 2.
Difference in Capillary Density From Optic Nerve Head Scans After Timolol Use, After Latanoprostene Bunod Use, and Between Timolol and Latanoprostene Bunod
| Timolol vs Baseline | P Value | LBN vs Baseline | P Value | LBN vs Timolol | P Value | |
|---|---|---|---|---|---|---|
|
| ||||||
| Capillary density (%) (95% CI) | ||||||
| Whole image | −0.16 (−0.51 to 0.18) | .36 | 0.17 (−0.19 to 0.53) | .35 | 0.37 (−0.03 to 0.77) | .07 |
| Peripapillary | −0.11 (−0.49 to 0.28) | .59 | 0.04 (−0.34 to 0.43) | .84 | 0.20 (−0.24 to 0.63) | .38 |
| Superior hemi | −0.08 (−0.47 to 0.30) | .68 | 0.09 (−0.31 to 0.48) | .67 | 0.25 (−0.22 to 0.72) | .30 |
| Inferior hemi | −0.14 (−0.58 to 0.31) | .54 | −0.01 (−0.45 to 0.44) | .97 | 0.14 (−0.33 to 0.62) | .56 |
| 8-sector peripapillary capillary density (%) (95% CI) | ||||||
| Nasal superior | −0.19 (−0.69 to 0.32) | .47 | −0.03 (−0.55 to 0.48) | .90 | 0.24 (−0.33 to 0.82) | .41 |
| Nasal inferior | −0.56 (−1.08 to −0.03) | .04a | 0.03 (−0.50 to 0.57) | .90 | 0.60 (−0.02 to 1.21) | .06 |
| Inferior nasal | 0.04 (−0.62 to 0.69) | .92 | 0.13 (−0.53 to 0.79) | .70 | 0.07 (−0.63 to 0.77) | .84 |
| Inferior temporal | −0.08 (−0.73 to 0.58) | .82 | 0.06 (−0.58 to 0.71) | .85 | 0.16 (−0.57 to 0.88) | .67 |
| Temporal inferior | 0.10 (−0.47 to 0.68) | .72 | −0.26 (−0.86 to 0.34) | .40 | −0.30 (−0.94 to 0.33) | .35 |
| Temporal superior | −0.21 (−0.67 to 0.25) | .38 | 0.11 (−0.39 to 0.60) | .67 | 0.39 (−0.21 to 0.99) | .21 |
| Superior temporal | −0.16 (−0.76 to 0.44) | .60 | 0.05 (−0.52 to 0.63) | .85 | 0.28 (−0.43 to 0.98) | .44 |
| Superior nasal | 0.33 (−0.23 to 0.88) | .26 | 0.25 (−0.28 to 0.79) | .36 | 0.01 (−0.63 to 0.66) | .96 |
CI = confidence interval; LBN = latanoprostene bunod.
Statistically significant (P < .05).
Table 3 indicates the difference in macular wiVD and parafoveal VDs post-timolol and post-LBN use. The differences in macular VD post-timolol use did not reach significance in any of the retinal locations (P > .05 for all). In contrast, LBN increased macular VD in most retinal locations. The differences (95% CIs) in macular wiVD and parafoveal VD were 0.76% (0.20%–1.33% [P = .009]) and 0.86% (0.05%–1.66% [P = .04]), respectively (Table 3). The differences between LBN and timolol in macular wiVD and 3 other retinal regions were all higher (P < .05 for all). Foveal avascular zone area and perimeter were not altered after using timolol or LBN (P > .05 for all; Table 3).
TABLE 3.
Difference in Vessel Density and Foveal Avascular Zone Parameters From Macular Scans After Timolol Use, After Latanoprostene Bunod Use, and Between Timolol and Latanoprostene Bunod Use
| Timolol vs Baseline | P Value | LBN vs Baseline | P Value | LBN vs Timolol | P Value | |
|---|---|---|---|---|---|---|
|
| ||||||
| Vessel density (%) (95% CI) | ||||||
| Wi (wiVD) | −0.03 (−0.58 to 0.53) | .92 | 0.76 (0.20–1.33) | .009a | 0.70 (0.10–1.29) | .02a |
| Wi superior hemi | −0.14 (−0.72 to 0.43) | .63 | 0.80 (0.22–1.38) | .007a | 0.86 (0.25–1.47) | .006a |
| Wi inferior hemi | 0.10 (−0.47 to 0.66) | .74 | 0.72 (0.14–1.29) | .02a | 0.51 (−0.11 to 1.13) | .11 |
| Para fovea | 0.08 (−0.68 to 0.85) | .83 | 0.86 (0.05–1.66) | .04a | 0.63 (−0.27 to 1.53) | .17 |
| Para superior hemi | 0.07 (−0.75 to 0.89) | .86 | 1.17 (0.32–2.02) | .007a | 0.98 (0.02–1.93) | .047a |
| Para inferior hemi | 0.10 (−0.71 to 0.91) | .81 | 0.54 (−0.35 to 1.43) | .24 | 0.28 (−0.70 to 1.26) | .57 |
| Quadrant parafoveal vessel density (%) (95% CI) | ||||||
| Temporal | −0.09 (−0.91 to 0.73) | .83 | 0.81 (−0.03 to 1.64) | .06 | 0.70 (−0.22 to 1.63) | .14 |
| Superior | −0.11 (−0.97 to 0.75) | .80 | 1.04 (0.10–1.97) | .03a | 1.03 (0.02–2.05) | .048a |
| Nasal | 0.22 (−0.73 to 1.16) | .66 | 0.87 (−0.11 to 1.86) | .08 | 0.56 (−0.58 to 1.70) | .34 |
| Inferior | 0.35 (−0.54 to 1.24) | .45 | 0.71 (−0.25 to 1.67) | .15 | 0.23 (−0.88 to 1.33) | .69 |
| Foveal avascular zone (mm2) (95% CI) | ||||||
| Area | 0.00 (−0.01 to 0.01) | .73 | −0.00 (−0.01 to 0.01) | .90 | −0.00 (−0.01 to 0.01) | .48 |
| Perimeter | −0.01 (−0.04 to 0.03) | .69 | −0.02 (−0.05 to 0.02) | .41 | −0.01 (−0.05 to 0.03) | .53 |
| FD 300 area density | 0.17 (−0.69 to 1.02) | .77 | 0.26 (−0.60 to 1.11) | .56 | 0.09 (−0.95 to 1.13) | .87 |
CI = confidence interval; LBN = latanoprostene bunod; wi = whole image; FD 300 area density = density in the area within 300 μm from the foveal avascular zone boundary; VD =vessel density.
Statistically significant (P < .05).
No changes in IOP or VD were observed posttreatment in the 10 healthy eyes. The differences in IOP (95% CIs) from baseline post-timolol and post-LBN use were −5.1 mm Hg (−11.4 to 1.2 mm Hg [P = 0.12]) and −4.8 mm Hg (−11.1 to 1.4 mm Hg [P = .14]), respectively. The difference in wiCD (95% CI) post-timolol use was −0.41% (−1.14% to 0.32% [P = .27]) and post-LBN use was −0.05% (−0.80% to 0.71% [P = .91]). The differences in macular wiVD (95% CIs) post-timolol and post-LBN use were −0.52% (−1.50% to 0.46% [P = .30]) and 0.90% (−0.28% to 2.09% [P = .14]), respectively.
Differences (95% CIs) in peripapillary RNFL thickness obtained from the HD 4.5- × 4.5-mm2 ONH scans post-timolol and post-LBN applications were 0.40 μm (−0.11 to 0.90 μm [P = .12]) and 0.15 μm (−0.31 to 0.61 μm [P = .52]), respectively (Supplemental Table S2). Differences (95% CIs) in macular ganglion cell complex (GCC) thickness measurements post-timolol (0.26 μm [0.05–0.46 μm], P = .01) and post-LBN (0.19 μm [0.00–0.39 μm], P = .047) uses were significant. However, the differences in GCC thickness between LBN and timolol were not significant (−0.09 μm [−0.32 to 0.14 μm], P = .45, Supplemental Table S2). Furthermore, no significant difference in GCC thickness change was found between patients treated with timolol in both treatment sequences (0.03 μm [−0.26 to 0.32 μm] vs 0.08 μm [−0.30 to 0.45 μm], P = .83). Like-wise, no significant difference in GCC thickness change was found between patients treated with LBN in treatment sequence 1 (−0.11 μm [−0.58 to 0.37 μm]) and treatment sequence 2 (0.12 μm [−0.13 to 0.37 μm], P = .39).
The increase in GCC thickness did not impact VD measurements post-timolol use (R = 0.11, P = .46) or post-LBN use (R = 0.02, P = .90).
Figure 2 shows the mean macular wiVD (95% CI) for patients starting on LBN first (treatment sequence 1; Figure 2, A) and patients starting on timolol first (treatment sequence 2; Figure 2, B).
FIGURE 2.

Mean macular whole image vessel density (wiVD) (95% confidence interval) for patients starting on (A) treatment sequence 1 (latanoprostene bunod [LBN] → washout → timolol) or (B) treatment sequence 2 (timolol → washout → LBN). Visits 3 and 5 represent the baseline wiVD and visits 4 and 6 represent wiVD 1 month after each medication use. Bars represent the upper and lower limit confidence intervals.
The baseline mean wiVD for patients randomized to LBN first was 44.3% (41.8%–46.7%) compared with 44.7% (42.7%–46.8%) for patients randomized to timolol first (P = .76). In patients in treatment sequence 1, the mean macular wiVD increased (VD change: 1.55% [−0.01% to 3.1%]; visit 3, 44.2% [41.8%–46.7%] to visit 4, 45.82% [43.5%–48.1%], P = .03) but no significant change in wiVD was detected after switching to timolol (VD change: −0.50% [−1.6% to 0.6%]; visit 5, 44.77% [43.1%–46.3%] to visit 6, 44.27% [42.3%–46.1%], P = .18). The mean macular wiVD (95% CI) in patients starting on treatment sequence 2 did not significantly change after timolol use (VD change: −0.41% [−2.0% to 1.1%]; visit 3, 44.73% [42.6%–46.8%] to visit 4, 44.36% [42.3%–46.3%), P = .30) or LBN use (VD change: 0.01% [−2.6% to 2.6%]; visit 5, 44.1% [42.2%–46.0%] to visit 6, 44.2% [42.4%–46.0%], P = .50).
In patients starting on LBN first (treatment sequence 1), baseline IOP (95% CI; visit 3) was 21.2 mm Hg (19.3–23.2 mm Hg) and IOP (95% CI) after the 2-week washout period between treatments (visit 5) was 19.2 mm Hg (17.7–20.8 mm Hg). In patients starting on timolol first (treatment sequence 2), baseline IOP (95% CI; visit 3) and IOP after the 2-week washout period between treatments (95% CI; visit 5) were 23.2 mm Hg (20.8–25.6 mm Hg) and 20.8 mm Hg (18.8–22.8 mm Hg), respectively.
No associations between the absolute value of IOP or change in IOP and wiVD were found in patients starting on LBN first (R range: 0.09–0.30; P range: .18–.70) or timolol first (R range: 0.07–0.31; P range: .13–.74).
DISCUSSION
In this study, we evaluated the differences in peripapillary VD and macular VD in patients with OAG or patients with OHT and normal subjects using LBN 0.024% and timolol maleate 0.5%. Topical administration of LBN enhanced macular VD, whereas timolol had no effect.
It has been reported that systemically administered beta-blockers result in vasoconstriction in human retinal blood vessels because of a direct effect on beta-2 adrenoceptors that are found in these vessels.37,38 Topically administered timolol has been shown to decrease blood supply to the iris root-ciliary body.39 If timolol achieved pharmacologic concentrations at the retina, it too might cause vasoconstriction in the retinal arterioles with a reduction in VD irrespective of IOP and perfusion pressure. However, despite having a trend of VD decrease, no significant effect on peripapillary or macular VD was detected after 1 month of timolol use in the current study. Several factors might account for the absence of vasoconstriction including failure to sufficiently penetrate posteriorly with inadequate levels of timolol at the retina, inability to detect the vasoconstriction with the OCT-A instrument that was used in the study, or inability of the retinal arterioles to respond to timolol.
In contrast to the effect of timolol, there was enhancement of macular VD by LBN observed in the current study. Although there was an increasing trend of peripapillary VD post-LBN use, the differences were not significant. With our data, it is not possible to determine the precise reason for the effect of LBN on VD. Our results showed that the amount of IOP lowering was not correlated with the increase in macular VD. However, the NO of LBN may have caused vasodilation and increased the VD independent of the magnitude of IOP lowering. If NO was bioavailable in the posterior segment, one might expect that the macular VD and peripapillary VD would both have increased. As they were different, this suggests that NO did not reach the posterior segment of the eye. These results may also be explained by differences in the OCT-A scan sizes. The larger 6- × 6-mm2 macula scan provides more VD information than the smaller 4.5- × 4.5-mm2 ONH scan. Alternatively, the presence of large retinal blood vessels in the ONH scans may have obfuscated the measurements of VD. In addition, ONH scans have lower measurement repeatability than macular scans, which may lead to less accuracy in ONH VD measurements.40 In contrast, it is also possible that only the macular VD was influenced by NO post-LBN use because of the smaller macular caliber vessels that could be more susceptible to the NO.41 These changes in VD are notable because there was no significant relationship between the change in IOP or absolute values of IOP and VD. Thus, the higher baseline IOP in treatment sequence 2 did not appear to prevent LBN from having more a prominent effect on VD. This is similar to a recent study that evaluated the perfusion recovery after surgical lowering of IOP using OCT-A and showed that while VD increased after lowering of IOP there was no correlation between amount of IOP reduction and perfusion improvement in eyes with glaucoma.42
It also is noteworthy that LBN had a stronger influence on the average macular VD when it was randomized to be used as the first drug compared with its diminished effect as a second drug, suggesting the possibility that timolol effects lasted longer than LBN. To date, sustained effects of timolol on VD have not been reported. However, the minimum washout period of timolol for IOP to reach baseline levels is 4 weeks.42 One study looked at the effect on IOP of a 2-week washout after the long-term use of timolol and found that this time was insufficient to restore baseline IOP levels.43 Our IOP findings were in line with that study given that IOP post–2-week timolol washout at visit 5 (20.8 mm Hg) did not fully return to baseline IOP levels (23.3 mm Hg) from visit 3. Thus, the prolonged effects of timolol beyond the presumed washout period could have led to erroneous conclusions about the efficacy and responder rates to LBN.
Unpredictably, both medications increased GCC thickness from baseline in this study. To date, there has not been any clinical study that has investigated the effect of ocular hypotensive drugs on GCC thickness. Although macular VD and GCC thickness responded differently to ocular hypotensive agents in our study, lower parafoveal VD was found to be associated with faster GCC thinning. Furthermore, macular VD may predict macular thinning in patients with glaucoma.44
In this study, OCT-A imaging was performed after pupil dilation using topical 1.0% tropicamide and 2.5% phenylephrine, which may have influenced the quantitative assessment of the retinal microvasculature. One study has investigated the effect of pupil dilation on ONH and macular VD (HD and non-HD scans) in healthy eyes and concluded that dilation using topical 0.5% tropicamide and 2.5% phenylephrine results in a statistically significant but not clinically meaningful reduction in non-HD ONH scans.45 In our study, we only used HD ONH and macular scans. However, most of these scans were captured in eyes with OAG and eyes with OHT. Future studies should evaluate the effect on VD of dilation with only tropicamide.
Our study has several limitations. First, our sample size is relatively small and may limit our ability to detect significant differences, particularly in the healthy eyes. Although the present study had 80% power at the .05 significance level to detect an effect size of d = 0.38 for VD measurements, it was underpowered to detect correlation between the level of IOP lowering and the macular VD for each agent. Second, OCT-A imaging was performed postdilation, which may have influenced ocular vascular measurements. Third, the effect of each drug’s mechanism of action on VD was not directly tested. Studies are needed to determine the anatomic site of action of timolol and LBN and confirm whether these medications are active at the posterior segment of the eye, including the retina and choroid. Thus, it is also important to study how the choroidal vasculature is affected after treatment with both timolol and LBN. In addition, a future comparative study between LBN and latanoprost in a larger cohort might provide useful information about the effect of NO on VD. Fourth, the difference in the drugs’ dosing schedule may have influenced the VD measurements. Last, the washout period between the 2 drugs was relatively short (2 weeks), and a longer period may be needed for a better understanding about the efficacy of subsequent medications.
In conclusion, treatment with LBN ophthalmic solution 0.024% enhanced macular VD in patients with OAG or patients with OHT but not in normal subjects. In contrast, timolol maleate ophthalmic solution 0.5% was not associated with VD changes. This may indicate an IOP-independent mechanism by which LBN modulates the risk of glaucoma progression by the enhancing ocular microcirculation.
Supplementary Material
Acknowledgment:
We thank Ethan Nguyen for assistance with data entry.
Funding/Support:
Supported in part by the National Institutes of Health/National Eye Institute Grant Nos. EY029058 and P30EY022589, a grant from Bausch & Lomb, Inc. and an unrestricted grant from Research to Prevent Blindness, New York, New York. Financial Disclosures: R.N.W. received funding from Bausch & Lomb and research instruments from Heidelberg Engineering, Carl Zeiss Meditec, Konan, Optovue, Topcon, and Centervue and has been a consultant for Allergan, Equinox, Eyenovia, and Nicox. The other authors indicate no conflicts of interest. Author Contributions: Concept design: R.N.W.; Acquisition and reviewing data: N.E.N., R.C.P., E.G., D.Y., J.D., A.C., S.M., M.S., V.R.; Analysis or interpretation of data: N.B., J.P., N.E.N., S.M., R.N.W.; Drafting of the manuscript: N.E.N., S.M., R.N.W.; Critical revision of the manuscript: All authors; Obtained funding: R.N.W.; Supervision: R.N.W. All authors attest that they meet the current ICMJE criteria for authorship.
Footnotes
ALL AUTHORS HAVE COMPLETED AND SUBMITTED THE ICMJE FORM FOR DISCLOSURE OF POTENTIAL CONFLICTS OF INTEREST.
Contributor Information
NEVIN W. EL-NIMRI, Hamilton Glaucoma Center, Shiley Eye Institute, and the Viterbi Family Department of Ophthalmology, University of California San Diego, La Jolla, California, USA
SASAN MOGHIMI, Hamilton Glaucoma Center, Shiley Eye Institute, and the Viterbi Family Department of Ophthalmology, University of California San Diego, La Jolla, California, USA.
RAFAELLA C. PENTEADO, Hamilton Glaucoma Center, Shiley Eye Institute, and the Viterbi Family Department of Ophthalmology, University of California San Diego, La Jolla, California, USA
ELHAM GHAHARI, Hamilton Glaucoma Center, Shiley Eye Institute, and the Viterbi Family Department of Ophthalmology, University of California San Diego, La Jolla, California, USA.
DIYA YANG, Beijing Tongren Eye Center, Beijing Institute of Ophthalmology, Beijing Tongren Hospital, Capital Medical University, Beijing, China.
NICOLE BRYE, Hamilton Glaucoma Center, Shiley Eye Institute, and the Viterbi Family Department of Ophthalmology, University of California San Diego, La Jolla, California, USA.
JAMES PROUDFOOT, Hamilton Glaucoma Center, Shiley Eye Institute, and the Viterbi Family Department of Ophthalmology, University of California San Diego, La Jolla, California, USA.
JIUN L. DO, Hamilton Glaucoma Center, Shiley Eye Institute, and the Viterbi Family Department of Ophthalmology, University of California San Diego, La Jolla, California, USA
ANDREW CAMP, Hamilton Glaucoma Center, Shiley Eye Institute, and the Viterbi Family Department of Ophthalmology, University of California San Diego, La Jolla, California, USA.
MATTHEW SALCEDO, Hamilton Glaucoma Center, Shiley Eye Institute, and the Viterbi Family Department of Ophthalmology, University of California San Diego, La Jolla, California, USA.
VERONICA RUBIO, Hamilton Glaucoma Center, Shiley Eye Institute, and the Viterbi Family Department of Ophthalmology, University of California San Diego, La Jolla, California, USA.
ROBERT N. WEINREB, Hamilton Glaucoma Center, Shiley Eye Institute, and the Viterbi Family Department of Ophthalmology, University of California San Diego, La Jolla, California, USA
REFERENCES
- 1.Halpern DL, Grosskreutz CL. Glaucomatous optic neuropathy: mechanisms of disease. Ophthalmol Clin North Am. 2002;15(1):61–68. [DOI] [PubMed] [Google Scholar]
- 2.Kass MA, Heuer DK, Higginbotham EJ, et al. The Ocular Hypertension Treatment Study: a randomized trial determines that topical ocular hypotensive medication delays or prevents the onset of primary open-angle glaucoma. Arch Ophthalmol. 2002;120:701–713 discussion 829–30. [DOI] [PubMed] [Google Scholar]
- 3.Heijl A, Leske MC, Bengtsson B, Hyman L, Bengtsson B, Hussein M. Reduction of intraocular pressure and glaucoma progression: Results from the Early Manifest Glaucoma Trial. Arch Ophthalmol. 2002;120:1268–1279. [DOI] [PubMed] [Google Scholar]
- 4.Leske MC, Heijl A, Hussein M, Bengtsson B, Hyman L, Komaroff E. Factors for glaucoma progression and the effect of treatment: The early manifest glaucoma trial. Arch Ophthalmol. 2003;121:48–56. [DOI] [PubMed] [Google Scholar]
- 5.Weinreb RN, Aung T, Medeiros FA. The pathophysiology and treatment of glaucoma: a review. JAMA. 2014;311(18):1901–1911. [DOI] [PMC free article] [PubMed] [Google Scholar]
- 6.Boland MV, Ervin AM, Friedman DS, et al. Comparative effectiveness of treatments for open-angle glaucoma: a systematic review for the U.S. preventive services task force. Ann Intern Med. 2013;158:271–279. [DOI] [PubMed] [Google Scholar]
- 7.Prum BE, Rosenberg LF, Gedde SJ, et al. Primary open-angle glaucoma Preferred Practice Pattern® guidelines. Ophthalmology. 2016;123(1):P41–P111. [DOI] [PubMed] [Google Scholar]
- 8.Camras CB, Bito LZ. Reduction of intraocular pressure in normal and glaucomatous primate (Aotus trivirgatus) eyes by topically applied prostaglandin F 2α. Curr Eye Res. 1981;1(4):205–209. [DOI] [PubMed] [Google Scholar]
- 9.Camras CB, Schumer RA, Marsk A, et al. Intraocular pressure reduction with PhXA34, a new prostaglandin analogue, in patients with ocular hypertension. Arch Ophthalmol. 1992;110:1733–1738. [DOI] [PubMed] [Google Scholar]
- 10.Camras CB. Comparison of latanoprost and timolol in patients with ocular hypertension and glaucoma: a six–month masked, multicenter trial in the United States. The United States Latanoprost Study Group. Ophthalmology. 1996;103(1):138–147. [DOI] [PubMed] [Google Scholar]
- 11.Stjernschantz J, Selén G, Sjöquist B, Resul B. Preclinical pharmacology of latanoprost, a phenyl-substituted PGF2 alpha analogue. Adv Prostaglandin Thromboxane Leukot Res. 1995;23:513–518. [PubMed] [Google Scholar]
- 12.Lütjen-Drecoll E, Tamm E. Morphological study of the anterior segment of cynomolgus monkey eyes following treatment with prostaglandin F2α. Exp Eye Res. 1988;47:761–769. [DOI] [PubMed] [Google Scholar]
- 13.Nilsson SFE, Samuelsson M, Bill A, Stjernschantz J. Increased uveoscleral outflow as a possible mechanism of ocular hypotension caused by prostaglandin F2α-1-isopropylester in the cynomolgus monkey. Exp Eye Res. 1989;48:707–716. [DOI] [PubMed] [Google Scholar]
- 14.Lindsey JD, Kashiwagi K, Kashiwagi F, Weinreb RN. Prostaglandins alter extracellular matrix adjacent to human ciliary muscle cells in vitro. Invest Ophthalmol Vis Sci. 1997;38:2214–2223. [PubMed] [Google Scholar]
- 15.Richter M, Krauss AHP, Woodward DF, Lütjen-Drecoll E. Morphological changes in the anterior eye segment after long-term treatment with different receptor selective prostaglandin agonists and a prostamide. Invest Ophthalmol Vis Sci. 2003;44:4419–4426. [DOI] [PubMed] [Google Scholar]
- 16.Giuffrida S, Bucolo C, Drago F. Topical application of a nitric oxide synthase inhibitor reduces intraocular pressure in rabbits with experimental glaucoma. J Ocul Pharmacol Ther. 2003;19(6):527–534. [DOI] [PubMed] [Google Scholar]
- 17.Nathanson JA. Nitrovasodilators as a new class of ocular hypotensive agents. J Pharmacol Exp Ther. 1992;260:956–965. [PubMed] [Google Scholar]
- 18.Schuman JS, Erickson K, Nathanson JA. Nitrovasodilator effects on intraocular pressure and outflow facility in monkeys. Exp Eye Res. 1994;58(1):99–105. [DOI] [PubMed] [Google Scholar]
- 19.Chuman H, Chuman T, Nao-i N, Sawada A. The effect of L-arginine on intraocular pressure in the human eye. Curr Eye Res. 2000;20:511–516. [PubMed] [Google Scholar]
- 20.Wizemann AJS, Wizemann V. Organic nitrate therapy in glaucoma. Am J Ophthalmol. 1980;90:106–109. [DOI] [PubMed] [Google Scholar]
- 21.Dorner GT, Garhofer G, Kiss B, et al. Nitric oxide regulates retinal vascular tone in humans. Am J Physiol Heart Circ Physiol. 2003;285:H631–H636. [DOI] [PubMed] [Google Scholar]
- 22.Chan KKW, Tang F, Tham CCY, Young AL, Cheung CY. Retinal vasculature in glaucoma: a review. BMJ Open Ophthalmol. 2017;1:e000032. [DOI] [PMC free article] [PubMed] [Google Scholar]
- 23.Weinreb RN. Tee Khaw P. Primary open-angle glaucoma. Lancet. 2004;363:1711–1720. [DOI] [PubMed] [Google Scholar]
- 24.Weinreb RN. Ocular blood flow in glaucoma. Can J Ophthalmol. 2008;43:281–283. [DOI] [PubMed] [Google Scholar]
- 25.Flammer J, Orgül S, Costa VP, et al. The impact of ocular blood flow in glaucoma. Prog Retin Eye Res. 2002;21:359–393. [DOI] [PubMed] [Google Scholar]
- 26.Kiseleva OA, Iomdina EN, Bessmertny AM, Yakubova LV, Vasilenkova LV, Khoziev DD. Evaluation of the effect of prostaglandin analogues and a carbonic anhydrase inhibitor/β-blocker combination on the ocular blood flow in patients with primary open-angle glaucoma [in Russian]. Vestn Oftalmol. 2019;135(4):70–77. [DOI] [PubMed] [Google Scholar]
- 27.Takusagawa HL, Liu L, Ma KN, et al. Projection-resolved optical coherence tomography angiography of macular retinal circulation in glaucoma. Ophthalmology. 2017;124:1589–1599. [DOI] [PMC free article] [PubMed] [Google Scholar]
- 28.Hou H, Moghimi S, Zangwill LM, et al. Macula vessel density and thickness in early primary open-angle glaucoma. Am J Ophthalmol. 2019;199:120–132. [DOI] [PMC free article] [PubMed] [Google Scholar]
- 29.Doganay S, Evereklioglu C, Turkoz Y, Er H. Decreased nitric oxide production in primary open-angle glaucoma. Eur J Ophthalmol. 2002;12:44–48. [DOI] [PubMed] [Google Scholar]
- 30.Moghimi S, Zangwill LM, Penteado RC, et al. Macular and optic nerve head vessel density and progressive retinal nerve fiber layer loss in glaucoma. Ophthalmology. 2018;125:1720–1728. [DOI] [PubMed] [Google Scholar]
- 31.Hou H, Moghimi S, Proudfoot JA, et al. Ganglion cell complex thickness and macular vessel density loss in primary open-angle glaucoma. Ophthalmology. 2020;127:1043–1052. [DOI] [PMC free article] [PubMed] [Google Scholar]
- 32.Chihara E, Dimitrova G, Chihara T. Increase in the OCT angiographic peripapillary vessel density by ROCK inhibitor ripasudil instillation: a comparison with brimonidine. Graefes Arch Clin Exp Ophthalmol. 2018;256:1257–1264. [DOI] [PMC free article] [PubMed] [Google Scholar]
- 33.Lin YH, Su WW, Huang SM, Chuang LH, Chen LC. Optical coherence tomography angiography vessel density changes in normal-tension glaucoma treated with carteolol, brimonidine, or dorzolamide. J Glaucoma. 2021;30:690–696. [DOI] [PubMed] [Google Scholar]
- 34.Jia Y, Tan O, Tokayer J, et al. Split-spectrum amplitude-decor-relation angiography with optical coherence tomography. Opt Express. 2012;20(4):4710. [DOI] [PMC free article] [PubMed] [Google Scholar]
- 35.Liu L, Edmunds B, Takusagawa HL, et al. Projection-resolved optical coherence tomography angiography of the peripapillary retina in glaucoma. Am J Ophthalmol. 2019;207:99–109. [DOI] [PMC free article] [PubMed] [Google Scholar]
- 36.El-Nimri NW, Manalastas PIC, Zangwill LM, et al. Superficial and deep macula vessel density in healthy, glaucoma suspect, and glaucoma eyes. J Glaucoma. 2021;30(6):e276–e284. [DOI] [PMC free article] [PubMed] [Google Scholar]
- 37.Cruickshank JM. The clinical importance of cardioselectivity and lipophilicity in beta blockers. Am Heart J. 1980;100:160–178. [DOI] [PubMed] [Google Scholar]
- 38.Ferrari-Dileo G Beta 1 and beta 2 adrenergic binding sites in bovine retina and retinal blood vessels. Invest Ophthalmol Vis Sci. 1988;29(5):695–699. [PubMed] [Google Scholar]
- 39.Watanabe K, Chiou GCY. Action mechanism of timolol to lower the intraocular pressure in rabbits. Ophthalmic Res. 1983;15(3):160–167. [DOI] [PubMed] [Google Scholar]
- 40.Lim CW, Cheng J, Tay ELT, et al. Optical coherence tomography angiography of the macula and optic nerve head: microvascular density and test-retest repeatability in normal subjects. BMC Ophthalmol. 2018;18(1):315. [DOI] [PMC free article] [PubMed] [Google Scholar]
- 41.Blatter LA, Wier WG. Nitric oxide decreases [Ca2+]i in vascular smooth muscle by inhibition of the calcium current. Cell Calcium. 1994;15(2):122–131. [DOI] [PubMed] [Google Scholar]
- 42.Kitnarong N, Zhao Y, Netland PA, Kent AR. Efficacy of latanoprost and timolol maleate in black and white patients. Adv Ther. 2004;21(4):203–213. [DOI] [PubMed] [Google Scholar]
- 43.Hong YJ, Shin DH, Ahn BH, McCarty B. Intraocular pressure after a two-week washout following long-term timolol or levobunolol. J Ocul Pharmacol Ther. 1995;11(2):107–112. [DOI] [PubMed] [Google Scholar]
- 44.Wu J-H, Moghimi S, Nishida T, et al. Correlation of ganglion cell complex thinning with baseline deep and superficial macular vessel density in glaucoma. Br J Ophthalmol. Published online January 31. doi: 10.1136/bjophthalmol-2021-320663. [DOI] [PubMed] [Google Scholar]
- 45.Villatoro G, Bowd C, Proudfoot JA, et al. Impact of pupil dilation on optical coherence tomography angiography retinal microvasculature in healthy eyes. J Glaucoma. 2020;29(11):1025–1029. [DOI] [PMC free article] [PubMed] [Google Scholar]
Associated Data
This section collects any data citations, data availability statements, or supplementary materials included in this article.