

Abstract
Background:
Adverse events (AEs) are often misreported on clinical trials, leading to an incomplete understanding of toxicities. We aimed to test automated laboratory AE ascertainment and grading (ExtractEHR) to demonstrate scalability and define AE rates for children with acute myeloid and acute lymphoblastic leukemia (AML, ALL).
Methods:
Patients aged 0–22 years at Children’s Healthcare of Atlanta (CHOA, 01–01-2010–01-11–2018), Children’s Hospital of Philadelphia (CHOP, 01–01-2011–31-12–2014), and Texas Children’s Hospital (TCH, 01–01-2011–31-12`2014) were included. ExtractEHR acquired, cleaned, and graded laboratory data per CTCAEv5 for 22 commonly evaluated AEs with numerically-based CTCAE definitions. Descriptive statistics tabulated AE frequencies. ExtractEHR-ascertained AEs were compared to manually reported Children’s Oncology Group (COG; AAML1031, NCT01371981; AALL0932, NCT02883049) AEs for trial-enrolled patients.
Findings:
Laboratory results on 1077 patients (AML: 166, ALL: 911; CHOA: 583; CHOP 200; TCH 294) with 4611 courses (AML: 549, ALL: 4062) were extracted, processed, and graded. For AML patients, 86/166 (52%) were female, 96/166 (58%) were white, and 132/166 (80%) were non-Hispanic. Among ALL patients, 406/911 (45%) were female, 596/911 (65%) were white, and 641/911 (70%) were non-Hispanic. AML patients experienced the most AEs during induction I and intensification II. Hypokalemia (1/6 (17%) to 75/156 (48%) courses) and alanine aminotransferase (ALT) increased (13/134 (10%) to 27/156 (17%) courses) were the most prevalent non-hematologic AML AEs. ALL patients experienced the greatest number of AEs during induction and maintenance (prevalence ≥10% for 8 AEs; Induction and Maintenance: Anemia, Platelet Count Decreased, White Blood Cell Count Decreased, Neutrophil Count Decreased, Lymphocyte Count Decreased, ALT Increased, Hypocalcemia; Induction: Hypokalemia; Maintenance: AST Increased, Blood Bilirubin Increased). ExtractEHR laboratory AE rates were substantially higher than COG-reported AE rates for AEs with at least 2% prevalence.
Interpretation:
ExtractEHR is scalable and accurately defines laboratory AE rates for pediatric acute leukemia that are higher than COG-reported AEs. These rates can be used for comparisons between therapies and to counsel patients regarding chemotherapy risks for patients treated on or off of trials. ExtractEHR AE ascertainment provides a novel mechanism for improving laboratory AE trial reporting.
Funding:
The National Institutes of Health, St. Baldrick’s Foundation, and Alex’s Lemonade Stand Foundation funded this study.
Introduction
Cooperative oncology group clinical trials have improved survival rates for children with leukemia.1–6 However, chemotherapy agents cause treatment-related adverse events (AEs) that may harm patients. Therefore, accurate and timely AE assessment is necessary for safe and ethical clinical trial conduct.7–9
The National Cancer Institute (NCI) Common Terminology Criteria for Adverse Events (CTCAE) guides AE reporting on cooperative group oncology trials.10 The current version, CTCAE v5, includes more than 800 AEs.10 For many laboratory-based AEs, grading definitions include numerical cut-offs. The highly manual component to laboratory AE ascertainment has been unchanged since the first pediatric leukemia trial in 1948.11 Typically, a clinical research associate (CRA) manually reviews every laboratory result during each participant’s chemotherapy course to identify AEs requiring reporting.12–17 Depending on the CTCAE definition, grading may require comparison to age-specific norms.10,13 This process is labor-intensive and prone to human error.13
Multiple prior studies have demonstrated AEs under- and mis-reporting on trials, leading to an incomplete understanding of therapy-associated toxicities.7,13,14,18–20 While the oncology community recognizes a need to improve AE capture, potential community-wide solutions have not been implemented. Single institutions have leveraged electronic health record (EHR) laboratory data to identify and report toxicity signals.21–23 We previously validated that laboratory data can be extracted from the EHR, cleaned, and processed to ascertain AEs with sensitivity and positive predictive values greater than 98% compared to gold standard chart abstraction at a single institution.13
However, automated ascertainment and assessment of AEs in the multi-site setting is needed to address the systematic issues in cooperative group laboratory AE reporting. The primary objective of this study was to employ our automated methodology at three large children’s hospitals to demonstrate the scalability and impact of multi-site automated laboratory AE ascertainment and grading and to define baseline laboratory AE rates in children with acute leukemia. Feasibility was defined as successful extraction of EHR laboratory data and ability to process and grade data using parallel code at all sites. We hypothesized that automated ascertainment can be used to identify and grade laboratory AEs across hospitals. Further, as a secondary objective, we hypothesized that automated determination of laboratory AEs will identify higher laboratory AE rates than are currently reported through manual processes on pediatric cooperative group trials.
Methods
Study design and participants
The study included patients within the Leukemia Electronic Abstraction of Records Network (LEARN), a consortium of patients aged 0–22 years who were treated for de novo acute myeloid or lymphoblastic leukemia (AML, ALL) regardless of histological type or specific molecular aberration at Children’s Healthcare of Atlanta (CHOA) from 01–01-2010 through 01–11-2018, Children’s Hospital of Philadelphia (CHOP) from 01–01-2011 through 31–12-2014, and Texas Children’s Hospital (TCH) from 01–01-2011 through 31–12-2014.12,24 LEARN inclusion start date was determined by the date of complete Epic™ EHR (Epic Systems Inc., Verona, WI) initiation at each site. Patients with Trisomy 21 (TS21) and acute promyelocytic leukemia (APL) were excluded due to receiving different chemotherapy regimens. As part of development of the LEARN cohort, manual chart abstraction collected disease characteristics including risk classification, treatment on or per a clinical trial by course, chemotherapy course start and end dates, regimens received, and relapse, refractory, and stem cell transplant (SCT) death dates. Data were stored in a REDCap™ (Vanderbilt University, Nashville, TN) database. IRB approval was obtained at all sites. Per IRB requirements at each site, ethics approval nor informed consent were required. Deidentified data were shared on a secure server at CHOP.
Chemotherapy courses for upfront therapy administered at CHOA, CHOP or TCH with full EHR data availability were included. Courses were excluded if they were ongoing at the time of chart abstraction. Courses were censored at identification of refractory or relapsed disease, SCT, or death. For chemotherapy-course based analyses, patients treated on or per the following Children’s Oncology Group (COG) protocols were included: AALL0232,25 AALL0331,26 AALL0434,27 AALL0932,4 AALL1131,2 AALL1231, AAML0531,5 and AAML1031.6 Analyses were restricted to protocol-defined chemotherapy courses (AML: induction I, induction II, intensification I, intensification II, intensification III; ALL: induction, consolidation, interim maintenance (IM), delayed intensification (DI), maintenance).
Procedures
ExtractEHR, an R software package, utilizes an application programming interface (API) to extract demographic and laboratory result data, including age-specific norms, from the EHR based on chemotherapy course dates defined by manual abstraction.12,13 As part of implementation, the code is mapped individually at each site and output is checked to ensure all potential names of each laboratory test are included. De-identified laboratory result data underwent central data quality checking and cleaning, as previously published, to remove falsely abnormal results, including hemolyzed specimens and results that normalized within predefined time intervals.13 Laboratory results were graded according to CTCAE v5 definitions for 22 commonly evaluated AEs with numerically-based CTCAE definitions: anemia, platelet count (PLT) decreased, white blood cell (WBC) decreased, neutrophil count (ANC) decreased, lymphocyte count (ALC) decreased, partial thromboplastin time (PTT) prolonged, fibrinogen decreased, alanine aminotransferase (ALT) increased, aspartate aminotransferase (AST) increased, gamma glutamyl transferase (GGT) increased, blood bilirubin increased, hyperkalemia, hypokalemia, hypernatremia, hyponatremia, hypercalcemia, hypocalcemia, hypoglycemia, creatinine increased, serum amylase increased, lipase increased and hypoalbuminemia. Hyperglycemia and grade 4 anemia were excluded as CTCAE v5 definitions are not solely based on laboratory data.10 Grade 5 was not included as in CTCAE grade 5 is defined as death and attribution of death due to a laboratory value cannot be performed electronically. There were no changes in laboratory AE cutoff numbers between CTCAE v4 and v5. The highest grade of each AE in each chemotherapy course was identified to parallel COG phase III reporting requirements.
Based on typical reporting requirements for phase III trials, grades 3–4 AEs were the primary outcome. For the primary analysis, to match COG reporting, the prevalence of each laboratory AE was determined by course using the number of patients who received that course as the denominator. If a patient did not have a laboratory test sent in a course, it was assumed that a laboratory AE did not occur. In addition, a summary of the number of AEs with a prevalence ≥10% were summarized for each course. For the secondary analysis, the proportion of patients with a laboratory AE relative to those who had the laboratory test sent was also calculated for each course.
For each course, the highest grades experienced by each patient for each AE were tabulated for ALL and AML separately. Prevalence of AEs in each course were compared by demographics (sex, age, race, ethnicity) and trial enrollment status. AEs were compared by chemotherapy exposure: mitoxantrone and cytarabine [MA] vs. cytarabine, daunorubicin and etoposide [ADE] for AML patients during induction II and Capizzi methotrexate (CMTX) vs. high dose methotrexate (HDMTX) for ALL during the IM courses.
Using data reported to COG on the trial, for each AE the percentage of patients with at least one grade 3–4 AE reported on the AAML1031 (NCT01371981, Recruitment dates 20–06-2011 to 31–07-2017) trial at non-LEARN sites was compared to AEs reported on patients included in the LEARN cohort to determine representativeness of LEARN. Subsequently, COG manually reported AE data were manually abstracted from final COG study reports for COG trials AAML1031 and AALL0932 (NCT02883049, Recruitment dates 09–08-2010 to 21–03-2018) to tabulate proportions of patients with each AE in each course on the trial. COG final study reports are available to COG members and include trial data not included in study publications, including AE rates based on AEs reported for all study patients in each chemotherapy course. The study reports include data from all patients, inclusive of patients in the LEARN cohort. To match study reports, ExtractEHR-ascertained data from IM 1 and 2 were separated for analyses comparing to COG data. COG data regarding laboratory AEs during maintenance on AALL0932 were listed in the study report by maintenance cycle. Since maintenance was collected as one course in LEARN, maintenance AEs were combined for comparison. Only laboratory AEs required to be reported on the clinical trials were evaluated. For the subset of patients who were treated on COG studies AAML1031 and AALL0932 in the LEARN dataset, proportions of ExtractEHR-ascertained AEs were also calculated for each chemotherapy course.
Statistical analysis
Statistical analyses were performed in SAS (SAS/STAT User’s Guide, Version 9.3; SAS Analytics, SAS Institute, Cary, NC). Each chemotherapy course was considered independent. The statistical significance of observed differences between compared proportions (by course, demographics, clinical trial enrollment, and chemotherapy exposure) was tested using Chi-Square test or two-sided Fisher’s exact test as appropriate. Prevalence ratios (PR) with 95% confidence interval (CI) were also estimated using log-binomial regression models. A two-sided p-value of <0.05 was considered statistically significant.
Role of the funding source
The study sponsors had no involvement in the study design, data collection, analysis, interpretation, writing of the manuscript, or decision to submit for publication.
Results
Of the 1219 patients in LEARN, 21 with APL, 47 with TS21, 74 who received non-standard chemotherapy were excluded (Figure 1). Laboratory AE data from a total of 4611 eligible courses (AML: 549, ALL: 4062) were contributed by 1077 patients (AML: 166, ALL: 911; CHOA: 583; CHOP 200; TCH 294) who met inclusion criteria (Table 1). Among patients with AML, median age was 8·5 years (IQR 2·2–14·1), 86/166 (52%) were female, 96/166 (58%) were white, and 132/166 (80%) were non-Hispanic. Among patients with ALL, median age was 5·7 years (IQR 3·4–11·3), 406/911 (45%) were female, 596/911 (65%) were white, and 641/911 (70%) were non-Hispanic. Approximately half of AML patients were low risk (92/166, 55%) and approximately half of ALL patients were standard risk (494/911, 54%) (Table 1).
Figure 1:

Patient flow diagram
LEARN=Leukemia Electronic Abstraction of Records Network; COG = Children’s Oncology Group; ALL = Acute Lymphoblastic Leukemia; AML = Acute Myeloid Leukemia
Table 1 –
Demographics of all patients in the LEARN cohort by site and disease type
| CHOA | CHOP | TCH | ||||
|---|---|---|---|---|---|---|
| AML | ALL | AML | ALL | AML | ALL | |
| Patients, N | 95 | 488 | 40 | 160 | 31 | 263 |
| Courses, N | 308 | 2149 | 131 | 733 | 110 | 1180 |
| Female, N (%) | 51 (54) | 223 (46) | 21 (53) | 69 (43) | 14 (45) | 114 (43) |
| Age at diagnosis, Median [IQR] | 8·0 [2·2–14·5] | 5·5 [3·3–10·4] | 8·9 [2·4–14·8] | 5·6 [3·3–11·6] | 7·4 [1·8–11·1] | 5·8 [3·5–12·0] |
| Race, N (%) | ||||||
| White | 50 (53) | 285 (58) | 25 (63) | 98 (61) | 21 (68) | 213 (81) |
| Black | 36 (38) | 112 (23) | 10 (25) | 19 (12) | 4 (13) | 22 (8) |
| Other | 9 (9) | 44 (9) | 5 (12) | 43 (27) | 4 (13) | 21 (8) |
| Unknown/Not Reported | 0 (0) | 47 (10) | 0 (0) | 0 (0) | 2 (6) | 7 (3) |
| Ethnicity, N (%) | ||||||
| Hispanic or Latino | 11 (12) | 108 (22) | 1 (2) | 22 (14) | 14 (45·2) | 131 (50) |
| Non-Hispanic | 77 (81) | 372 (76) | 39 (98) | 138 (86) | 16 (15·6) | 131 (50) |
| Unknown/Not Reported | 7 (7) | 8 (2) | 0 (0) | 0 (0) | 1 (3·2) | 1 (0) |
| AML Risk Classification* | ||||||
| Low Risk | 54 (57) | NA | 18 (45) | NA | 20 (65) | NA |
| Intermediate Risk | 2 (2) | NA | 3 (7) | NA | 2 (6) | NA |
| High Risk | 36 (38) | NA | 19 (48) | NA | 9 (29) | NA |
| Unknown/Not Reported | 3 (3) | NA | 0 (0) | NA | 0 (0) | NA |
| ALL Risk Classification* | ||||||
| Infant | NA | 1 (0) | NA | 0 (0) | NA | 0 (0) |
| Standard Risk | NA | 277 (57) | NA | 79 (50) | NA | 138 (53) |
| Intermediate Risk (For T-ALL) | NA | 28 (6) | NA | 15 (9) | NA | 17 (6) |
| High Risk | NA | 182 (37) | NA | 66 (41) | NA | 107 (41) |
| Unknown/Not Reported | NA | 0 (0) | NA | 0 (0) | NA | 1 (0) |
LEARN = Leukemia Electronic Abstraction of Records Network; CHOA = Children’s Healthcare of Atlanta; CHOP = Children’s Hospital of Philadelphia; TCH = Texas Children’s Hospital; AML = Acute Myeloid Leukemia; ALL = Acute Lymphoblastic Leukemia; IQR = Interquartile Range; NA = Not Applicable
Risk classification may be study-specific and therefore was determined based on the designation for the trial that the patient treated on or per.
The majority of the results for each laboratory test were less than grade 3 (Tables 2 and 3), as depicted for hemoglobin, PLT, and ANC results during induction I for AML or induction for ALL (Appendix p2–3). The laboratory AE results describe baseline AE rates that are applicable to patients treated on or per COG clinical trials or other trials using similar chemotherapy backbones.
Table 2 –
Prevalence of grades 3–4 laboratory adverse events by chemotherapy course ascertained by ExtractEHR for AML courses
| Induction I | Induction II | Intensification I | Intensification II | Intensification III | p-value | |
|---|---|---|---|---|---|---|
| N (%) | N (%) | N (%) | N (%) | N (%) | ||
| N=156 | N=148 | N=134 | N=105 | N=6 | ||
| Hematology | ||||||
| Anemia | 155 (99) | 145 (99) | 133 (99) | 104 (99) | 6 (100) | 0·79 |
| Platelet Count Decreased | 155 (99) | 148 (100) | 134 (100) | 105 (100) | 6 (100) | 0·64 |
| White Blood Cell Decreased | 154 (99) | 146 (99) | 134 (100) | 105 (100) | 6 (100) | 0·52 |
| Neutrophil Count Decreased | 155 (99) | 148 (100) | 134 (100) | 105 (100) | 6 (100) | 0·64 |
| Lymphocyte Count Decreased | 111 (71) | 111 (75) | 130 (97) | 105 (100) | 6 (100) | <0·0001 |
| Coagulation | ||||||
| PTT Prolonged | 7 (4) | 0 (0) | 2 (1) | 1 (1) | 0 (0) | 0·048 |
| Fibrinogen Decreased | 11 (7) | 0 (0) | 0 (0) | 0 (0) | 0 (0) | <0·0001 |
| Liver Function Tests | ||||||
| ALT Increased | 27 (17) | 17 (12) | 13 (10) | 14 (13) | 1 (17) | 0·38 |
| AST Increased | 16 (10) | 8 (5) | 2 (2) | 7 (7) | 0 (0) | 0·035 |
| GGT Increased | 15 (10) | 9 (6) | 6 (5) | 13 (12) | 1 (17) | 0·14 |
| Blood Bilirubin Increased | 11 (7) | 4 (3) | 1 (1) | 4 (4) | 0 (0) | 0·062 |
| Chemistry | ||||||
| Hyperkalemia | 10 (6) | 6 (4) | 4 (3) | 6 (6) | 0 (0) | 0·64 |
| Hypokalemia | 75 (48) | 31 (21) | 37 (28) | 32 (31) | 1 (17) | <0·0001 |
| Hypernatremia | 9 (6) | 2 (1) | 0 (0) | 0 (0) | 0 (0) | 0·0023 |
| Hyponatremia | 4 (3) | 0 (0) | 0 (0) | 4 (4) | 0 (0) | 0·047 |
| Hypercalcemia | 0 (0) | 0 (0) | 0 (0) | 0 (0) | 0 (0) | NA |
| Hypocalcemia | 40 (26) | 7 (5) | 3 (2) | 7 (7) | 1 (17) | <0·0001 |
| Hypoglycemia | 0 (0) | 0 (0) | 0 0) | 1 (1) | 0 (0) | 0·38 |
| Creatinine Increased | 5 (3) | 1 (1) | 0 (0) | 0 (0) | 0 (0) | 0·052 |
| Serum Amylase Increased | 0 (0) | 1 (1) | 1 (1) | 1 (1) | 1 (17) | 0·0002 |
| Lipase Increased | 5 (3) | 1 (1) | 4 (3) | 3 (3) | 1 (17) | 0·12 |
| Hypoalbuminemia | 22 (14) | 2 (1) | 4 (3) | 5 (5) | 1 (17) | <0·0001 |
PTT = Partial Thromboplastin Time; ALT = Alanine Aminotransferase; AST = Aspartate Aminotransferase; GGT = Gamma Glutamyl Transferase; NA = Not Applicable; LEARN = Leukemia Electronic Abstraction of Records Network; The results in this table describe course-specific prevalence estimates. Total N is the number who completed each chemotherapy course. The N of 6 in Intensification II is due to the fact that this course did not exist on the AAML1031 trial, which many patients in the LEARN cohort were treated on or per. If the patient did not have a laboratory test in a given course, the course was considered to be grade 0 for that laboratory test.
Table 3 –
Prevalence of grades 3–4 laboratory adverse events by chemotherapy course ascertained by ExtractEHR for ALL courses
| Induction | Consolidation | Interim Maintenance | Delayed Intensification | Maintenance | p-value | |
|---|---|---|---|---|---|---|
| N (%) | N (%) | N (%) | N (%) | N (%) | ||
| N=848 | N=811 | N=1169 | N=728 | N=506 | ||
| Hematology | ||||||
| Anemia | 646 (76) | 555 (68) | 331 (28) | 576 (79) | 193 (38) | <0·0001 |
| Platelet Count Decreased | 584 (69) | 464 (57) | 234 (20) | 529 (73) | 123 (24) | <0·0001 |
| White Blood Cell Decreased | 750 (88) | 566 (70) | 588 (50) | 703 (97) | 455 (90) | <0·0001 |
| Neutrophil Count Decreased | 797 (94) | 639 (79) | 869 (74) | 718 (99) | 478 (94) | <0·0001 |
| Lymphocyte Count Decreased | 574 (68) | 501 (62) | 484 (41) | 647 (89) | 451 (89) | <0·0001 |
| Coagulation | ||||||
| PTT Prolonged | 15 (2) | 8 (1) | 8 (1) | 7 (1) | 13 (3) | 0·011 |
| Fibrinogen Decreased | 26 (3) | 3 (0·4) | 1 (0·1) | 3 (0·4) | 1 (0·2) | <0·0001 |
| Liver Function Tests | ||||||
| ALT Increased | 210 (25) | 313 (39) | 341 (29) | 115 (16) | 323 (64) | <0·0001 |
| AST Increased | 73 (9) | 72 (9) | 108 (9) | 29 (4) | 77 (15) | <0·0001 |
| GGT Increased | 69 (8) | 71 (9) | 70 (6) | 24 (3) | 39 (8) | 0·0001 |
| Blood Bilirubin Increased | 53 (6) | 35 (4) | 15 (1) | 16 (2) | 82 (16) | <0·0001 |
| Chemistry | ||||||
| Hyperkalemia | 67 (8) | 9 (1) | 14 (1) | 7 (1) | 10 (2) | <0·0001 |
| Hypokalemia | 118 (14) | 54 (7) | 191 (16) | 63 (9) | 38 (8) | <0·0001 |
| Hypernatremia | 8 (1) | 3 (0·4) | 3 (0·3) | 1 (0·1) | 1 (0·2) | 0·066 |
| Hyponatremia | 26 (3) | 2 (0·3) | 3 (0·3) | 6 (1) | 0 (0) | <0·0001 |
| Hypercalcemia | 10 (1) | 5 (1) | 2 (0·2) | 1 (0·1) | 0 (0) | 0·0022 |
| Hypocalcemia | 142 (17) | 26 (3) | 29 (2) | 21 (3) | 16 (3) | <0·0001 |
| Hypoglycemia | 1 (0·1) | 3 (0·4) | 7 (1) | 2 (0·3) | 18 (4) | <0·0001 |
| Creatinine Increased | 9 (1) | 0 (0) | 1 (0·1) | 2 (0·3) | 0 (0) | 0·0002 |
| Serum Amylase Increased | 13 (2) | 6 (1) | 5 (0.4) | 8 (1) | 6 (1) | 0·12 |
| Lipase Increased | 28 (3) | 34 (4) | 19 (2) | 16 (2) | 15 (3) | 0·0084 |
| Hypoalbuminemia | 75 (9) | 36 (4) | 19 (2) | 30 (4) | 8 (2) | <0·0001 |
PTT = Partial Thromboplastin Time; ALT = Alanine Aminotransferase; AST = Aspartate Aminotransferase; GGT = Gamma Glutamyl Transferase; LEARN = Leukemia Electronic Abstraction of Records Network; The results in this table describe course-specific prevalence estimates. Total N is the number who completed each chemotherapy course. The number of patients in each course decreased due to courses that were ongoing at time of chart abstraction for the study, death, relapse, or patients leaving protocol therapy and receiving a stem cell transplant. If the patient did not have a laboratory test in a given course, the course was considered to be grade 0 for that laboratory test. Interim maintenance courses were combined for these analyses, which led to a larger N.
Greater than 99% of AML courses had anemia, PLT decreased, and ANC decreased (Table 2, Appendix p4). AML patients experienced the greatest number of different AEs during induction I and intensification II, with prevalence ≥10% for ≥8 AEs (induction I AEs with prevalence ≥10%: Anemia, PLT decreased, WBC decreased, ANC Decreased, ALC decreased, ALT increased, AST increased, GGT increased, Hypokalemia, Hypocalcemia, Hypoalbuminemia; intensification II: Anemia, PLT decreased, WBC decreased, ANC Decreased, ALC decreased, ALT increased, GGT Increased, Hypokalemia). Hypokalemia (1/6 (17%) to 75/156 (48%) courses) and ALT increased (13/134 (10%) to 27/156 (17%) courses ) had the highest prevalence for non-hematologic AEs.
ALL courses had higher rates of chemistry and hepatic AEs over all courses than AML courses. Patients with ALL experienced the greatest number of different AEs during induction and maintenance with prevalence ≥10% for ≥8 AEs (induction: Anemia, PLT decreased, WBC decreased, ANC decreased, ALC decreased, ALT increased, Hypokalemia, Hypocalcemia; maintenance: Anemia, PLT decreased, WBC decreased, ANC decreased, ALC decreased, ALT increased, AST increased, Blood Bilirubin increased, Hypocalcemia). AE prevalence varied by course (Table 3, Appendix p5). ALT increased occurred frequently in every course but did vary by course (induction: 210/848 (25%), consolidation: 313/811 (39%), IM: 341/1169 (29%), DI: 115/728 (16%), maintenance: 323/506 (64%); p<0·0001). During maintenance, 82/506 (16%) patients had bilirubin increased.
There were no consistent differences in AE prevalence by age category, sex, race, or ethnicity across courses for AML patients, however Black patients had non-statistically significant increased AEs in many courses (Appendix p6–13). ALL patients age ≥10 years had a higher prevalence of laboratory AE across laboratory test categories (Appendix p14–15). This was especially notable in some, but not all, courses for blood bilirubin increased (induction: 1–9.99 years 23/592 (4%), ≥10 years 30/256 (12%), p<0·0001; consolidation: 1–9.99 years 13/576 (2%), ≥10 years 21/234 (9%), p=0·0002; IM: 1–9.99 years 6/862 (1%), ≥10 years 9/306 (3%), p=0·011; DI: 1–9.99 years 10/528 (2%), ≥10 years 6/199 (3%), p=0·65; maintenance: 1–9.99 years 52/379 (14%), ≥10 years 30/126 (24%), p=0·026). For ALL courses, Hispanic patients had higher prevalence of LFT AEs across many courses (ALT increased: induction – Hispanic 81/243 (33%), Non-Hispanic 129/605 (21%), p=0·0004; consolidation – Hispanic 120/227 (53%), Non-Hispanic 193/584 (33%), p<0·0001; IM – Hispanic 159/345 (46%), Non-Hispanic 182/824 (22%), p<0·0001; DI – Hispanic 56/209 (27%), Non-Hispanic 59/519 (11%), p<0·0001; maintenance – Hispanic 104/145 (72%), Non-Hispanic 219/361 (61%), p=0·024; AST increased: induction – Hispanic 27/243 (11%), Non-Hispanic 46/605 (8%), p=0·11; consolidation – Hispanic 31/227 (14%), Non-Hispanic 41/584 (7%), p=0·0038; IM – Hispanic 55/345 (16%), Non-Hispanic 53/824 (6%), p<0·0001; DI – Hispanic 13/209 (6%), Non-Hispanic 16/519 (3%), p=0·060; maintenance – Hispanic 31/145 (21%), Non-Hispanic 46/361 (13%), p=0·020; GGT increased: induction – Hispanic 29/243 (12%), Non-Hispanic 40/605 (6%), p=0·013; consolidation – Hispanic 27/227 (12%), Non-Hispanic 44/584 (8%), p=0·053; IM – Hispanic 29/345 (8%), Non-Hispanic 41/824 (5%), p=0·030; DI – Hispanic 10/509 (5%), Non-Hispanic 14/519 (3%), p=0·017; maintenance – Hispanic 15/145 (10%), Non-Hispanic 24/361 (7%), p=0·020; blood bilirubin increased: induction – Hispanic 20/243 (8%), Non-Hispanic 33/605 (5%), p=0·16; consolidation – Hispanic 12/227 (5%), Non-Hispanic 23/584 (4%), p=0·044; IM – Hispanic 5/345 (1%), Non-Hispanic 10/824 (1%), p=0·78; DI – Hispanic 5/209 (2%), Non-Hispanic 11/519 (2%), p=0·79; maintenance – Hispanic 32/145 (22%), Non-Hispanic 50/361 (14%), p=0·032) and of anemia in IM (Hispanic: 35/120 (35%); Non-Hispanic: 211/605 (26%); p=0.0017) and PLT decreased in IM (Hispanic: 91/243 (26%); Non-Hispanic: 143/605 (17%); p=0.0006, Appendix p16–17). There were no other consistent differences by sex and race for other AEs across ALL courses (Appendix p18–21).
There were no consistent differences in prevalence of AEs in AML based on if patients were enrolled on a trial (Appendix p22–3). ALL patients not enrolled on a clinical trial had statistically significant higher prevalence of hematologic AEs in consolidation (Anemia: Not on Study (NOS) 211/282 (75%), On Study 343/528 (65%), p=0.0043; PLT decreased: NOS 184/282 (65%), On Study 279/528 (53%), p=0.0008; WBC decreased: NOS 217/282 (77%), On Study 348/528 (66%), p=0.0013, ANC decreased: NOS 234/282 (83%), On Study 404/528 (77%), p=0.038; ALC decreased: NOS 190/282 (67%), On Study 310/528 (59%), p=0·019; Appendix p24–5). No other courses or AEs were consistently different based on trial enrollment.
Comparing laboratory AEs during specific chemotherapy regimens, laboratory AE prevalence in induction II was comparable for ADE and MA except for higher ALC decreased rates (ADE 22/40 (55%), MA 47/57 (82%), PR 1·50, 95% CI 1·11–2·03, p=0·0033) and hypokalemia (ADE 4/40 (10%), MA 16/57 (28%), PR 2·81, 95% CI 1·01–7·77, p=0·047; Appendix p26–7) with MA. Evaluating CMTX and HDMTX in IM, HDMTX courses had significantly higher prevalence of hematologic, hepatic enzyme, and electrolyte AEs (anemia: CMTX 117/642 (18%), HDMTX 192/449 (43%), PR 2·43, 95% CI 1·93–2·85, p<0·0001; PLT decreased: CMTX 83/642 (13%), HDMTX 133/449 (30%), PR 2·29, 95% CI 1·79–2·93, p<0·0001; WBC decreased: CMTX 216/642 (34%), HDMTX 320/449 (71%), PR 2·12, 95% CI 1·87–2·40, p<0·0001; ANC decreased: CMTX 446/642 (69%), HDMTX 363/449 (81%), PR 1·16, 95% CI 1·09–1·25, p<0·0001; ALC decreased: CMTX 150/642 (23%), HDMTX 287/449 (64%), PR 2·74, 95% CI 2·34–3·20, p<0·0001; ALT increased: CMTX 159/642 (25%), HDMTX 150/449 (33%), PR 1·34, 95% CI 1·12–1·63, p=0·0021, AST increased: CMTX 39/642 (6%), HDMTX 58/449 (13%), PR 2·12, 95% CI 1·44–3·13, p=0·0001, GGT increased: CMTX 23/642 (4%), HDMTX 43/449 (10%), PR 2·67, 95% CI 1·63–4·37, p<0·0001, hypokalemia: CMTX 19/642 (3%), HDMTX 158/449 (35%), PR 11·89, 95% CI 7·50–18·84, p<0·0001, hypocalcemia CMTX 5/642 (1%), HDMTX 21/449 (5%), PR 6·00, 95% CI 2·28–15·81, p<0·0001; Appendix p28–9).
Based on data reported to COG, there were no differences in the percentage of patients with ≥1 grade 3–4 AE between those enrolled on AAML1031 in LEARN and those treated at non-LEARN COG sites for the 17 non-hematologic AEs in this study. LEARN included 79 patients enrolled on AAML1031 induction I and 322 patients enrolled on AALL0932 induction; these patients were all included in the data included from the COG cohort (Figure 1). Overall, the prevalence for ExtractEHR-ascertained laboratory AEs were higher compared to COG-reported prevalence with 85% of rate comparisons higher in ExtractEHR-ascertained data (187/220 total comparisons in 22 AEs in four AAML1031 and six AALL0923 courses, Figure 2, Appendix p30–35).
Figure 2:

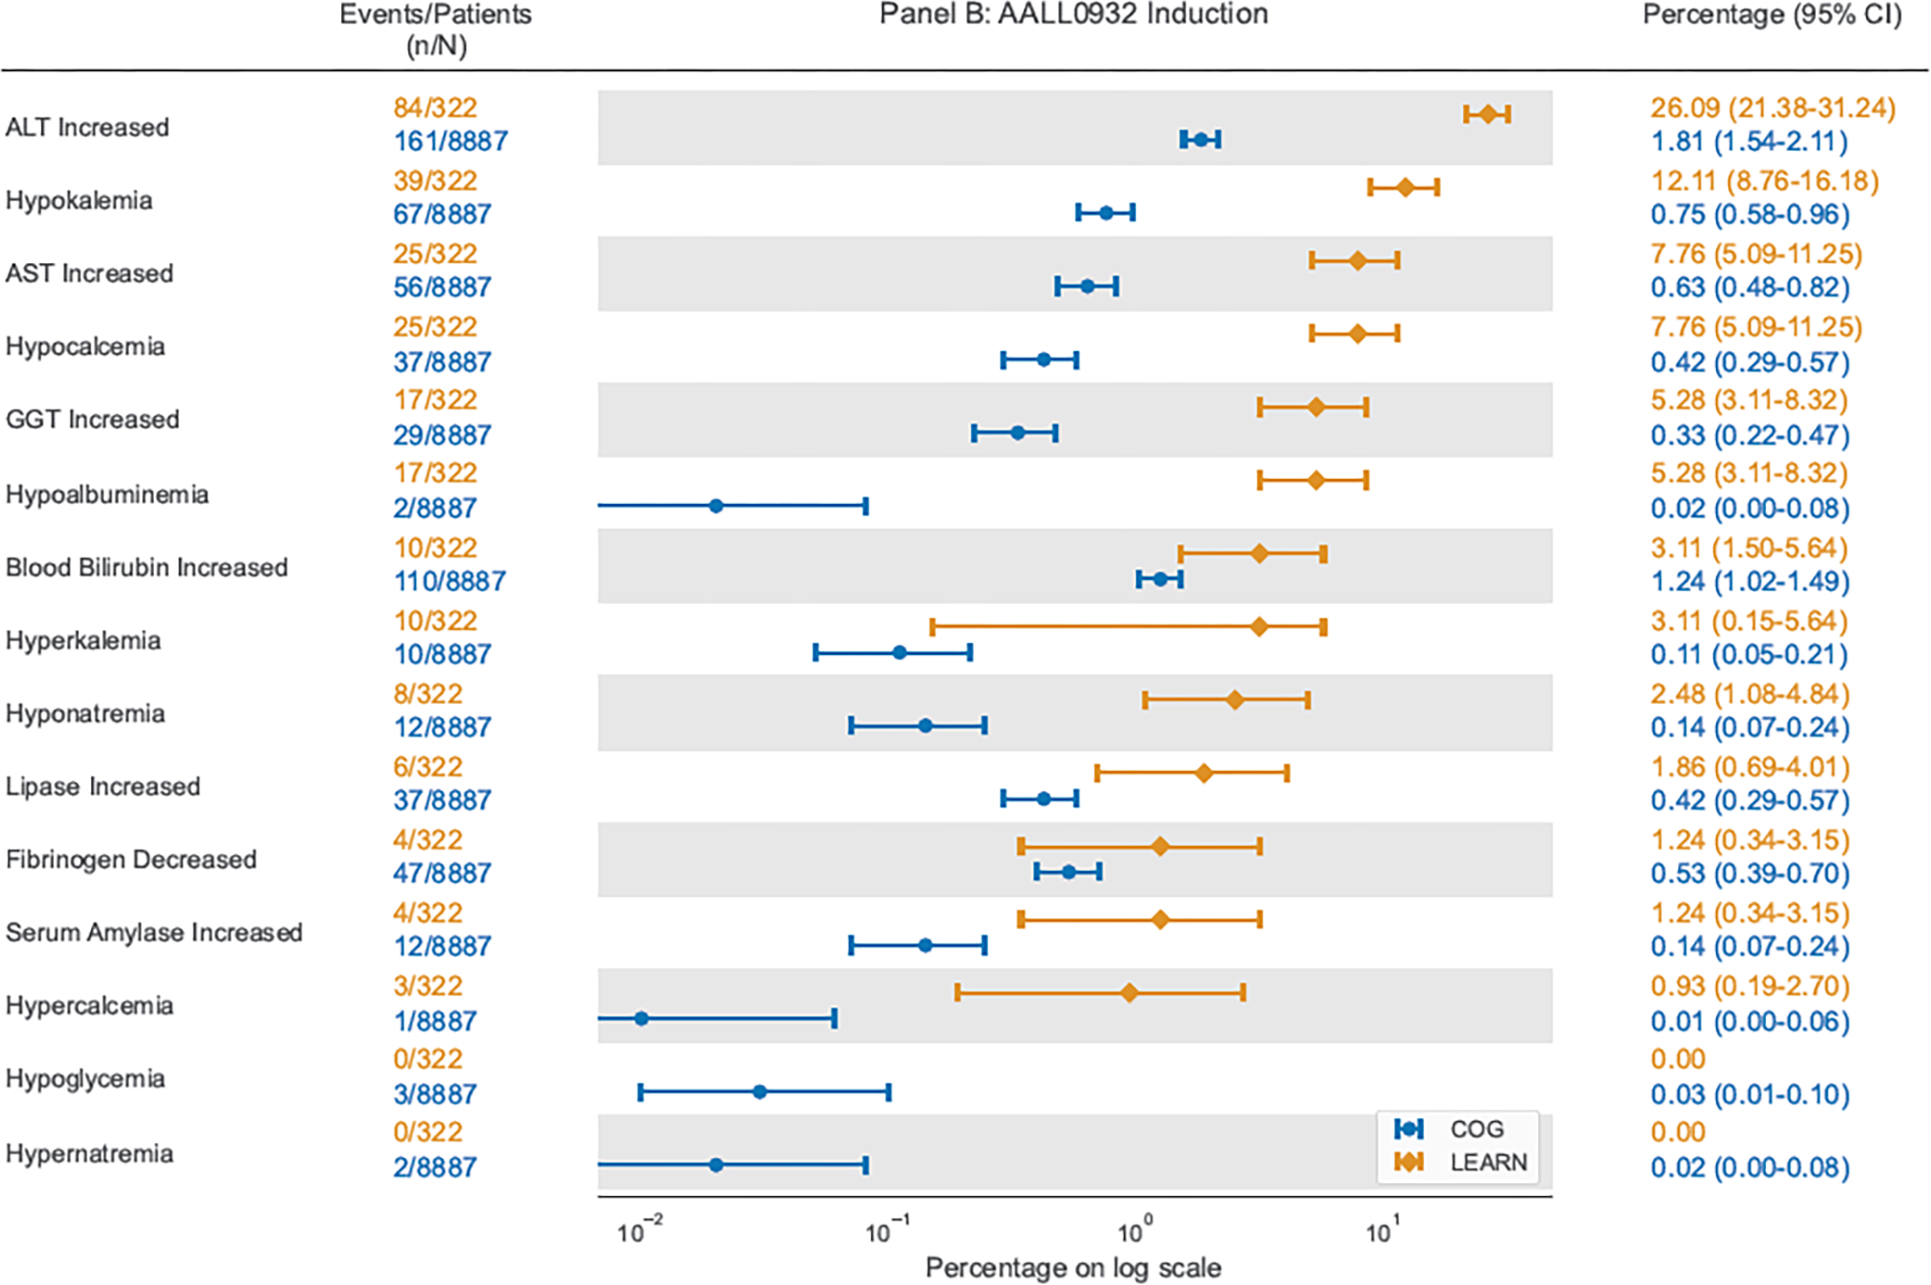
Comparison of proportion of courses with each grade 3–4 laboratory AE using COG AE reports on AAML1031 Induction I or AALL0932 Induction and using ExtractEHR-based AE capture for patients in LEARN enrolled on AAML1031 or AALL0932
COG = Children’s Oncology Group; LEARN = Leukemia Electronic Abstraction of Records Network; ALT = Alanine Aminotransferase; AST = Aspartate Aminotransferase; GGT = Gamma Glutamyl Transferase; PTT = Partial Thromboplastin Time
Data presented include point estimates shown as circles for COG data and diamonds for LEARN data with surrounding bars demonstrating 95% exact confidence intervals.
Specifically, ExtractEHR rates of hepatic AEs were markedly higher in all courses besides intensification I, especially for ALT increased (COG AAML1031: 46/1133 (4%) to 79/1221 (7%); ExtractEHR AAML1031: 3/68 (4%) to 14/79 (18%); COG AALL0932: 8/3403 (0%) to 72/3371 (2%), ExtractEHR AALL0932: 20/190 (11%) to 88/139 (63%)). Rates of ALT increased in ALL were remarkably different with a two-log times difference in point estimates in Maintenance (COG AALL0932: 21/2956, 1%; ExtractEHR AALL0932: 88/139, 63%). The large COG sample size resulted in narrow 95% CIs of 0% to 1% around the 1% point estimate Rates of hypokalemia and hypocalcemia were also higher using ExtractEHR ascertainment (Figure 2, Appendix p36–41). Of the 15% of course comparisons where COG AE rates were higher (AML: 25, ALL: 8), the baseline COG AE rate was very low: <1% for AALL0932 and <2% for AAML1031.
Discussion
This study demonstrates the feasibility of multi-center, automated ascertainment and grading of laboratory AEs directly from the EHR as data were comprehensively extracted from three sites and graded centrally. This detailed capture of laboratory results markedly improves multi-site laboratory AE quantification and provides the first comprehensive dataset describing laboratory AEs experienced by pediatric patients with ALL and AML. These data can impact the definitions of dose-limiting toxicity (DLT) thresholds, guide comparative effectiveness analyses between experimental and standard therapies using “real world” data,28 and be used to counsel patients regarding the risks of standard ALL and AML chemotherapy.
Importantly, automated extraction identified significantly higher laboratory AE rates than COG trial reports for most courses. ExtractEHR detected markedly higher rates of ALT increased in both AML and ALL, most notably in ALL maintenance where 63% of courses in LEARN had grade 3–4 ALT increased, while only 1% of patients in maintenance were reported to have this AE in COG trial data. The very narrow 95% CI around the COG-derived point estimate highlights the high precision of an inaccurate laboratory AE estimate. This increase in AE rates using ExtractEHR-ascertainment was also observed in a targeted laboratory AE (blood bilirubin increased) on the AALL0932 trial. These results are consistent with our previously published multi-site data that demonstrated significant, widespread under-reporting of AEs compared to a gold standard physician chart abstraction with sensitivity less than 22% for all AEs included.13 These increased rates of hepatotoxicity may indicate that there were requirements for chemotherapy dose modifications that were not captured on protocols due to under-reporting of laboratory AEs. Work is ongoing to evaluate these results relative to protocol-specified dose modifications to better understand the impact of these AEs. Further, these results may be used to re-define laboratory values that trigger DLT thresholds in future studies given higher AE rates than previously understood.
These data exemplify how manual reporting does not provide accurate laboratory AE data to providers, patients, and families. This degree of underreporting also limits secondary analyses investigating toxicities, dose modifications and delays, and outcomes using manually-obtained laboratory AE data. The small number of courses in which COG-reported AE rates were higher than ExtractEHR-ascertained AEs and where CIs overlapped may be due to smaller LEARN cohort size that limited the detection of low prevalence AEs or false positive COG reports. This may be resolved by implementation of ExtractEHR at additional sites.
Our results strongly suggest that automated AE ascertainment can be used to reduce manual effort, which should improve trial AE reporting efficiency. As seen in the appendix, most laboratory results are either within normal limits or represent grades that do not require reporting. Manual AE ascertainment requires a CRA to individually review each result and is time-consuming. Moreover, some AEs require comparisons to a baseline or normal ranges,10 which poses a risk for calculation errors.13 Automated grading can match protocol-specific requirements, and thus reduce ascertainment time and minimize computation errors. The efficiency gains provided by automated laboratory abnormality identification may extend to identification of complex AEs with a laboratory-defining component, such as hyperbilirubinemia for sinusoidal obstruction syndrome, which can be flagged for additional manual review.29
Automated laboratory data acquisition defines baseline AE rates for leukemia patients during therapy, regardless of trial enrollment. This addresses an unmet need in both clinical and trial communities, as these data are not currently available. These clinically relevant findings could guide selection of alternative chemotherapy regimens based on an individual’s comorbidities or past AEs. For example, we demonstrated significantly greater AEs with HDMTX than CMTX. If a patient previously had hepatic toxicity and there is concern for ongoing hepatic dysfunction, these data may inform shared clinical decision-making prior to starting IM and improve understanding of risk.
Automated ascertainment provides more granular datasets that can be used for real world data research. Patients with ALL aged 10 years or older at diagnosis receive high risk therapy that may cause greater toxicity, but this marginal toxicity risk is challenging to determine due to under-reporting on clinical trials. ExtractEHR data demonstrating higher AE prevalence in older children support use of automated methods to investigate these differences. The accurate AE rates permit precise delineation of risk and if AEs lead to dose changes that could impact outcomes. Further, the higher hepatic AE rates identified in Hispanic patients identifies an important outcome disparity that automated extraction may help delineate. Additionally, on phase III trials, AEs are typically captured as the highest grade during each course, which does not capture daily, longitudinal toxicity experience.9,20 The comprehensive daily laboratory AE data provided by ExtractEHR enables differentiation between a single day of a Grade 4 laboratory AE from an extended toxicity duration.
These approaches can be beneficial within COG and other cooperative groups. Two key steps are required for implementation of automated laboratory AE ascertainment within a cooperative group: real-time ascertainment and automated AE deposition into trial electronic data capture (EDC) systems. We are currently testing implementation in two clinical trials. In the COG high risk neuroblastoma (NBL) trial, ANBL1531 (NCT03126916), automated laboratory AE ascertainment is performed at select sites and a list of the highest AE grade in each course is returned to the CRA for input into the EDC. The impact of this process on CRA time and effort will be quantified. PEPN21EHR/PBTC-N15 (NCT05020951), a joint study within the COG Pediatric Early Phase Clinical Trials Network (PEPCTN) and the Pediatric Brain Tumor Consortium (PBTC), is testing automated uploading of laboratory AE data into the EDC after ascertainment using ExtractEHR or other locally-developed automated methods.
These promising results have important limitations to acknowledge. First, while LEARN is multi-center, further work is needed to overcome implementation barriers at additional sites at the scale needed to improve cooperative group trial laboratory AE data. This is the overarching aim of the NCI-supported PEPN21EHR/PBTC-N15 trial. Epic™ is the EMR system at approximately 60% of the leading children’s hospitals in the United States (personal communication, Bimal Desai MD, January 6, 2022), thus creating a potential pathway for broader implementation across COG centers. Furthermore, efforts are ongoing to implement ExtractEHR at a hospital that uses the Cerner EHR (Kansas City, MO). Demonstrating generalizability of ExtractEHR across EHR vendors is a critical next step in improving laboratory AE reporting in COG trials.
Another key limitation is that ExtractEHR currently requires mapping of individual laboratory tests at each institution. This requires dedicated clinician and information systems resources; however, once completed, the mapping may be reused for any research project using automated laboratory data extraction. Work is ongoing to extract EHR data through HL7-FHIR, a standard for exchange of healthcare data between different systems, to decrease dedicated support required for mapping. As a technical limitation, a small fraction of laboratory results may not appear in the EHR due to downtime or tests performed at an outside facility being scanned into the EHR as a pdf. The impact from missing data is expected to be very small, particularly for the commonly assessed laboratory tests and for higher-grade AEs requiring hospitalization at these LEARN sites. Further, the comparisons of AE rates by demographics and trial enrollment may be limited by potential confounders, such as when certain clinical trials were open for enrollment. Future work should evaluate this in more detail. Lastly, not all laboratory AEs were included in this initial work, in part because of grading definition limitations in CTCAE v5 and our focus on developing alternative reporting mechanisms for the most common, clinically relevant laboratory AEs. However, ExtractEHR can extract all EHR laboratory test results and work is ongoing to expand to other tests and non-numeric EHR data elements.
In summary, we have implemented an efficient, standardized, and accurate automated ascertainment and assessment process for laboratory AEs using data from multiple pediatric hospitals. The data ascertained in this study describe expected AE rates for patients during each chemotherapy course that are more comprehensive than trial-reported data and can be used as a baseline for comparison of experimental agents. Further, these results provide a detailed resource for clinical guidance and real world data research evaluating factors associated with incidence and resolution of laboratory AEs. Efforts are ongoing to expand the number of sites with automated laboratory AE ascertainment and grading and to incorporate medication and outcome data to investigate the impact of these AEs on therapy, relapse and survival. These efforts will further the development of comprehensive datasets that will not only improve cooperative group clinical trials, but also facilitate real world analyses that optimize clinical and supportive care.
Supplementary Material
Research in Context:
Evidence before this study: Prior to initiating this study in 2019 we performed a literature search using PubMed to identify if there was current literature regarding laboratory adverse event rates in patients with pediatric acute leukemia or regarding development of automated systems to extract laboratory data from the electronic health record in this population. We included the following terms: “laboratory adverse event rates” and “pediatric acute lymphoblastic leukemia;” “laboratory adverse event rates” and “pediatric acute myeloid leukemia;” adverse event cancer electronic medical record; adverse event reporting electronic health record; and adverse event reporting oncology. This search included all dates. All manuscripts that were identified were reviewed. The literature search was repeated in 2022 prior to submission of the manuscript. The searches did not identify prior literature regarding comprehensive laboratory adverse event rates or multi-center automated systems to extract adverse event data from the electronic health record. The single institution reports that were identified were found to be of sufficient quality to cite in the manuscript in the background.
Added value of this study: This is the first manuscript that describes implementation of an automated methodology to extract, process and grade laboratory result data for children with leukemia that is accurate and successful across multiple hospitals. The findings of this study therefore add a description of comprehensive laboratory adverse event rates for pediatric patients with acute lymphoblastic or myeloid leukemia that do not currently exist in the literature or from cooperative oncology group study reports. Additionally, the findings in this study add to the single institution studies currently in the literature to demonstrate that there is a system for extracting electronic health record data that is feasible to implement across multiple hospitals. This is a crucial step towards finding ways to improve capture of toxicities across cooperative oncology groups.
Implications of all the available evidence: Given the under-reporting and misreporting that we and others have previously demonstrated on pediatric oncology clinical trials, these results provide crucial data about accurate rates of toxicities that can serve as a reference for clinicians or researchers. Further, these results have implications for how to approach capture of laboratory adverse events on clinical trials in the future as the findings indicate that there are more accurate methods than those that are currently used. This could lead to policy changes regarding manual capture of adverse event data on clinical trials. Ongoing research is testing the ExtractEHR automated package on clinical trials, including upload of data in an automated way into the electronic data capture system. Future research will test expansion to additional hospitals utilizing a range of electronic health record systems and with different volumes of patients. Further, future research will expand to other non-laboratory adverse events to add to the evidence provided in this manuscript.
Acknowledgements
We would like to thank Rochelle Bagatell, MD (Children’s Hospital of Philadelphia, Philadelphia, PA), Steven Dubois, MD, MS (Dana-Farber Cancer Institute, Boston, MA), Elizabeth Fox, MD, MS (St. Jude Children’s Research Hospital), and Arzu Onar-Thomas, PhD (St. Jude Children’s Research Hospital) for their support of this work. This work was partially funded by the National Institutes of Health, St. Baldrick’s Foundation and Alex’s Lemonade Stand Foundation and we would like to thank these funders of this research.
Funding Sources
This research was supported by NIH K07CA211959, NIH K01HL143153, NCTN Operations Center Grant (U10CA180886), NCTN Statistics & Data Center Grant (U10CA180899), St. Baldrick’s Foundation, and Alex’s Lemonade Stand Foundation Epidemiology Grant.
Footnotes
Declaration of Interests
The authors disclose the following relationships: Children’s Oncology Group (SMC, PCA), Alex’s Lemonade Stand Foundation (MHD), Epic Systems (MHD), Pfizer (BTF, DSH), Merck (BTF, DSH), Astellas (BTF), National Institutes of Health/National Cancer Institute (MMG, TPM, PCA), National Institutes of Health/National Heart, Lung, and Blood Institute (KDG), Cancer Prevention Research Institute of Texas (MMG), Hyundai Hope on Wheels (MMG), American Society of Clinical Oncology (MMG), Children’s Cancer Cause (MMG), American Society of Clinical Investigation (MMG), Incyte (DSH), Eli Lilly (DSH), E R Squibb & Sons (DSH), Jazz Pharmaceuticals (DSH), Bayer (DSH), Astra Zeneca (DSH), Sanofi (PCA), American Academic of Pediatrics (RWG), and American Board of Pediatrics (RWG). The content is solely the responsibility of the authors and does not necessarily represent the official views of the National Institutes of Health.
Publisher's Disclaimer: This is a PDF file of an unedited manuscript that has been accepted for publication. As a service to our customers we are providing this early version of the manuscript. The manuscript will undergo copyediting, typesetting, and review of the resulting proof before it is published in its final form. Please note that during the production process errors may be discovered which could affect the content, and all legal disclaimers that apply to the journal pertain.
Data Sharing
De-identified data are available with publication by request from the corresponding author (tamara.miller@emory.edu).
References
- 1.Hayashi RJ, Winter SS, Dunsmore KP, et al. Successful Outcomes of Newly Diagnosed T Lymphoblastic Lymphoma: Results From Children’s Oncology Group AALL0434. Journal of clinical oncology : official journal of the American Society of Clinical Oncology 2020; 38(26): 3062–70. [DOI] [PMC free article] [PubMed] [Google Scholar]
- 2.Salzer WL, Burke MJ, Devidas M, et al. Impact of Intrathecal Triple Therapy Versus Intrathecal Methotrexate on Disease-Free Survival for High-Risk B-Lymphoblastic Leukemia: Children’s Oncology Group Study AALL1131. Journal of clinical oncology : official journal of the American Society of Clinical Oncology 2020; 38(23): 2628–38. [DOI] [PMC free article] [PubMed] [Google Scholar]
- 3.Salzer WL, Jones TL, Devidas M, et al. Decreased induction morbidity and mortality following modification to induction therapy in infants with acute lymphoblastic leukemia enrolled on AALL0631: a report from the Children’s Oncology Group. Pediatric blood & cancer 2015; 62(3): 414–8. [DOI] [PMC free article] [PubMed] [Google Scholar]
- 4.Angiolillo AL, Schore RJ, Kairalla JA, et al. Excellent Outcomes With Reduced Frequency of Vincristine and Dexamethasone Pulses in Standard-Risk B-Lymphoblastic Leukemia: Results From Children’s Oncology Group AALL0932. Journal of clinical oncology : official journal of the American Society of Clinical Oncology 2021; 39(13): 1437–47. [DOI] [PMC free article] [PubMed] [Google Scholar]
- 5.Gamis AS, Alonzo TA, Meshinchi S, et al. Gemtuzumab ozogamicin in children and adolescents with de novo acute myeloid leukemia improves event-free survival by reducing relapse risk: results from the randomized phase III Children’s Oncology Group trial AAML0531. Journal of clinical oncology : official journal of the American Society of Clinical Oncology 2014; 32(27): 3021–32. [DOI] [PMC free article] [PubMed] [Google Scholar]
- 6.Aplenc R, Meshinchi S, Sung L, et al. Bortezomib with standard chemotherapy for children with acute myeloid leukemia does not improve treatment outcomes: a report from the Children’s Oncology Group. Haematologica 2020; 105(7): 1879–86. [DOI] [PMC free article] [PubMed] [Google Scholar]
- 7.Sivendran S, Latif A, McBride RB, et al. Adverse event reporting in cancer clinical trial publications. Journal of clinical oncology : official journal of the American Society of Clinical Oncology 2014; 32(2): 83–9. [DOI] [PubMed] [Google Scholar]
- 8.Thanarajasingam G, Hubbard JM, Sloan JA, Grothey A. The Imperative for a New Approach to Toxicity Analysis in Oncology Clinical Trials. Journal of the National Cancer Institute 2015; 107(10). [DOI] [PubMed] [Google Scholar]
- 9.Miller TP, Aplenc R. Evolution of Hematology Clinical Trial Adverse Event Reporting to Improve Care Delivery. Curr Hematol Malig Rep 2021; 16(2): 126–31. [DOI] [PMC free article] [PubMed] [Google Scholar]
- 10.NCI. National Cancer Institute Common Terminology Criteria for Adverse Events (CTCAE) v5.0. https://ctep.cancer.gov/protocolDevelopment/electronic_applications/ctc.htm. 2017.
- 11.Farber S, Diamond LK. Temporary remissions in acute leukemia in children produced by folic acid antagonist, 4-aminopteroyl-glutamic acid. The New England journal of medicine 1948; 238(23): 787–93. [DOI] [PubMed] [Google Scholar]
- 12.Miller TP, Getz KD, Demissei B, et al. Rates of Laboratory Adverse Events By Chemotherapy Course for Pediatric Acute Leukemia Patients within the Leukemia Electronic Abstraction of Records Network (LEARN). American Society of Hematology Annual Meeting. Orlando, FL: Blood; 2019. (Abstract). p. 333. [Google Scholar]
- 13.Miller TP, Li Y, Getz KD, et al. Using electronic medical record data to report laboratory adverse events. British journal of haematology 2017; 177(2): 283–6. [DOI] [PMC free article] [PubMed] [Google Scholar]
- 14.Miller TP, Li Y, Kavcic M, et al. Accuracy of Adverse Event Ascertainment in Clinical Trials for Pediatric Acute Myeloid Leukemia. Journal of clinical oncology : official journal of the American Society of Clinical Oncology 2016; 34(13): 1537–43. [DOI] [PMC free article] [PubMed] [Google Scholar]
- 15.Miller TP, Fisher BT, Getz KD, et al. Unintended consequences of evolution of the Common Terminology Criteria for Adverse Events. Pediatric blood & cancer 2019; 66(7): e27747. [DOI] [PMC free article] [PubMed] [Google Scholar]
- 16.Roche K, Paul N, Smuck B, et al. Factors affecting workload of cancer clinical trials: results of a multicenter study of the National Cancer Insititue of Canada clinical trials group. Journal of clinical oncology : official journal of the American Society of Clinical Oncology 2002; 20: 545–56. [DOI] [PubMed] [Google Scholar]
- 17.Miller TP, Marx MZ, Henchen C, et al. Challenges and Barriers to Adverse Event Reporting in Clinical Trials: A Children’s Oncology Group Report. J Patient Saf 2022; 18(3): e672–e9. [DOI] [PMC free article] [PubMed] [Google Scholar]
- 18.Scharf O, Colevas AD. Adverse event reporting in publications compared with sponsor database for cancer clinical trials. Journal of clinical oncology : official journal of the American Society of Clinical Oncology 2006; 24(24): 3933–8. [DOI] [PubMed] [Google Scholar]
- 19.Zhang S, Liang F, Tannock I. Use and misuse of common terminology criteria for adverse events in cancer clinical trials. BMC Cancer 2016; 16(1): 392. [DOI] [PMC free article] [PubMed] [Google Scholar]
- 20.Thanarajasingam G, Minasian LM, Baron F, et al. Beyond maximum grade: modernising the assessment and reporting of adverse events in haematological malignancies. Lancet Haematol 2018; 5(11): e563–e98. [DOI] [PMC free article] [PubMed] [Google Scholar]
- 21.Lee S, Choi J, Kim HS, et al. Standard-based comprehensive detection of adverse drug reaction signals from nursing statements and laboratory results in electronic health records. J Am Med Inform Assoc 2017; 24(4): 697–708. [DOI] [PMC free article] [PubMed] [Google Scholar]
- 22.Lencioni A, Hutchins L, Annis S, et al. An adverse event capture and management system for cancer studies. BMC bioinformatics 2015; 16 Suppl 13: S6. [DOI] [PMC free article] [PubMed] [Google Scholar]
- 23.Niland JC, Stiller T, Neat J, Londrc A, Johnson D, Pannoni S. Improving patient safety via automated laboratory-based adverse event grading. J Am Med Inform Assoc 2012; 19(1): 111–5. [DOI] [PMC free article] [PubMed] [Google Scholar]
- 24.Yi JS, Chambers TM, Getz KD, et al. A report from the Leukemia Electronic Abstraction of Records Network on risk of hepatotoxicity during pediatric acute lymphoblastic leukemia treatment. Haematologica 2022. [DOI] [PMC free article] [PubMed] [Google Scholar]
- 25.Larsen EC, Devidas M, Chen S, et al. Dexamethasone and High-Dose Methotrexate Improve Outcome for Children and Young Adults With High-Risk B-Acute Lymphoblastic Leukemia: A Report From Children’s Oncology Group Study AALL0232. Journal of clinical oncology : official journal of the American Society of Clinical Oncology 2016; 34(20): 2380–8. [DOI] [PMC free article] [PubMed] [Google Scholar]
- 26.Maloney KW, Devidas M, Wang C, et al. Outcome in Children With Standard-Risk B-Cell Acute Lymphoblastic Leukemia: Results of Children’s Oncology Group Trial AALL0331. Journal of clinical oncology : official journal of the American Society of Clinical Oncology 2020; 38(6): 602–12. [DOI] [PMC free article] [PubMed] [Google Scholar]
- 27.Dunsmore KP, Winter SS, Devidas M, et al. Children’s Oncology Group AALL0434: A Phase III Randomized Clinical Trial Testing Nelarabine in Newly Diagnosed T-Cell Acute Lymphoblastic Leukemia. Journal of clinical oncology : official journal of the American Society of Clinical Oncology 2020; 38(28): 3282–93. [DOI] [PMC free article] [PubMed] [Google Scholar]
- 28.Yi JS, Chambers T, Getz KD, et al. Transient Elevations in Markers of Hepatic Function during Pediatric Acute Lymphoblastic Leukemia Treatment Are Common but Do Not Influence Outcomes: A Study of 805 Patients from the Learn Consortium. American Society of Hematology Annual Meeting. Orlando, FL: Blood; 2019. [Google Scholar]
- 29.Mahadeo KM, Bajwa R, Abdel-Azim H, et al. Diagnosis, grading, and treatment recommendations for children, adolescents, and young adults with sinusoidal obstructive syndrome: an international expert position statement. Lancet Haematol 2020; 7(1): e61–e72. [DOI] [PubMed] [Google Scholar]
Associated Data
This section collects any data citations, data availability statements, or supplementary materials included in this article.
Supplementary Materials
Data Availability Statement
De-identified data are available with publication by request from the corresponding author (tamara.miller@emory.edu).