

Abstract
Objective:
People with HIV (PWH) have persistently elevated levels of inflammation and immune activation despite suppressive antiretroviral therapy (ART), with specific biomarkers showing associations with non-AIDS-defining morbidities and mortality. We investigated the potential role of the HIV-specific adaptive immune response, which also persists under ART, in driving levels of these clinically relevant biomarkers.
Design:
Cohort-based study.
Methods:
HIV-specific IFN-γ-producing T-cell responses and antibody concentrations were measured in blood at study entry in the ACTG A5321 cohort, following a median of 7 years of suppressive ART. HIV persistence measures including cell-associated (CA)-DNA, CA-RNA, and plasma HIV RNA (single-copy assay) were also assessed at study entry. Plasma inflammatory biomarkers and T-cell activation and cycling were measured at a pre-ART time point and at study entry.
Results:
Neither the magnitudes of HIV-specific T-cell responses nor HIV antibody levels were correlated with levels of the inflammatory or immune activation biomarkers, including hs-CRP, IL-6, neopterin, sCD14, sCD163, TNF-α, %CD38+HLA-DR+ CD8+ and CD4+ cells, and %Ki67+ CD8+ and CD4+ cells – including after adjustment for pre-ART biomarker level. Plasma HIV RNA levels were modestly correlated with CD8+ T-cell activation (r = 0.25, p = 0.027), but other HIV persistence parameters were not associated with these biomarkers. In mediation analysis, relationships between HIV persistence parameters and inflammatory biomarkers were not influenced by either HIV-specific T-cell responses or antibody levels.
Conclusions:
Adaptive HIV-specific immune responses do not appear to contribute to the elevated inflammatory and immune activation profile in persons on long-term ART.
Keywords: HIV, reservoir, T-cell responses, antibodies, inflammation, immune activation, mediation analysis
Introduction
Antiretroviral therapy (ART) can durably suppress human immunodeficiency virus (HIV) viremia in people with HIV (PWH), yet despite effective ART and host antiviral immune responses HIV persists in a reservoir of infected cells necessitating lifelong treatment. ART abrogates viral replication, resulting in a tremendous decline in AIDS-related morbidity and mortality. Yet, even in the setting of long-term, well-controlled HIV infection, PWH on ART demonstrate elevated levels of inflammation and immune activation [1–4] – especially when ART was initiated in chronic infection – which predict a broad array of morbidities and increased mortality [5–8].
The etiology of persistent inflammation and immune activation under ART is incompletely understood, though multiple potential mechanisms likely contribute, including increased intestinal permeability and microbial translocation [9–11], co-infections such as cytomegalovirus (CMV) [12,13], and lymphoid tissue fibrosis [14]. A role has also been proposed for HIV reservoirs [15], and a recent study reported that measures of HIV persistence in gut tissue are associated with a marker of monocyte/macrophage activation [16], though we have previously shown that markers of HIV persistence in peripheral blood are not associated with inflammation or immune activation during long-term ART [4,17]. We have also previously shown that HIV-specific T-cell and antibody responses persist under long-term ART and are associated with HIV DNA levels in peripheral blood mononuclear cells (PBMCs) [18–20]. However, it is not known if these on-ART HIV-specific immune responses play a role in driving persistent inflammation and immune activation, despite multiple potential mechanisms by which this could occur. As one example, the release of effector cytokines – in particular interferon-gamma (IFN-γ) – from activated T-cells responding to specific pathogens has been linked to macrophage activation and release of pro-inflammatory cytokines [21,22]. Further, interferon-gamma-induced protein 10 (IP-10), which is elevated in both untreated and treated HIV disease and correlates with other inflammatory markers [23], is induced by either IFN-γ or tumor necrosis factor alpha (TNF-α) [23] – both of which are produced by high proportions of HIV-specific T-cells [24]. Additionally, antibody immune complexes and Fc-mediated effector functions can promote immune cell maturation and activation, leading to production of some of the pro-inflammatory mediators known to be elevated in antiretroviral (ARV)-treated HIV infection [25].
Here, we sought to determine whether ongoing HIV-specific immune responses contribute to levels of clinically relevant inflammatory and immune activation (T-cell activation and cycling) biomarkers – selected for analysis based on prior reports of associations with morbidities and/or mortality [1–5] – in PWH on long-term ART. We use mediation analysis, an advanced statistical procedure, to additionally test models of the three-way relationship between HIV persistence measures, HIV-specific immune responses, and levels of inflammation.
Methods
Study design and approval
Data for this manuscript were collected from a longitudinal cohort of participants who initiated ART during viremic chronic HIV infection in AIDS Clinical Trials Group (ACTG) trials for treatment-naive individuals and enrolled in the ACTG HIV Reservoirs Cohort Study (A5321) [17]. Participants had no reported ART interruptions, with plasma HIV RNA levels <50 copies/mL by commercial assays at or before week 48 of ART and at all subsequent time points (isolated measurements <200 copies/mL were allowed). Clinical data were available from pre-ART and on-ART study visits. Study procedures were performed in accordance with the Declaration of Helsinki. Informed consent was obtained from all participants, collected by the participating ACTG clinic. The institutional review boards at the authors’ institutions approved the study.
Virologic assays
HIV cell-associated (CA) DNA (CA-DNA) and RNA (CA-RNA) were measured by quantitative PCR (qPCR) assays in PBMCs using previously described methods [26]. Cell-free HIV RNA was quantified by integrase single-copy assay (iSCA) in blood plasma (5 mL) [27].
Immunologic assays
Levels of soluble biomarkers were evaluated from longitudinal frozen plasma samples, which were thawed and analyzed in batches that included all samples for a participant, as previously described [17]. In brief, plasma concentrations of high-sensitivity C-reactive protein (hs-CRP), interleukin 6 (IL-6), IP-10, neopterin, soluble CD14 (sCD14), soluble CD163 (sCD163), and TNF-α were quantified using enzyme-linked immunosorbent assay (ELISA) kits per manufacturer’s instructions (R&D, Minneapolis, MN). Levels of T-cell activation and cell-cycling biomarkers in longitudinal cryopreserved PBMCs from each participant were determined in batch using multicolor flow cytometry.
IFN-γ ELISPOT assays
IFN-γ enzyme-linked immune absorbent spot (ELISPOT) assays against HIV-gene product peptide pools and a CMV-pp65 peptide pool were performed as previously described [18]. In brief, Multiscreen IP 96-well plates (Millipore) were coated with 0.5 μg/mL of anti-IFN-γ antibody (clone 1-D1K, Mabtech, Sweden) in phosphate-buffered saline and incubated overnight. Plates were washed, PBMCs were added at 2 × 10⁵ cells per well, and HIV peptide pools or CMV-pp65 peptide pool (10 μg/mL/peptide) and phytohemagglutinin (2 μg/mL) were added. Plates were incubated overnight, washed and secondary antibody was added (clone 7-B6–1, Mabtech) and incubated for 1 hour. Plates were developed with Streptavidin-ALP (Mabtech) and Color Development Buffer (Bio-Rad, Hercules, CA). ELISPOT responses were background subtracted prior to data analysis.
HIV antibody assays
HIV antibodies were measured as previously described [19]. In brief, Less-sensitive (LS) and Avidity-modified VITROS® HIV 1 + 2 were used to measure antibodies against HIV envelope (Env) [28]. The signal-to-cutoff ratio value, reported by the VITROS ECi robot, was used as the measure of the HIV antibody level [29].
Statistics
Statistical analyses including univariate statistics and nonparametric Spearman correlations and partial correlations were performed in SAS v.9.4 (SAS Institute Inc., Cary, NC). For hs-CRP values above the limit of assay detection (10,000 ng/mL), values were analyzed as the highest rank. For CA-RNA and plasma HIV RNA via iSCA values below the limits of assay detection (13.6 copies/million CD4+ T-cells and 0.7 copies/mL, respectively), values were analyzed as the lowest rank.
Mediation analysis was performed using structural equation modeling (SEM) in the SAS CALIS procedure. In brief, variables used in SEM models were rank-transformed [30] using the SAS RANK procedure in order to match the nonparametric Spearman correlation approach. Next, standardized path coefficients for hypothesized mediation models (analogous to regression coefficients) were estimated by maximum likelihood using the PATH statement in the CALIS procedure. Standardization of coefficients allows for comparisons of effects among different sets of paths in the same model, when variables are often measured on different scales. Model fit was assessed by the root mean square error of approximation (RMSEA) and the Bentler-Bonnet Normed Fit Index (NFI). Significance tests for indirect effects were produced using the EFFPART statement. For more on mediation analysis using SEM, we refer readers to [31,32].
Results
Study population
We previously assessed HIV-specific T-cell responses, along with CMV-pp65-specific T-cell responses, by IFN-γ ELISPOT in 99 participants from the ACTG A5321 cohort [18]. Participants initiated ART during chronic HIV infection and had subsequent well-documented, sustained virologic suppression prior to study entry (Figure S1) and throughout the study period [17,20]. Responses were measured at A5321 study entry, a median of 7 (range 4 to 15) years after ART initiation, by IFN-γ ELISPOT assays with peptide pools spanning: i) HIV-Gag, ii) HIV-Env, iii) HIV-Pol, iv) HIV-Nef/Tat/Rev (combined peptide pool), and v) CMV-pp65. In this previous study as well as in a follow-up longitudinal study [18,20], ELISPOT responses were background subtracted (thus, nonzero responses were >1x background), but no other ad hoc empirical positivity cutoff was applied and all responses were included objectively. We also previously measured antibody levels against HIV-Env in 101 participants from the A5321 cohort at study entry [19], with an overlap of 80 participants between those with T-cell response measurements and HIV antibody level measurements. Participant characteristics relevant to the current study are provided in Tables 1 and S1.
Table 1.
Participant characteristics (n=99)
| Characteristic (at A5321 study entry unless noted) | Median (range) or No. (%) | Missing No. (%) |
|---|---|---|
| Socio-demographics | ||
| Age | 43 (23 – 74) | 0 (0.00%) |
| Sex, No., % | 0 (0.00%) | |
| Female | 25 (25.25%) | |
| Male | 74 (74.75%) | |
| Race/Ethnicity, No., % | 0 (0.00%) | |
| White non-Hispanic | 49 (49.49%) | |
| Black non-Hispanic | 18 (18.18%) | |
| Hispanic (regardless of race) | 30 (30.30%) | |
| Asian, Pacific Islander | 0 (0.00%) | |
| American Indian, Alaskan Native | 2 (2.02%) | |
| Participant does not know or other/unknown | 0 (0.00%) | |
| More than one race | 0 (0.00%) | |
| Antiretroviral therapy information | ||
| Years on ART | 6.8 (4.2 – 14.8) | 0 (0.00%) |
| ARV regimen group, No., % | 0 (0.00%) | |
| INSTI containing | 26 (26.26%) | |
| NNRTI containing | 43 (43.43%) | |
| PI containing | 29 (29.29%) | |
| PI + INSTI containing | 1 (1.01%) | |
| T-cell responses | ||
| Gag IFN-γ (SFU/106 PBMCs) | 85.0 (0.0 – 2027.5) | 0 (0.00%) |
| Env IFN-γ (SFU/106 PBMCs) | 12.5 (0.0 – 395.0) | 0 (0.00%) |
| Pol IFN-γ (SFU/106 PBMCs) | 90.0 (0.0 – 1537.5) | 0 (0.00%) |
| Nef/Tat/Rev IFN-γ (SFU/106 PBMCs) | 35.0 (0.0 – 1172.5) | 0 (0.00%) |
| Sum HIV IFN-γ (SFU/106 PBMCs) | 292.5 (0.0 – 3220.0) | 0 (0.00%) |
| CMV-pp65 IFN-γ (SFU/106 PBMCs) | 1113.8 (0.0 – 3027.5) | 9 (9.09%) |
| Inflammatory biomarkers | ||
| hs-CRP (ng/mL) | 1496.2 (93.6 - >10000.0) | 0 (0.00%) |
| IL-6 (pg/mL) | 1.5 (0.2 – 8.8) | 0 (0.00%) |
| IP-10 (pg/mL) | 123.6 (45.3 – 2475.4) | 0 (0.00%) |
| Neopterin (nMol/L) | 9.5 (3.1 – 70.8) | 0 (0.00%) |
| sCD14 (ng/mL) | 1806.0 (491.2 – 3630.0) | 0 (0.00%) |
| sCD163 (ng/mL) | 470.1 (165.2 – 1766.0) | 0 (0.00%) |
| TNF-α (pg/mL) | 1.3 (0.1 – 565.2) | 0 (0.00%) |
| Pre-ART hs-CRP (ng/mL) | 1661.5 (30.6 - >10000.0) | 19 (19.19%) |
| Pre-ART IL-6 (pg/mL) | 2.0 (0.3 – 13.1) | 19 (19.19%) |
| Pre-ART IP-10 (pg/mL) | NA | 99 (100.00%) |
| Pre-ART Neopterin (nMol/L) | NA | 99 (100.00%) |
| Pre-ART sCD14 (ng/mL) | 1726.7 (78.2 – 10763.7) | 19 (19.19%) |
| Pre-ART sCD163 (ng/mL) | 912.1 (241.8 – 2078.5) | 19 (19.19%) |
| Pre-ART TNF-α (pg/mL) | NA | 99 (100.00%) |
| Immune activation biomarkers | ||
| %CD38+HLA-DR+ on CD4+ cells | 3.9% (0.6% - 14.4%) | 19 (19.19%) |
| %CD38+HLA-DR+ on CD8+ cells | 9.1% (1.0% - 29.3%) | 19 (19.19%) |
| %Ki67+ on CD4+ cells | 0.6% (0.2% - 4.1%) | 19 (19.19%) |
| %Ki67+ on CD8+ cells | 0.5% (0.1% - 4.8%) | 19 (19.19%) |
| Pre-ART %CD38+HLA-DR+ on CD4+ cells | 15.6% (3.1% - 66.1%) | 23 (23.23%) |
| Pre-ART %CD38+HLA-DR+ on CD8+ cells | 45.7% (8.5% - 83.3%) | 23 (23.23%) |
| Pre-ART %Ki67+ on CD4+ cells | 2.2% (0.5% - 10.7%) | 23 (23.23%) |
| Pre-ART %Ki67+ on CD8+ cells | 2.4% (0.2% - 35.5%) | 23 (23.23%) |
| Virologic parameters | ||
| CA-DNA (copies/106 CD4+ T-cells) | 534.8 (5.2 – 9207.5) | 3 (3.03%) |
| CA-RNA (copies/106 CD4+ T-cells) | 24.2 (<13.6 – 898.9) | 4 (4.04%) |
| Plasma HIV RNA via iSCA (copies/mL) | <0.7 (<0.7 – 24.9) | 1 (1.01%) |
| Immunologic parameters | ||
| CD4+ T-cell count (cells/mm3) | 681 (149 – 1413) | 0 (0.00%) |
| CD8+ T-cell count (cells/mm3) | 699 (268 – 2064) | 0 (0.00%) |
| CD4+/CD8+ T-cell ratio | 0.97 (0.18 – 2.50) | 0 (0.00%) |
| Pre-ART CD4+ T-cell count (cells/mm3) | 288 (0 – 734) | 0 (0.00%) |
| Pre-ART CD8+ T-cell count (cells/mm3) | 739 (196 – 2566) | 0 (0.00%) |
| Pre-ART CD4+/CD8+ T-cell ratio | 0.31 (0.00 – 1.28) | 0 (0.00%) |
| Env antibody signal:cutoff ratio | 9.48 (0.23 – 76.40) | 19 (19.19%) |
Abbreviations: ART, antiretroviral therapy; ARV, antiretroviral; INSTI, integrase strand transfer inhibitor; NNRTI, non-nucleoside reverse transcriptase inhibitor; PI, protease inhibitor; IFN-γ, interferon-gamma; SFU, spot forming units; PBMCs, peripheral blood mononuclear cells; HIV, human immunodeficiency virus; CMV, cytomegalovirus; hs-CRP, high-sensitivity C-reactive protein; IL-6, interleukin 6; IP-10, interferon-gamma-induced protein 10; sCD14, soluble CD14; sCD163, soluble CD163; TNF-α, tumor necrosis factor alpha; HLA-DR, human leukocyte antigen - DR isotype; CA-DNA, cell-associated human immunodeficiency virus DNA; CA-RNA, cell-associated human immunodeficiency virus RNA; iSCA, integrase single copy assay.
Magnitudes of HIV-specific T-cell responses are not cross-sectionally associated with levels of inflammation or immune activation
To determine whether IFN-γ-producing HIV-specific T-cell responses could be contributing to levels of inflammation and immune activation on-ART, we examined associations between magnitudes of these responses (measured at A5321 study entry) with levels of plasma inflammatory biomarkers (also measured at A5321 study entry), including hs-CRP, IL-6, IP-10, neopterin, sCD14, sCD163, and TNF-α, as well as with levels of immune activation, including %CD38+HLA-DR+ CD4+ cells, %CD38+HLA-DR+ CD8+ cells, %Ki67+ CD4+ cells, and %Ki67+ CD8+ cells. A major strength of this longitudinal cohort study is the measurement of pre-therapy levels of inflammatory and immune activation biomarkers, allowing us to adjust for pre-ART biomarker level in the above associations. By adjusting for the pre-ART biomarker level, we were able to determine if on-ART HIV-specific T-cell responses influence inflammation and immune activation regardless of a participant’s baseline level of the respective biomarker prior to ART initiation.
For on-ART inflammatory biomarkers, TNF-α levels were negatively associated with magnitudes of responses to HIV-Pol (r = −0.21, p = 0.040), however this association was weak and did not remain significant after controlling for joint confounding by pre-ART plasma viral load, CD4+ T-cell count, and CD4+/CD8+ T-cell ratio, years on ART at A5321 entry, and age at A5321 entry - suggesting that host/viral interactions prior to ART initiation led to the observed on-ART association. TNF-α levels were not associated with magnitudes of T-cell responses to any other HIV gene product or to CMV-pp65 (Table 2). No other inflammatory biomarker was associated with magnitudes of HIV-specific, or CMV-pp65-specific, T-cell responses, even after adjusting for pre-ART biomarker level (Table 2), nor were any of the measured immune activation biomarkers (Table 2). These results indicate that HIV-specific T-cell responses, as assessed by ex vivo IFN-γ production, do not appreciably contribute to on-ART inflammation and immune activation.
Table 2.
Spearman correlations between magnitudes of IFN-γ T-cell responses with inflammatory and immune activation biomarkers at A5321 study entry
| T-cell response correlation | |||||||
|---|---|---|---|---|---|---|---|
| Biomarker | HIV-Gag | HIV-Env | HIV-Pol | HIV-Nef/Tat/Rev | Sum HIV | CMV-pp65 | |
| Inflammatory biomarkers | |||||||
| hs-CRP (ng/mL) | r | 0.06 | −0.18 | −0.05 | −0.13 | −0.01 | −0.02 |
| p-value | 0.556 | 0.083 | 0.643 | 0.213 | 0.928 | 0.874 | |
| n | 99 | 99 | 99 | 99 | 99 | 90 | |
| AdjustedA r | −0.01 | −0.22 | −0.14 | −0.08 | −0.07 | −0.08 | |
| AdjustedA p-value | 0.961 | 0.051 | 0.230 | 0.472 | 0.518 | 0.528 | |
| AdjustedB r | 0.06 | −0.12 | −0.03 | −0.13 | <0.01 | - | |
| AdjustedB p-value | 0.580 | 0.246 | 0.759 | 0.223 | 0.991 | - | |
| IL-6 (pg/mL) | r | 0.08 | −0.06 | 0.02 | 0.02 | 0.08 | 0.08 |
| p-value | 0.433 | 0.556 | 0.820 | 0.818 | 0.444 | 0.445 | |
| n | 99 | 99 | 99 | 99 | 99 | 90 | |
| AdjustedA r | −0.01 | −0.09 | −0.09 | 0.03 | −0.03 | −0.03 | |
| AdjustedA p-value | 0.951 | 0.413 | 0.451 | 0.770 | 0.785 | 0.794 | |
| AdjustedB r | 0.07 | 0.01 | 0.01 | 0.03 | 0.08 | - | |
| AdjustedB p-value | 0.473 | 0.952 | 0.901 | 0.775 | 0.426 | - | |
| IP-10 (pg/mL) | r | −0.05 | 0.03 | −0.04 | 0.02 | 0.01 | 0.10 |
| p-value | 0.645 | 0.777 | 0.704 | 0.839 | 0.934 | 0.357 | |
| n | 99 | 99 | 99 | 99 | 99 | 90 | |
| AdjustedA r | NA | NA | NA | NA | NA | NA | |
| AdjustedA p-value | NA | NA | NA | NA | NA | NA | |
| AdjustedB r | −0.06 | −0.04 | −0.07 | −0.04 | −0.05 | - | |
| AdjustedB p-value | 0.555 | 0.699 | 0.483 | 0.730 | 0.653 | - | |
| Neopterin (nMol/L) | r | 0.01 | 0.12 | −0.05 | 0.16 | 0.04 | 0.17 |
| p-value | 0.909 | 0.240 | 0.601 | 0.120 | 0.667 | 0.105 | |
| n | 99 | 99 | 99 | 99 | 99 | 90 | |
| AdjustedA r | NA | NA | NA | NA | NA | NA | |
| AdjustedA p-value | NA | NA | NA | NA | NA | NA | |
| AdjustedB r | −0.06 | 0.06 | −0.12 | 0.08 | −0.06 | - | |
| AdjustedB p-value | 0.552 | 0.593 | 0.237 | 0.416 | 0.562 | - | |
| sCD14 (ng/mL) | r | 0.04 | −0.13 | −0.11 | −0.07 | −0.06 | −0.14 |
| p-value | 0.699 | 0.190 | 0.266 | 0.490 | 0.586 | 0.175 | |
| n | 99 | 99 | 99 | 99 | 99 | 90 | |
| AdjustedA r | 0.06 | −0.20 | −0.12 | −0.02 | −0.01 | −0.14 | |
| AdjustedA p-value | 0.595 | 0.071 | 0.310 | 0.885 | 0.898 | 0.233 | |
| AdjustedB r | 0.07 | −0.07 | −0.09 | −0.05 | −0.03 | - | |
| AdjustedB p-value | 0.496 | 0.474 | 0.394 | 0.656 | 0.764 | - | |
| sCD163 (ng/mL) | r | 0.11 | −0.03 | 0.08 | −0.03 | 0.06 | 0.16 |
| p-value | 0.259 | 0.769 | 0.407 | 0.755 | 0.564 | 0.141 | |
| n | 99 | 99 | 99 | 99 | 99 | 90 | |
| AdjustedA r | 0.16 | −0.05 | 0.16 | 0.07 | 0.12 | 0.12 | |
| AdjustedA p-value | 0.146 | 0.648 | 0.155 | 0.513 | 0.307 | 0.306 | |
| AdjustedB r | 0.08 | −0.02 | 0.04 | −0.09 | <−0.01 | - | |
| AdjustedB p-value | 0.452 | 0.811 | 0.720 | 0.377 | 0.972 | - | |
| TNF-α (pg/mL) | r | −0.07 | −0.09 | −0.21 | −0.05 | −0.18 | −0.05 |
| p-value | 0.477 | 0.399 | 0.040 | 0.637 | 0.081 | 0.667 | |
| n | 99 | 99 | 99 | 99 | 99 | 90 | |
| AdjustedA r | NA | NA | NA | NA | NA | NA | |
| AdjustedA p-value | NA | NA | NA | NA | NA | NA | |
| AdjustedB r | −0.01 | −0.05 | −0.15 | 0.02 | −0.11 | - | |
| AdjustedB p-value | 0.932 | 0.611 | 0.152 | 0.819 | 0.283 | - | |
| Immune activation biomarkers | |||||||
| %CD38+HLA-DR+ on CD4+ cells | r | −0.03 | −0.01 | −0.06 | 0.07 | 0.02 | <0.01 |
| p-value | 0.819 | 0.921 | 0.603 | 0.556 | 0.872 | 0.989 | |
| n | 80 | 80 | 80 | 80 | 80 | 71 | |
| AdjustedA r | 0.01 | <0.01 | −0.05 | 0.05 | 0.03 | −0.04 | |
| AdjustedA p-value | 0.903 | 0.992 | 0.692 | 0.698 | 0.816 | 0.718 | |
| AdjustedB r | −0.05 | −0.05 | −0.12 | −0.03 | −0.07 | - | |
| AdjustedB p-value | 0.692 | 0.684 | 0.306 | 0.815 | 0.555 | - | |
| %CD38+HLA-DR+ on CD8+ cells | r | 0.07 | 0.02 | 0.05 | 0.12 | 0.12 | 0.14 |
| p-value | 0.535 | 0.875 | 0.687 | 0.302 | 0.290 | 0.241 | |
| n | 80 | 80 | 80 | 80 | 80 | 71 | |
| AdjustedA r | 0.08 | 0.02 | 0.04 | 0.09 | 0.10 | 0.11 | |
| AdjustedA p-value | 0.507 | 0.897 | 0.711 | 0.465 | 0.370 | 0.368 | |
| AdjustedB r | 0.06 | −0.03 | 0.03 | 0.08 | 0.10 | - | |
| AdjustedB p-value | 0.584 | 0.820 | 0.784 | 0.482 | 0.406 | - | |
| %Ki67+ on CD4+ cells | r | 0.01 | −0.05 | −0.04 | −0.04 | 0.01 | −0.07 |
| p-value | 0.963 | 0.647 | 0.726 | 0.716 | 0.950 | 0.549 | |
| n | 80 | 80 | 80 | 80 | 80 | 71 | |
| AdjustedA r | <−0.01 | −0.06 | −0.09 | −0.09 | −0.03 | −0.06 | |
| AdjustedA p-value | 0.967 | 0.593 | 0.467 | 0.465 | 0.830 | 0.622 | |
| AdjustedB r | 0.03 | −0.03 | −0.07 | −0.11 | −0.03 | - | |
| AdjustedB p-value | 0.811 | 0.786 | 0.575 | 0.329 | 0.811 | - | |
| %Ki67+ on CD8+ cells | r | −0.04 | −0.17 | −0.04 | −0.14 | −0.04 | −0.11 |
| p-value | 0.749 | 0.129 | 0.736 | 0.212 | 0.735 | 0.361 | |
| n | 80 | 80 | 80 | 80 | 80 | 71 | |
| AdjustedA r | −0.02 | −0.16 | −0.02 | −0.11 | −0.01 | −0.09 | |
| AdjustedA p-value | 0.872 | 0.163 | 0.835 | 0.356 | 0.960 | 0.460 | |
| AdjustedB r | 0.01 | −0.14 | <0.01 | −0.16 | −0.01 | - | |
| AdjustedB p-value | 0.936 | 0.223 | 0.981 | 0.173 | 0.923 | - | |
Controlling for pre-ART biomarker level where available.
Controlling for pre-ART plasma HIV-1 RNA (log10cps/mL), pre-ART CD4+ T-cell count (cells/mm3), pre-ART CD4+/CD8+ T-cell ratio, years on ART at A5321 entry, and age at A5321 entry.
Significant associations at the alpha=0.05 level are bolded.
Abbreviations: IFN-γ, interferon-gamma; SFU, spot forming units; PBMCs, peripheral blood mononuclear cells; HIV, human immunodeficiency virus; CMV, cytomegalovirus; hs-CRP, high-sensitivity C-reactive protein; IL-6, interleukin 6; IP-10, interferon-gamma-induced protein 10; sCD14, soluble CD14; sCD163, soluble CD163; TNF-α, tumor necrosis factor alpha; HLA-DR, human leukocyte antigen - DR isotype; NA, not available; ART, antiretroviral therapy.
HIV antibody levels are not associated with levels of inflammation or immune activation
We next asked if HIV antibody levels, another component of the ongoing adaptive immune response to HIV in treated infection [19], were associated with levels of inflammatory or immune activation biomarkers at A5321 study entry. No inflammatory biomarker was found to be associated with HIV antibody levels, nor were any immune activation biomarkers, even when adjusting for pre-ART biomarker level (Table 3), comprising a lack of evidence for HIV antibodies contributing to on-ART inflammation and immune activation under long-term viral suppression.
Table 3.
Spearman correlations between HIV-Env-specific antibody levels with inflammatory and immune activation biomarkers at A5321 study entry
| HIV-Env antibody signal:cutoff ratio correlation | |||||||
|---|---|---|---|---|---|---|---|
| Biomarker | r | p-Value | n | AdjustedA r | AdjustedA p-Value | AdjustedB r | AdjustedB p-Value |
| Inflammatory biomarkers | |||||||
| hs-CRP (ng/mL) | −0.02 | 0.891 | 80 | −0.03 | 0.779 | 0.02 | 0.859 |
| IL-6 (pg/mL) | −0.19 | 0.085 | 80 | −0.16 | 0.161 | −0.20 | 0.079 |
| IP-10 (pg/mL) | −0.04 | 0.695 | 80 | NA | NA | −0.05 | 0.686 |
| Neopterin (nMol/L) | 0.02 | 0.843 | 80 | NA | NA | 0.01 | 0.899 |
| sCD14 (ng/mL) | 0.06 | 0.572 | 80 | 0.05 | 0.660 | 0.08 | 0.481 |
| sCD163 (ng/mL) | 0.13 | 0.262 | 80 | 0.05 | 0.651 | 0.09 | 0.468 |
| TNF-α (pg/mL) | −0.07 | 0.546 | 80 | NA | NA | −0.03 | 0.766 |
| Immune activation biomarkers | |||||||
| %CD38+HLA-DR+ on CD4+ cells | 0.05 | 0.641 | 80 | <0.01 | 0.976 | 0.04 | 0.751 |
| %CD38+HLA-DR+ on CD8+ cells | 0.03 | 0.795 | 80 | −0.01 | 0.953 | 0.02 | 0.892 |
| %Ki67+ on CD4+ cells | 0.07 | 0.541 | 80 | 0.01 | 0.964 | 0.08 | 0.483 |
| %Ki67+ on CD8+ cells | 0.01 | 0.958 | 80 | 0.01 | 0.944 | 0.04 | 0.714 |
Controlling for pre-ART biomarker level where available.
Controlling for pre-ART plasma HIV-1 RNA (log10cps/mL), pre-ART CD4+ T-cell count (cells/mm3), pre-ART CD4+/CD8+ T-cell ratio, years on ART at A5321 entry, and age at A5321 entry.
Abbreviations: HIV, human immunodeficiency virus; hs-CRP, high-sensitivity C-reactive protein; IL-6, interleukin 6; IP-10, interferon-gamma-induced protein 10; sCD14, soluble CD14; sCD163, soluble CD163; TNF-α, tumor necrosis factor alpha; HLA-DR, human leukocyte antigen - DR isotype; NA, not available; ART, antiretroviral therapy.
HIV-specific immune responses do not mediate an association between reservoir parameters and levels of inflammation or immune activation
A previous study reported a lack of correlations between measures of HIV persistence, including CA-DNA, CA-RNA, and plasma HIV RNA by iSCA, with levels of inflammatory and immune activation biomarkers at year 4 on therapy in the A5321 cohort [17]. We extended these results to analyses at the last longitudinal time point currently available on the cohort, a median of 7 (range 4 to 15) years on ART. CA-DNA levels were not associated with any inflammatory or immune activation biomarker, including when associations were adjusted for pre-ART biomarker level (Table S2). Likewise, CA-RNA levels were not associated with any inflammatory or immune activation biomarker (Table S3), nor was the CA-RNA:CA-DNA ratio (a surrogate of active replication) (Table S4). Interestingly, plasma HIV RNA levels by iSCA were weakly correlated with CD8+ T-cell activation as measured by %CD38+HLA-DR+ CD8+ cells (r = 0.25, p = 0.027), which remained significant after controlling for potential confounding by pre-ART plasma viral load, CD4+ T-cell count, and CD4+/CD8+ T-cell ratio, years on ART at A5321 entry, and age at A5321 entry (adjusted r = 0.24, p = 0.037) (Figure S2 and Table S5). This association also remained significant, and similar in magnitude, when adjusting for pre-ART %CD38+HLA-DR+ CD8+ cells (adjusted r = 0.26, p = 0.024) (Table S5), suggesting that on-ART low-level viremia – undetectable by commercial assays but detectable by single-copy assay – is biologically associated with increased CD8+ T-cell activation, regardless of a participant’s baseline level of CD8+ T-cell activation prior to ART initiation.
We next sought to determine if the association between plasma HIV RNA by iSCA with CD8+ T-cell activation was mediated by ongoing HIV-specific immune responses. In order to test this, we performed statistical mediation analysis using structural equation modeling. In mediation analysis, the objective is to determine if a third variable, Z, represents the causal mechanism (at least in part) through which the independent variable, X, influences the dependent variable, Y – indicated by a significant indirect effect of X through Z on Y [31,33]. SEM is a multivariate regression-like technique which allows for assessing the fit of mediation models – an important indicator of the consistency of the hypothesized mediation model with the actual data – and for comparison of different mediation models using goodness-of-fit statistics [31,32]. SEM also allows for analysis of mediation models with multiple independent variables, mediators, or outcomes. We used two goodness-of-fit criteria to evaluate models: the RMSEA, with a value ≤0.06 supporting the hypothesized model [34], and the NFI, with a value ≥0.95 supporting the hypothesized model [34]; additionally, we used the Bayesian information criterion (BIC) to compare and select models, with a ΔBIC >10 taken to indicate a meaningful difference between models (a lower BIC is better) [35]. We generated models with plasma HIV RNA via iSCA as the independent variable (X), all measured immune activation biomarkers as the outcome variables (Y1-Y4), and either magnitudes of HIV-specific T-cell responses (against each gene product, separately, as well as summed HIV responses) or HIV antibody levels as the mediating variable (M). We present here results of summed HIV T-cell responses and HIV antibody levels as the mediating variables based on BIC statistics. Both SEM models suggested an inconsistency of the hypothesized mediation models with the actual data, with an RMSEA of 0.50 for both SEM models, and NFI values of 0.10 (summed HIV responses) and 0.08 (HIV antibody levels) (Figure 1), meaning that the variables are likely not related in the ways we hypothesized. While there was a significant direct effect of plasma HIV RNA via iSCA on CD8+ T-cell activation (but not on any other immune activation biomarker, consistent with the correlation results), there was no significant indirect effect through the mediating variable for either summed HIV T-cell responses or HIV antibody levels (Figure 1 and Table 4). Taken together, these results indicate that on-ART HIV-specific adaptive immune responses do not mediate or influence the relationship between plasma HIV RNA via iSCA with CD8+ T-cell activation.
Figure 1.
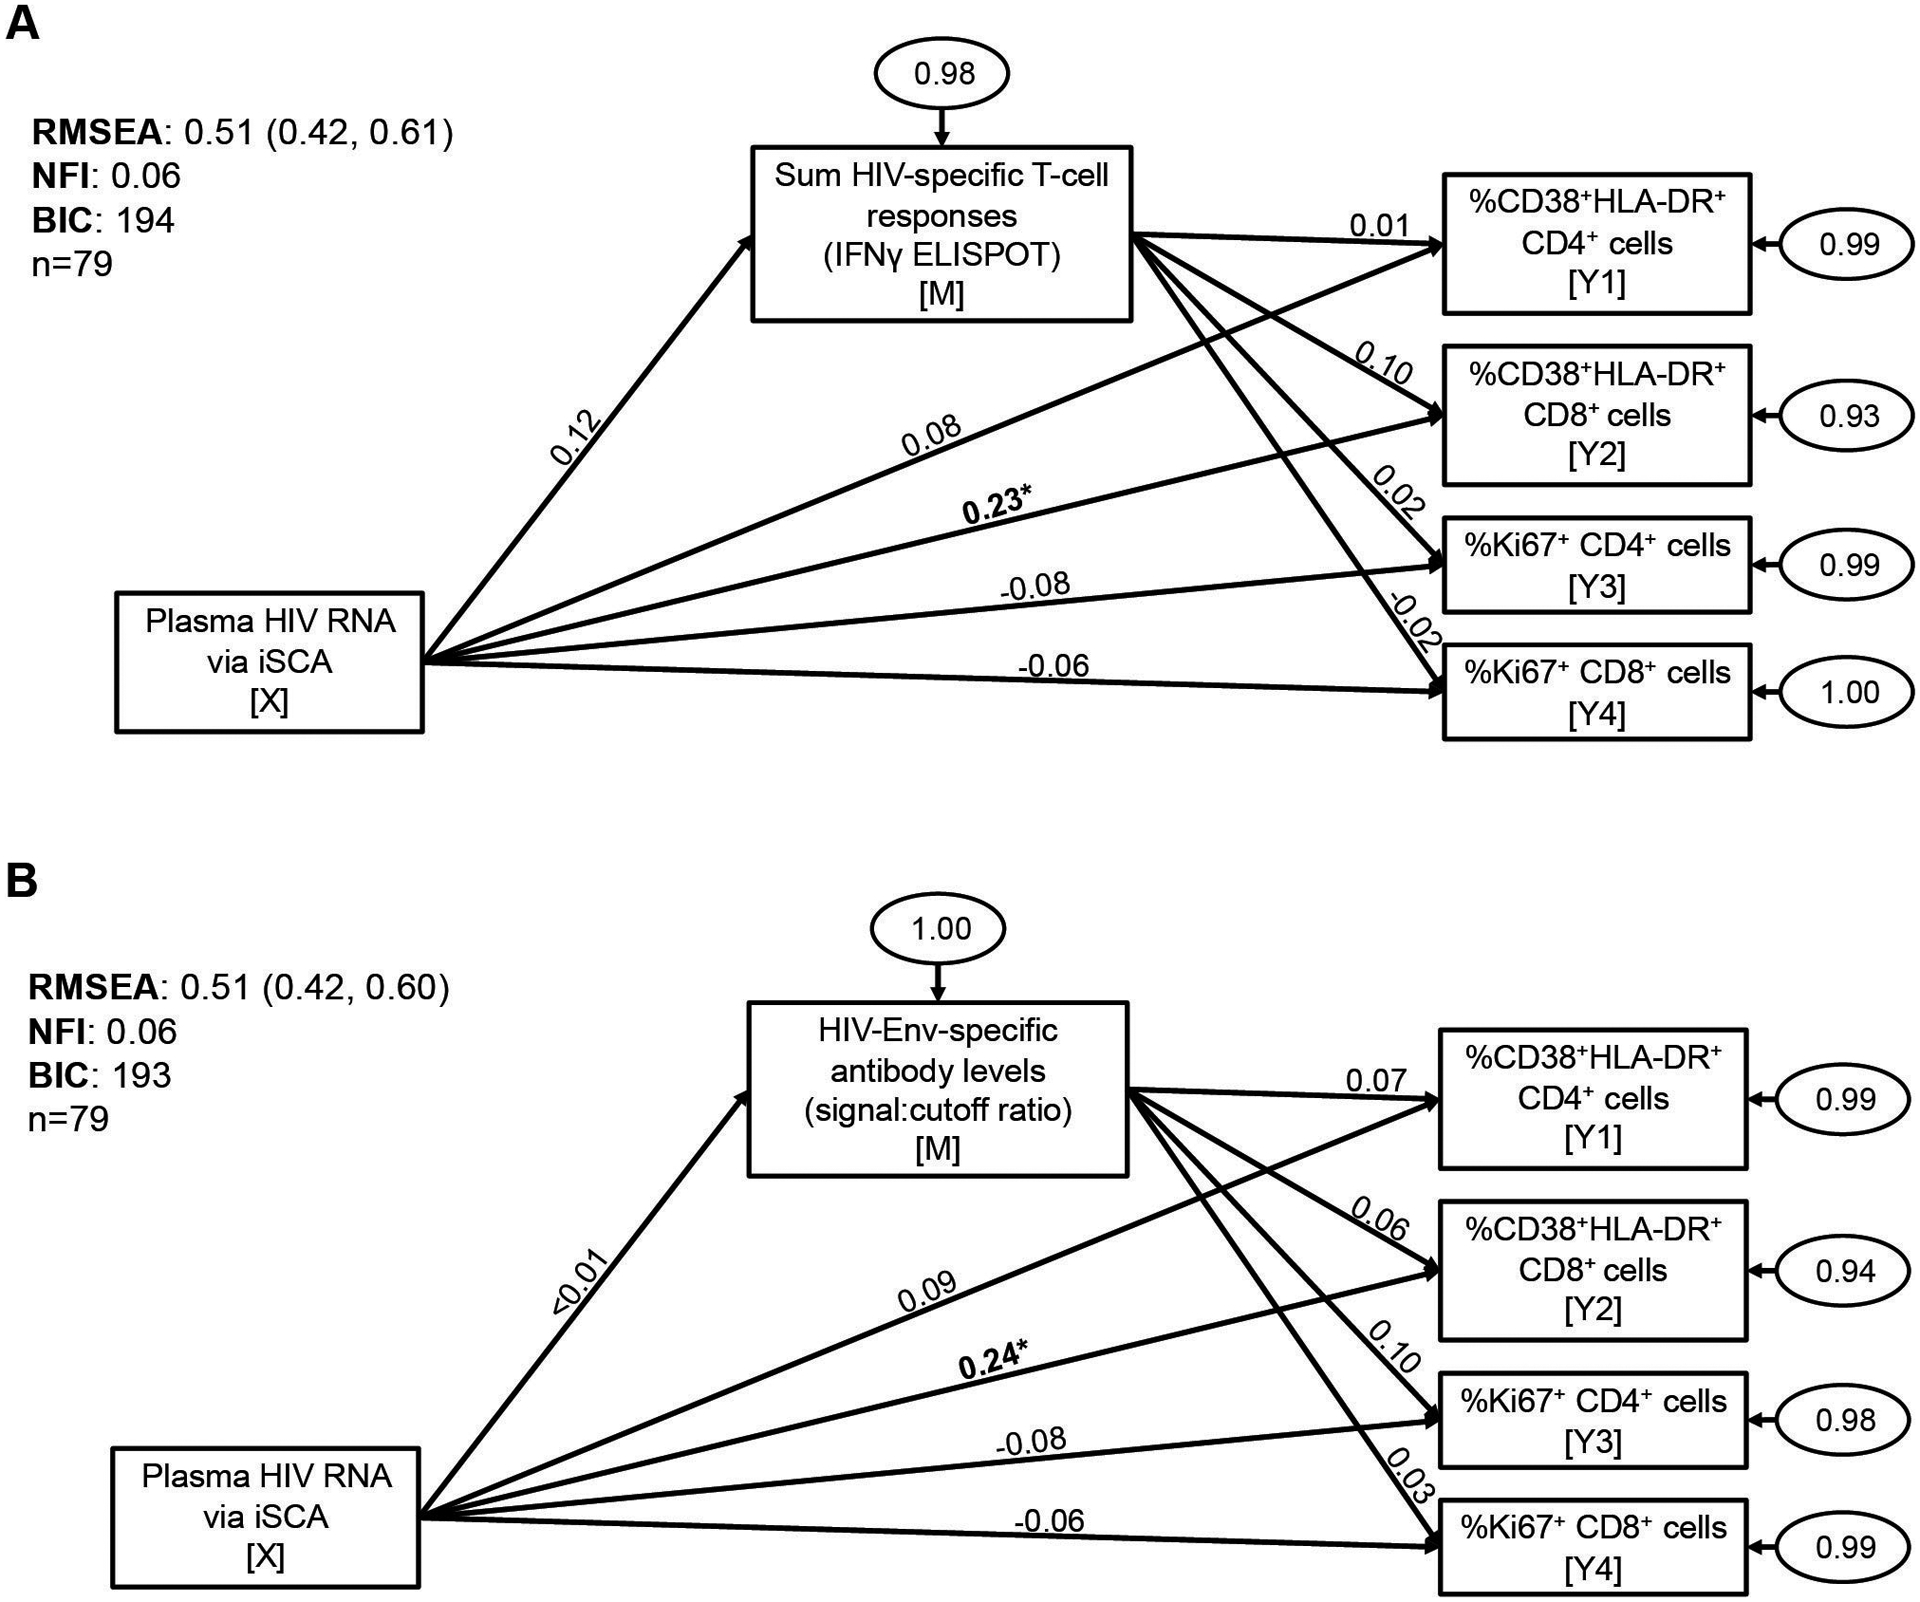
HIV-specific T-cell responses and HIV antibody levels do not mediate the association between plasma HIV RNA levels by iSCA with CD8+ T-cell activation. Structural equation modeling was used to test for mediation between plasma HIV RNA via iSCA with markers of T-cell activation (%CD38+HLA-DR+ CD4+ and CD8+ cells) and T-cell cycling (%Ki67+ CD4+ and CD8+ cells), mediated by either summed HIV-specific T-cell responses (measured by IFN-γ ELISPOT assay) (A) or HIV-Env-specific antibody levels (measured by LS-VITROS signal:cutoff ratio) (B). Path model diagrams are depicted, with path coefficients representing standardized effect estimates using rank-transformed data; statistically significant path coefficients are bolded. Circled numbers represent unexplained (error) variances. X indicates the independent variable, M the mediating variable, and Y the outcome variable. Values for goodness-of-fit statistics including RMSEA (with 95% confidence interval), NFI, and BIC are shown. iSCA, integrase single-copy assay; ELISPOT, enzyme-linked immune absorbent spot; RMSEA, root mean square error of approximation; NFI, Bentler-Bonnet Normed Fit Index; BIC, Bayesian information criterion. * p<0.05, ** p<0.01, *** p<0.001.
Table 4.
Results of mediation analyses for associations between integrase single copy assay (iSCA) with CD8+ T-cell activation and other immune activation biomarkers (n=79)
| Independent Variable | Mediating Variable | Outcome Variable | Total Effect | Total Effect p-Value | Direct Effect | Direct Effect p-Value | Indirect Effect | Indirect Effect p-Value |
|---|---|---|---|---|---|---|---|---|
| Sum HIV-specific T-cell responses | ||||||||
| iSCA | Sum HIV IFN-γ ELISPOT | %CD38+HLA-DR+ CD4+ cells | 0.086 | 0.446 | 0.085 | 0.454 | 0.001 | 0.953 |
| iSCA | Sum HIV IFN-γ ELISPOT | %CD38+HLA-DR+ CD8+ cells | 0.244 | 0.022 | 0.231 | 0.031 | 0.013 | 0.476 |
| iSCA | Sum HIV IFN-γ ELISPOT | %Ki67+ CD4+ cells | −0.083 | 0.462 | −0.085 | 0.454 | 0.002 | 0.882 |
| iSCA | Sum HIV IFN-γ ELISPOT | %Ki67+ CD8+ cells | −0.064 | 0.571 | −0.061 | 0.590 | −0.003 | 0.857 |
| HIV-Env-specific antibody levels | ||||||||
| iSCA | HIV-Env signal:cutoff ratio | %CD38+HLA-DR+ CD4+ cells | 0.086 | 0.446 | 0.085 | 0.446 | <0.001 | 0.969 |
| iSCA | HIV-Env signal:cutoff ratio | %CD38+HLA-DR+ CD8+ cells | 0.244 | 0.022 | 0.243 | 0.022 | <0.001 | 0.969 |
| iSCA | HIV-Env signal:cutoff ratio | %Ki67+ CD4+ cells | −0.083 | 0.462 | −0.083 | 0.458 | <0.001 | 0.969 |
| iSCA | HIV-Env signal:cutoff ratio | %Ki67+ CD8+ cells | −0.064 | 0.571 | −0.064 | 0.570 | <0.001 | 0.970 |
All variables rank-transformed.
Presenting standardized effect estimates.
Significant effects at the alpha=0.05 level are bolded.
Abbreviations: iSCA, integrase single copy assay; HIV, human immunodeficiency virus; IFN-γ, interferon-gamma; HLA-DR, human leukocyte antigen - DR isotype.
Next, we tested whether on-ART HIV-specific immune responses mediate an association between HIV reservoir size (by CA-DNA) with levels of inflammation and immune activation. Although CA-DNA levels were not associated with any biomarker in correlation analyses, it is possible for mediating variables to be causally between X and Y, even if X and Y are not directly associated – and X can affect Y indirectly in the absence of a detectable total effect [36]. For example, if the recognition of an HIV-infected cell by an HIV-specific T-cell resulted in the production of IFN-γ, which drove production of IFN-γ-induced protein 10, then the association between infected cells (CA-DNA) and IP-10 would be mediated by HIV-specific T-cells. Such a relationship between CA-DNA and IP-10 might only be revealed if HIV-specific T-cells are considered. We present here results of HIV-Nef/Tat/Rev-specific T-cell responses and HIV antibody levels as the mediating variables based on BIC statistics. When levels of inflammation were considered as outcome variables, both SEM models suggested an inconsistency of the hypothesized mediation models with the actual data, with an RMSEA of 0.17 for both SEM models, and NFI values of 0.15 (Nef/Tat/Rev T-cell responses) and 0.19 (HIV antibody levels) (Figure S3). There was a significant effect of CA-DNA levels on both Nef/Tat/Rev responses and HIV antibody levels (Figure S3), consistent with the correlations reported in our prior publications [18,19]. There were no significant indirect effects of CA-DNA on inflammatory biomarkers through either Nef/Tat/Rev responses or HIV antibody levels as the mediators (Figure S3 and Table S6). Similarly, there were no significant indirect effects of CA-DNA on immune activation biomarkers through either of the mediators tested (Figure S4 and Table S7). Taken together, these results indicate that the on-ART HIV-specific immune responses measured here do not mediate or influence an association between reservoir size with levels of inflammation and immune activation.
Discussion
This is the first study to our knowledge assessing the relationships between HIV-specific immune responses with clinically relevant inflammation and immune activation indices – including plasma IL-6 (associated with risk for non-AIDS-defining cancers, cardiovascular disease, renal disease, frailty, and all-cause mortality [37–43]), hsCRP (associated with risk for cardiovascular disease, incident diabetes, and mortality [37,39,44,45]), IP-10 (associated with a metric of multimorbidity and mortality [46]), sCD14 (associated with risk for chronic obstructive pulmonary disease, neurocognitive impairment, frailty, and mortality [43,47–50]), sCD163 (associated with risk for neurocognitive impairment [51]), and TNF-α (associated with risk for renal disease and frailty [41,43]) – in a cohort of chronic progressors on long-term ART. Our findings indicate that neither peripheral blood HIV-specific T-cell responses, assessed by ex vivo IFN-γ production, nor HIV antibody levels influence on-ART levels of inflammation and immune activation. Additionally, we report here that magnitudes of IFN-γ-producing CMV-pp65-specific T-cell responses are not associated with inflammation and immune activation in PWH on long-term ART, consistent with another report assessing CMV-specific T-cell responses by intracellular cytokine staining in n=56 PWH [52]. These latter results add to the literature on CMV, as elevated circulating CD8+ T-cell numbers and markers of inflammation and coagulation have been linked to CMV coinfection in PWH [13], but mechanisms are not fully understood. The findings presented here suggest this is not driven by CMV-specific T-cell responses – at least to the pp65 antigen as measured by IFN-γ ELISPOT in the peripheral blood. The modest association between on-ART plasma HIV levels by iSCA with CD8+ T-cell activation differs from the lack of association that we reported previously at an earlier on-ART time point [12,43]. It is possible that this association could become increasingly prevalent with longer durations of ART, during which very low-level viremia and/or viral blips (undetectable by commercial assays) may become increasingly influential drivers of CD8+ T-cell activation. It will, however, be important to confirm this observation in future studies on cohorts with similar or longer durations of ART. While our study examined adaptive immune responses to HIV, it is important to also note that persistent HIV can drive innate immune activation directly, i.e. through toll-like receptor signaling of products of reverse transcription [53], as can products of ongoing microbial translocation [11].
Major strengths of our study include that participants had many years of sustained viral suppression prior to entry into the cohort, allowing us to assess the relationships between immune responses with inflammation and immune activation without the potential confounding of appreciable residual viremia or virologic failure. Additionally, longitudinal measures of inflammation and immune activation provided for stronger inference by allowing us to adjust for pre-ART values to address the confounding that can occur in cross-sectional studies. The mediation modeling approach also provides a strong inference framework, as it does not rely on a significant total effect between the independent variable and outcome variable to detect meaningful relationships between multiple variables (which may be missed in regression or correlation analyses that only examine total effects). Limitations to our study include that we only assessed magnitudes of IFN-γ production but not other qualities of T-cell responses (such as cytotoxicity or production of other cytokines and chemokines), which could be important factors related to inflammation and immune activation. Similarly, we assessed HIV Env antibody levels but not other functional qualities of antibodies, and we did not assess antibodies against other HIV proteins. Immune responses and virologic parameters were only measured in peripheral blood, which may not fully reflect antigen-specific responses in tissues. Indeed, it is notable that residual plasma virus levels (iSCA) were associated with CD8+ T-cell activation – where plasma virions may come from both circulating and tissue sources [54] – but measures of circulating HIV reservoirs were not, and further study is needed to understand the role of tissue reservoirs and immune responses in tissues. Additionally, we did not assess immune responses pre-ART, and thus were not able to evaluate the contribution of pre-ART HIV-specific responses to pre-ART and on-ART inflammation and immune activation. Differing measures of the HIV reservoir, such as viral outgrowth or intact vs. defective HIV DNA levels, may yield additional insights into relationships with both anti-HIV immune responses and inflammation. Finally, several inflammatory markers measured in this study are mainly produced by activated myeloid cells, but we did not directly evaluate myeloid cell activation. Since our rationale here is based on these cells acting as intermediaries, it may be valuable for future studies to assess myeloid cell activation, which would also enable additional mediation analyses.
Delineating the root drivers of persistent inflammation and immune activation despite suppressive ART is critical towards the goal of reducing associated non-AIDS-defining morbidities and increased mortality [5]. Although there are multiple potential mechanisms by which HIV-specific adaptive immune responses could have contributed to elevation of the clinically-relevant biomarkers we examined, our study did not uncover any evidence for this. These results should be interpreted in relation to both the strengths and limitations outlined above, and we emphasize that studies of tissues and/or other functional characteristics of T-cells may yet reveal a role for residual antigen expression and adaptive immune recognition in on-ART inflammation. This being said, the lack of associations observed here adds further support to the “die is cast” or “legacy effect” theory proposed by members of the ACTG A5321 study team and others [17,55], which suggests that pathogenic mechanisms that occur before therapy is initiated are the predominate drivers of long-lasting immune dysregulation (i.e. an “immune dysregulation legacy effect”). This theory was initially proposed in response to the observation of strong correlations between pre- and on-ART inflammation, alongside a lack of associations between virologic measures of persistence and inflammatory markers on-ART – and this model holds up to the inclusion of the adaptive immune responses studied here. Mechanisms consistent with this theory – such as intestinal damage and increased microbial translocation, coinfections, and lymphoid tissue fibrosis – represent important areas for ongoing research into interventional targets to improve the health of PWH.
Supplementary Material
Acknowledgements
The authors would like to thank all members of the ACTG A5321 Team. We also thank Samuel Simmens (George Washington University), Jeanne Jordan (George Washington University), and Manya Magnus (George Washington University) for helpful discussions. We gratefully acknowledge the contributions of the study participants, without whom this work would not be possible.
This work was supported by the National Institutes of Health [1UM1AI164565]; the National Institute of Allergy and Infectious Diseases of the National Institutes of Health [UM1 AI068634, UM1 AI068636, UM1 AI106701, and R01s AI147845 & AI131798 to R.B.J.]; by an AIDS Clinical Trials Group (ACTG) special projects grant [to R.B.J.], and by a grant from the ACTG to the University of Pittsburgh Virology Specialty Laboratory. R.T.G is also supported by grant funding from the Harvard University Center for AIDS Research (National Institutes of Health P30 AI060354). The content is solely the responsibility of the authors and does not necessarily represent the official views of the National Institutes of Health.
Potential conflicts of interest
J.W.M. is a consultant to Gilead Sciences and Merck, and owns share options in Co-Crystal Pharmaceuticals and Abound Bio, Inc., which are not involved in the current work. J.J.E. has research funding outside of the current work from ViiV Healthcare, Gilead Sciences, and Janssen, and has consulting income from ViiV Healthcare, Gilead Sciences, Janssen, and Merck. B.J.M. has received research funding from Gilead Sciences. R.T.G. has served on a scientific advisory board for Merck (2 years ago). All other authors declare they have no potential conflicts of interest.
References
- 1.Neuhaus J, Jacobs DR Jr, Baker J v., Calmy A, Duprez D, la Rosa A, et al. Markers of Inflammation, Coagulation, and Renal Function Are Elevated in Adults with HIV Infection. The Journal of Infectious Diseases 2010; 201:1788–1795. [DOI] [PMC free article] [PubMed] [Google Scholar]
- 2.de Paula HHS, Ferreira ACG, Caetano DG, Delatorre E, Teixeira SLM, Coelho LE, et al. Reduction of inflammation and T cell activation after 6 months of cART initiation during acute, but not in early chronic HIV-1 infection. Retrovirology 2018; 15:76. [DOI] [PMC free article] [PubMed] [Google Scholar]
- 3.Hunt PW, Martin JN, Sinclair E, Bredt B, Hagos E, Lampiris H, et al. T Cell Activation Is Associated with Lower CD4 + T Cell Gains in Human Immunodeficiency Virus–Infected Patients with Sustained Viral Suppression during Antiretroviral Therapy. The Journal of Infectious Diseases 2003; 187:1534–1543. [DOI] [PubMed] [Google Scholar]
- 4.Spudich S, Robertson KR, Bosch RJ, Gandhi RT, Cyktor JC, Mar H, et al. Persistent HIV-infected cells in cerebrospinal fluid are associated with poorer neurocognitive performance. Journal of Clinical Investigation 2019; 129:3339–3346. [DOI] [PMC free article] [PubMed] [Google Scholar]
- 5.Hunt PW, Lee SA, Siedner MJ. Immunologic Biomarkers, Morbidity, and Mortality in Treated HIV Infection. The Journal of Infectious Diseases 2016; 214:S44–S50. [DOI] [PMC free article] [PubMed] [Google Scholar]
- 6.Legarth RA, Ahlström MG, Kronborg G, Larsen CS, Pedersen C, Pedersen G, et al. Long-Term Mortality in HIV-Infected Individuals 50 Years or Older. JAIDS Journal of Acquired Immune Deficiency Syndromes 2016; 71:213–218. [DOI] [PubMed] [Google Scholar]
- 7.Wada NI, Bream JH, Martínez-Maza O, Macatangay B, Galvin SR, Margolick JB, et al. Inflammatory Biomarkers and Mortality Risk Among HIV-Suppressed Men: A Multisite Prospective Cohort Study. Clinical Infectious Diseases 2016; 63:984–990. [DOI] [PMC free article] [PubMed] [Google Scholar]
- 8.Samji H, Cescon A, Hogg RS, Modur SP, Althoff KN, Buchacz K, et al. Closing the Gap: Increases in Life Expectancy among Treated HIV-Positive Individuals in the United States and Canada. PLOS ONE 2013; 8:e81355. [DOI] [PMC free article] [PubMed] [Google Scholar]
- 9.Brenchley JM, Price DA, Schacker TW, Asher TE, Silvestri G, Rao S, et al. Microbial translocation is a cause of systemic immune activation in chronic HIV infection. Nature Medicine 2006; 12:1365–1371. [DOI] [PubMed] [Google Scholar]
- 10.Marchetti G, Tincati C, Silvestri G. Microbial translocation in the pathogenesis of HIV infection and AIDS. Clinical Microbiology Reviews 2013; 26:2–18. [DOI] [PMC free article] [PubMed] [Google Scholar]
- 11.Zevin AS, McKinnon L, Burgener A, Klatt NR. Microbial translocation and microbiome dysbiosis in HIV-associated immune activation. Current Opinion in HIV and AIDS 2016; 11:182–190. [DOI] [PMC free article] [PubMed] [Google Scholar]
- 12.Boulougoura A, Sereti I. HIV infection and immune activation. Current Opinion in HIV and AIDS 2016; 11:191–200. [DOI] [PMC free article] [PubMed] [Google Scholar]
- 13.Freeman ML, Mudd JC, Shive CL, Younes SA, Panigrahi S, Sieg SF, et al. CD8 T-cell expansion and inflammation linked to CMV coinfection in ART-treated HIV infection. Clinical Infectious Diseases 2016; 62:392–396. [DOI] [PMC free article] [PubMed] [Google Scholar]
- 14.Zeng M, Smith AJ, Wietgrefe SW, Southern PJ, Schacker TW, Reilly CS, et al. Cumulative mechanisms of lymphoid tissue fibrosis and T cell depletion in HIV-1 and SIV infections. Journal of Clinical Investigation 2011; 121:998–1008. [DOI] [PMC free article] [PubMed] [Google Scholar]
- 15.Martinez-Picado J, Deeks SG. Persistent HIV-1 replication during antiretroviral therapy. Current Opinion in HIV and AIDS 2016; 11:417–423. [DOI] [PMC free article] [PubMed] [Google Scholar]
- 16.Wu G, Zuck P, Goh SL, Milush JM, Vohra P, Wong JK, et al. Gag p24 Is a Marker of Human Immunodeficiency Virus Expression in Tissues and Correlates with Immune Response. The Journal of Infectious Diseases 2021; 224:1593–1598. [DOI] [PMC free article] [PubMed] [Google Scholar]
- 17.Gandhi RT, McMahon DK, Bosch RJ, Lalama CM, Cyktor JC, Macatangay BJ, et al. Levels of HIV-1 persistence on antiretroviral therapy are not associated with markers of inflammation or activation. PLOS Pathogens 2017; 13:e1006285. [DOI] [PMC free article] [PubMed] [Google Scholar]
- 18.Thomas AS, Jones KL, Gandhi RT, McMahon DK, Cyktor JC, Chan D, et al. T-cell responses targeting HIV Nef uniquely correlate with infected cell frequencies after long-term antiretroviral therapy. PLOS Pathogens 2017; 13:e1006629. [DOI] [PMC free article] [PubMed] [Google Scholar]
- 19.Keating SM, Jones RB, Lalama CM, Bosch RJ, McMahon D, Hampton D, et al. HIV Antibodies Decline During Antiretroviral Therapy but Remain Correlated With HIV DNA and HIV-Specific T-Cell Responses. JAIDS Journal of Acquired Immune Deficiency Syndromes 2019; 81:594–599. [DOI] [PMC free article] [PubMed] [Google Scholar]
- 20.Stevenson EM, Ward AR, Truong R, Thomas AS, Huang S-H, Dilling TR, et al. HIV-specific T cell responses reflect substantive in vivo interactions with antigen despite long-term therapy. JCI Insight 2021; 6:e142640. [DOI] [PMC free article] [PubMed] [Google Scholar]
- 21.Monney L, Sabatos CA, Gaglia JL, Ryu A, Waldner H, Chernova T, et al. Th1-specific cell surface protein Tim-3 regulates macrophage activation and severity of an autoimmune disease. Nature 2002; 415:536–541. [DOI] [PubMed] [Google Scholar]
- 22.Moro-García MA, Mayo JC, Sainz RM, Alonso-Arias R. Influence of inflammation in the process of T lymphocyte differentiation: Proliferative, metabolic, and oxidative changes. Frontiers in Immunology 2018; 9:339. [DOI] [PMC free article] [PubMed] [Google Scholar]
- 23.Lei J, Yin X, Shang H, Jiang Y. IP-10 is highly involved in HIV infection. Cytokine 2019; 115:97–103. [DOI] [PubMed] [Google Scholar]
- 24.Macatangay BJC, Szajnik ME, Whiteside TL, Riddler SA, Rinaldo CR. Regulatory T cell suppression of Gag-specific CD8 T cell polyfunctional response after therapeutic vaccination of HIV-1-infected patients on ART. PLOS ONE 2010; 5:e9852. [DOI] [PMC free article] [PubMed] [Google Scholar]
- 25.van Erp EA, Luytjes W, Ferwerda G, van Kasteren PB. Fc-mediated antibody effector functions during respiratory syncytial virus infection and disease. Frontiers in Immunology 2019; 10:548. [DOI] [PMC free article] [PubMed] [Google Scholar]
- 26.Hong F, Aga E, Cillo AR, Yates AL, Besson G, Fyne E, et al. Novel Assays for Measurement of Total Cell-Associated HIV-1 DNA and RNA. Journal of Clinical Microbiology 2016; 54:902–911. [DOI] [PMC free article] [PubMed] [Google Scholar]
- 27.Cillo AR, Vagratian D, Bedison MA, Anderson EM, Kearney MF, Fyne E, et al. Improved Single-Copy Assays for Quantification of Persistent HIV-1 Viremia in Patients on Suppressive Antiretroviral Therapy. Journal of Clinical Microbiology 2014; 52:3944–3951. [DOI] [PMC free article] [PubMed] [Google Scholar]
- 28.Keating SM, Pilcher CD, Jain V, Lebedeva M, Hampton D, Abdel-Mohsen M, et al. HIV Antibody Level as a Marker of HIV Persistence and Low-Level Viral Replication. The Journal of Infectious Diseases 2017; 216:72–81. [DOI] [PMC free article] [PubMed] [Google Scholar]
- 29.Keating SM, Hanson D, Lebedeva M, Laeyendecker O, Ali-Napo NL, Owen SM, et al. Lower-sensitivity and avidity modifications of the vitros anti-HIV 1+2 assay for detection of recent HIV infections and incidence estimation. Journal of Clinical Microbiology 2012; 50:3968–3976. [DOI] [PMC free article] [PubMed] [Google Scholar]
- 30.Conover WJ, Iman RL. Analysis of Covariance Using the Rank Transformation. Biometrics 1982; 38:715. [PubMed] [Google Scholar]
- 31.Danner D, Hagemann D, Fiedler K. Mediation analysis with structural equation models: Combining theory, design, and statistics. European Journal of Social Psychology 2015; 45:460–481. [Google Scholar]
- 32.Gunzler D, Chen T, Wu P, Zhang H. Introduction to mediation analysis with structural equation modeling. Shanghai Arch Psychiatry 2013; 25:390–394. [DOI] [PMC free article] [PubMed] [Google Scholar]
- 33.Baron RM, Kenny DA. The moderator–mediator variable distinction in social psychological research: Conceptual, strategic, and statistical considerations. Journal of Personality and Social Psychology 1986; 51:1173–1182. [DOI] [PubMed] [Google Scholar]
- 34.Hu LT, Bentler PM. Cutoff criteria for fit indexes in covariance structure analysis: Conventional criteria versus new alternatives. Structural Equation Modeling 1999; 6:1–55. [Google Scholar]
- 35.Raftery AE. Bayesian Model Selection in Social Research. Sociological Methodology 1995; 25:111–163. [Google Scholar]
- 36.Hayes AF. Beyond Baron and Kenny: Statistical mediation analysis in the new millennium. Communication Monographs 2009; 76:408–420. [Google Scholar]
- 37.Kuller LH, Tracy R, Belloso W, Wit S de, Drummond F, Lane HC, et al. Inflammatory and Coagulation Biomarkers and Mortality in Patients with HIV Infection. PLOS Medicine 2008; 5:e203. [DOI] [PMC free article] [PubMed] [Google Scholar]
- 38.Tenorio AR, Zheng Y, Bosch RJ, Krishnan S, Rodriguez B, Hunt PW, et al. Soluble Markers of Inflammation and Coagulation but Not T-Cell Activation Predict Non–AIDS-Defining Morbid Events During Suppressive Antiretroviral Treatment. The Journal of Infectious Diseases 2014; 210:1248–1259. [DOI] [PMC free article] [PubMed] [Google Scholar]
- 39.Duprez DA, Neuhaus J, Kuller LH, Tracy R, Belloso W, de Wit S, et al. Inflammation, Coagulation and Cardiovascular Disease in HIV-Infected Individuals. PLOS ONE 2012; 7:e44454. [DOI] [PMC free article] [PubMed] [Google Scholar]
- 40.Borges ÁH, Silverberg MJ, Wentworth D, Grulich AE, Fätkenheuer G, Mitsuyasu R, et al. Predicting risk of cancer during HIV infection. AIDS 2013; 27:1433–1441. [DOI] [PMC free article] [PubMed] [Google Scholar]
- 41.Gupta S, Kitch D, Tierney C, Melbourne K, Ha B, McComsey G. Markers of renal disease and function are associated with systemic inflammation in HIV infection. HIV Medicine 2015; 16:591–598. [DOI] [PMC free article] [PubMed] [Google Scholar]
- 42.Borges ÁH, O’Connor JL, Phillips AN, Neaton JD, Grund B, Neuhaus J, et al. Interleukin 6 Is a Stronger Predictor of Clinical Events Than High-Sensitivity C-Reactive Protein or D-Dimer During HIV Infection. The Journal of Infectious Diseases 2016; 214:408–416. [DOI] [PMC free article] [PubMed] [Google Scholar]
- 43.Margolick JB, Bream JH, Martínez-Maza O, Lopez J, Li X, Phair JP, et al. Frailty and Circulating Markers of Inflammation in HIV+ and HIV− Men in the Multicenter AIDS Cohort Study. JAIDS Journal of Acquired Immune Deficiency Syndromes 2017; 74:407–417. [DOI] [PMC free article] [PubMed] [Google Scholar]
- 44.de Luca A, de Gaetano Donati K, Colafigli M, Cozzi-Lepri A, de Curtis A, Gori A, et al. The association of high-sensitivity c-reactive protein and other biomarkers with cardiovascular disease in patients treated for HIV: a nested case–control study. BMC Infectious Diseases 2013; 13:414. [DOI] [PMC free article] [PubMed] [Google Scholar]
- 45.Brown TT, Tassiopoulos K, Bosch RJ, Shikuma C, McComsey GA. Association Between Systemic Inflammation and Incident Diabetes in HIV-Infected Patients After Initiation of Antiretroviral Therapy. Diabetes Care 2010; 33:2244–2249. [DOI] [PMC free article] [PubMed] [Google Scholar]
- 46.Premeaux TA, Javandel S, Hosaka KRJ, Greene M, Therrien N, Allen IE, et al. Associations Between Plasma Immunomodulatory and Inflammatory Mediators With VACS Index Scores Among Older HIV-Infected Adults on Antiretroviral Therapy. Frontiers in Immunology 2020; 11:1321. [DOI] [PMC free article] [PubMed] [Google Scholar]
- 47.Justice AC, Freiberg MS, Tracy R, Kuller L, Tate JP, Goetz MB, et al. Does an Index Composed of Clinical Data Reflect Effects of Inflammation, Coagulation, and Monocyte Activation on Mortality Among Those Aging With HIV? Clinical Infectious Diseases 2012; 54:984–994. [DOI] [PMC free article] [PubMed] [Google Scholar]
- 48.Sandler NG, Wand H, Roque A, Law M, Nason MC, Nixon DE, et al. Plasma Levels of Soluble CD14 Independently Predict Mortality in HIV Infection. The Journal of Infectious Diseases 2011; 203:780–790. [DOI] [PMC free article] [PubMed] [Google Scholar]
- 49.Hunt PW, Sinclair E, Rodriguez B, Shive C, Clagett B, Funderburg N, et al. Gut Epithelial Barrier Dysfunction and Innate Immune Activation Predict Mortality in Treated HIV Infection. The Journal of Infectious Diseases 2014; 210:1228–1238. [DOI] [PMC free article] [PubMed] [Google Scholar]
- 50.Attia EF, Akgün KM, Wongtrakool C, Goetz MB, Rodriguez-Barradas MC, Rimland D, et al. Increased Risk of Radiographic Emphysema in HIV Is Associated With Elevated Soluble CD14 and Nadir CD4. Chest 2014; 146:1543–1553. [DOI] [PMC free article] [PubMed] [Google Scholar]
- 51.Burdo TH, Weiffenbach A, Woods SP, Letendre S, Ellis RJ, Williams KC. Elevated sCD163 in plasma but not cerebrospinal fluid is a marker of neurocognitive impairment in HIV infection. AIDS 2013; 27:1387–1395. [DOI] [PMC free article] [PubMed] [Google Scholar]
- 52.Ballegaard V, Brændstrup P, Pedersen KK, Kirkby N, Stryhn A, Ryder LP, et al. Cytomegalovirus-specific T-cells are associated with immune senescence, but not with systemic inflammation, in people living with HIV. Scientific Reports 2018; 8:3778. [DOI] [PMC free article] [PubMed] [Google Scholar]
- 53.Sauter D, Kirchhoff F. HIV replication: A game of hide and sense. Current Opinion in HIV and AIDS 2016; 11:173–181. [DOI] [PubMed] [Google Scholar]
- 54.Jacobs JL, Halvas EK, Tosiano MA, Mellors JW. Persistent HIV-1 Viremia on Antiretroviral Therapy: Measurement and Mechanisms. Frontiers in Microbiology 2019; 10:2383. [DOI] [PMC free article] [PubMed] [Google Scholar]
- 55.Centlivre M, Sala M, Wain-Hobson S, Berkhout B. In HIV-1 pathogenesis the die is cast during primary infection. AIDS 2007; 21:1–11. [DOI] [PubMed] [Google Scholar]
Associated Data
This section collects any data citations, data availability statements, or supplementary materials included in this article.