

Abstract
The mechanisms underlying metabolic adaptation of pancreatic ductal adenocarcinoma (PDA) cells to pharmacological inhibition of RAS-MAPK signaling are largely unknown. Using transcriptome and chromatin immunoprecipitation profiling of PDA cells treated with the MEK inhibitor, Trametinib (MEKi), we identify transcriptional antagonism between c-MYC and the master transcription factors for lysosome gene expression, the MiT/TFE proteins. Under baseline conditions, c-MYC and MiT/TFE factors compete for binding to lysosome gene promoters to fine-tune gene expression. Treatment of PDA cells or patient organoids with MEKi leads to c-MYC downregulation and increased MiT/TFE-dependent lysosome biogenesis. Quantitative proteomics of immunopurified lysosomes uncovered reliance on ferritinophagy, the selective degradation of the iron storage complex ferritin, in MEKi treated cells. Ferritinophagy promotes mitochondrial iron-sulfur cluster protein synthesis and enhanced mitochondrial respiration. Accordingly, suppressing iron utilization sensitizes PDA cells to MEKi, highlighting a critical and targetable reliance on lysosome-dependent iron supply during adaptation to KRAS-MAPK inhibition.
Keywords: Lysosome, autophagy, iron, pancreatic ductal adenocarcinoma, KRAS, MAPK
Introduction
Bypass of oncogene addiction is a major hurdle to effectively treating and eliminating cancer cells (1, 2). Pancreatic ductal adenocarcinoma (PDA) is driven by KRAS mutation and hyperactivation of MAPK signaling, which promotes downstream changes in transcriptional and metabolic pathways that favor tumor progression and growth (3–5). Suppression of the KRAS-MAPK pathway can delay tumor growth in vitro and in vivo but has shown limited efficacy long term due to activation of compensatory feedback mechanisms that promote rapid emergence of drug resistance and tumor relapse (1, 6–8). One example of a resistance mechanism is the induction of autophagy - a process via which intracellular material is packaged within vesicles for transport to the lysosome for degradation. At baseline, PDA cells and tumors are highly dependent on autophagy to maintain metabolic homeostasis and remodel the cellular proteome (9, 10). Recent studies have also shown that in response to inactivation of KRAS, MEK or ERK, PDA cells further induce autophagy as an adaptive response that promotes drug resistance and survival (11–15), suggesting that context-dependent autophagy may confer unique advantages to PDA cells. How KRAS-MAPK inhibition, or its bypass leads to autophagic enhancement in drug-treated cells has not been established.
We previously showed that the high levels of autophagy and lysosome activity in PDA (hereafter referred to as ‘baseline’ activity) occurs via constitutive activation of the microphthalmia/transcription factor E (MiT/TFE) family of master transcription factors (TFs) – MITF, TFE3, TFEB (16). These basic helix-loop-helix (bHLH) transcription factors belong to the MYC superfamily, and recognize a palindromic 10-base pair motif (GTCACGTGAC) closely related to canonical E-Box elements (17). This motif, termed the coordinated lysosomal expression and regulation (CLEAR) element is present in the promoter region of numerous lysosomal genes including those that encode for hydrolases, lysosomal membrane permeases, and associated proteins and is necessary for MiT/TFE mediated activation of gene expression (18–20). Given the high level of homology of the DNA binding domain of MiT/TFE factors, all family members can recognize and bind to the CLEAR element. The MiT/TFE proteins also regulate several autophagy genes and therefore are considered master regulators of catabolism (21). In PDA, TFE3, TFEB and MITF show increased expression levels, escape negative regulation by the mTORC1 kinase and are constitutively localized in the nucleus leading to elevated baseline autophagy and lysosome biogenesis (16). Accordingly, suppression of MiT/TFE factors causes a pronounced decrease in expression of lysosome and autophagy-associated proteins, leading to defects in lysosome morphology and function and to significant inhibition of tumor growth (16).
Activation of the autophagy-lysosome system confers a growth advantage to PDA cells through degradation, recycling and refueling of key biosynthetic and bioenergetic pathways critical for PDA growth (10, 22). Autophagy sequesters all classes of cellular macromolecules either in bulk or via a selective process that employs specific autophagy receptors. Whether autophagy-lysosome activity confers unique metabolic advantages via specific sequestration of cargos in different contexts – for example, under baseline conditions versus in response to MAPK suppression – remains unknown. Moreover, the precise mechanism for activation of the pathway in response to KRAS-MAPK inhibition remains unclear.
Using transcriptomic profiling and chromatin immunoprecipitation studies, we uncovered a previously unrecognized antagonism between the transcription factors, c-MYC (hereafter referred to as MYC) and MiT/TFE proteins, in regulation of autophagy and lysosomal gene expression in PDA. Under baseline conditions, MYC is capable of binding to the CLEAR element, effectively restricting full activation of lysosomal genes by MiT/TFE factors. Upon KRAS-MAPK pathway inhibition, MYC levels are decreased enabling unrestricted access of MiT/TFE factors to CLEAR elements and a corresponding increase in autophagy and lysosomal gene expression and organelle biogenesis. Proteomic profiling of intact lysosomes captured from MEKi treated cells further identified ferritinophagy – the selective autophagy pathway for degradation of the iron storage protein, ferritin - as being enhanced in MEKi treated PDA cells. Increased ferritinophagy in turn was necessary for promoting an iron-dependent increase in mitochondrial iron-sulfur cluster (ISC) proteins required for respiration, thereby enabling PDA cell proliferation and survival. Accordingly, combining MEKi treatment with respiratory complex I inhibition, iron chelation or disruption of ferritinophagy via knockdown of the ferritinophagy receptor NCOA4, or lysosome inhibition leads to increased blockade of PDA growth, which can be rescued with iron supplementation. This signature of autophagy-lysosome mediated cellular adaptation is retained following prolonged KRAS pathway suppression and is a conserved hallmark in other KRAS driven cancers treated with MEKi. Finally, an anti-correlation between MiT/TFE- and MYC-dependent activity is common to KRAS driven PDA, colorectal and non-small cell lung cancer. Together, these findings highlight a critical interplay between master transcriptional regulators of metabolism which drive context-specific autophagy-lysosome-mitochondria crosstalk to enhance iron utilization and enable adaptation to therapy stress.
Results
MEK inhibition triggers MiT/TFE factor dependent upregulation of lysosome gene expression in PDA.
Treatment of human PDA cell lines with a MEK inhibitor (Trametinib) or ERK inhibitor (SCH772984) – herein referred to as MEKi, and ERKi respectively, increases autophagy as evidenced by increased LC3B puncta, LC3B-II abundance and autophagic flux in multiple human PDA cells lines (Fig. 1A–C; Supplementary Fig, S1A–E). In addition, RNA-seq analysis of MEKi treated PDA cells indicated an increase in genes associated with lysosomal biogenesis, relative to DMSO treated cells (Fig. 1D; Supplementary Fig. S1F). Gene set enrichment analysis (GSEA) identified ‘Lysosome’ as a significantly enriched pathway in MEKi treated cells compared to control cells (Fig. 1E,F; Supplementary Fig. S1G,H). Western blot analysis in MiaPaca2 cells confirmed increased expression of lysosomal proteins (Supplementary Fig. S1D). Consistent with these findings, expansion of the lysosome compartment was also observed via immunofluorescence staining for LAMP2 in MEKi treated cells across multiple PDA lines (Fig. 1G,H). ERKi treatment similarly led to an increase in lysosome gene expression, lysosome associated protein levels and lysosome biogenesis in multiple PDA cells (Supplementary Fig. S1E, I–K). To test whether suppression of oncogenic KRAS similarly induces an increase in lysosome gene expression, we treated MiaPaca2 cells with AMG 510, a clinically approved KRASG12C inhibitor, and identified an increase in several autophagy and lysosome genes and proteins in drug treated relative to control treated cells (Supplementary Fig. S2A,B). Analysis of a published proteomics dataset (23) similarly showed an enrichment of autophagy and lysosome related proteins in MiaPaca2 cells treated with the KRASG12C inhibitor, compound 4 (24) (Supplementary Fig. S2C; Table S1). These data suggest that upregulation of autophagy and lysosome gene and protein signatures are common hallmarks following suppression of different nodes of the KRAS-MAPK pathway.
Figure 1: TFEB dependent transcriptional upregulation of autophagy and lysosome genes following RAS pathway inhibition.

A. Immunofluorescence staining of LC3B in human PDA cell lines following DMSO (left) or MEKi treatment for 48h (right). Scale, 20μm.
B. Normalized log2 fold change in LC3B fluorescence intensity in the indicated cell lines treated in A measured from n = 10–14 fields per condition.
C. Measurement of autophagy flux via flow cytometry using GFP-LC3-RFP-LC3ΔG reporter in the indicated cell lines following 48h treatment with DMSO or MEKi.
D. Heatmap showing increased expression of lysosome genes in MEKi treated KP4 cells. Scale bar represents row z score calculated from log10 (FPKM).
E. Top upregulated pathways identified (Hallmark and KEGG) using gene set enrichment analysis in KP4 cells treated with MEKi. Normalized enrichment score (NES).
F. Gene set enrichment analysis of the autophagy-lysosome gene signature in MEKi treated KP4 cells
G. Immunofluorescence staining of LAMP2 in human PDA cell lines following DMSO (left) or MEKi treatment (right). Scale, 20μm.
H. Normalized log2 fold change of LAMP2 fluorescence intensity in the indicated cell lines treated in G measured from n = 10–14 fields per condition.
I. RT-qPCR showing increased expression of TFEB mRNA in KP4 cells treated with MEKi relative to DMSO.
J. Immunoblot for TFEB in the cytoplasmic and nuclear fractions of KP4 cells treated with DMSO or MEKi. Lamin A/C and GAPDH serve as loading controls for nuclear and cytoplasmic fractions respectively.
K. RT-qPCR showing the effect of siRNA mediated TFEB knockdown on the expression of lysosome genes in DMSO or MEKi treated KP4 cells, displayed as fold change normalized to cells transfected with control siRNA treated with DMSO.
L. RT-qPCR showing increased expression of TFEB and lysosomal genes following MEKi treatment (normalized to DMSO) from two independent patient PDA ex vivo organoid cultures.
Data are the mean ± s.d. and P values were determined using an unpaired two-tailed Student’s t-test (B, C, H, I, L) and two-way ANOVA (K). MEKi treatment was 100nM for 48h.
We previously showed that PDA cells maintain an elevated level of basal autophagy and lysosomal biogenesis via upregulation and constitutive nuclear localization of MiT/TFE factors (TFEB, TFE3, MITF), the master transcription factors which control autophagy and lysosomal gene expression (16). Therefore, we hypothesized that induction of autophagy and lysosomal gene expression upon MAPK pathway suppression may be due to further alterations in MiT/TFE factor levels or activity. Consistent with our hypothesis, we observed an increase in TFEB and/or TFE3 mRNA and protein level in PDA cells following inhibition of MAPK signaling as well as induction of MiT/TFE target genes within 24h of MEKi treatment (Fig. 1I; Supplementary Fig, S2D–G). Moreover, MiT/TFE factors were constitutive nuclear localization in MEKi (Fig. 1J; Supplementary Fig. S2H) and ERKi (Supplementary Fig. S2I,J) treated PDA cells. Similarly, treatment of MiaPaca2 cells with AMG 510 led to increased expression of TFEB and TFE3 (Supplementary Fig. S2A,B). To determine whether MiT/TFE factors are required for mediating the MEKi-induced increased autophagy-lysosome gene expression, we suppressed TFEB via siRNA knockdown in KP4 cells in the presence or absence of MEKi treatment. Knockdown of TFEB led to downregulation of lysosomal genes under control conditions and was sufficient to block MEKi induced upregulation of autophagy-lysosome gene and protein expression (Fig. 1K; Supplementary Fig. S2K). Finally, we tested if MEKi treatment leads to increased lysosomal biogenesis in PDA patient derived ex-vivo cultured organoids. qPCR analysis showed that mRNA levels of TFEB and TFE3 and several lysosomal genes were significantly upregulated in MEKi treated organoids compared to DMSO treated samples (Fig. 1L). Together, these results indicate that MiT/TFE factors are necessary for mediating upregulation of the autophagy-lysosome program following MAPK pathway suppression.
MYC is downregulated upon MAPK inhibition to enable increased autophagy-lysosome activation
Further analysis of our RNA-seq data indicated that in addition to upregulation of lysosome gene expression, a significant downregulation in MYC dependent transcriptional signatures occurred in response to MEKi or ERKi treatment (Fig. 2A–C; Supplementary Fig. S3A–D). MYC is commonly overexpressed and is a pro-tumorigenic driver of PDA (25–27). Moreover, MAPK signaling is known to regulate MYC mRNA (28) and protein levels (29–31). Accordingly, we noted an overall decrease in MYC mRNA (Fig. 2D; Supplementary Fig. S3E) and protein (Fig. 2E; Supplementary Fig. S3F) and the level of nuclear localized MYC (Fig. 2F,G; Supplementary Fig. S3G–I) in several PDA lines upon MEKi or ERKi treatment. Acute treatment of MiaPaca2 cells with AMG 510 similarly led to decreased expression of MYC (Supplementary Fig. S2B) and its target genes (Supplementary Fig. S3J). Analysis of published whole-cell proteomics data (23) also revealed a significant decrease in several MYC targets following Compound 4 treatment (48 proteins with FC<0.7, p value<0.05, Supplementary Fig. S2C; Table S1). Consistent with these findings, treatment of PDA patient derived ex-vivo organoid cultures with MEKi led to a decrease in MYC expression and its target genes relative to control treated samples (Fig. 2H).
Figure 2: Downregulation of MYC facilitates enhanced lysosome gene expression.

A. Heatmap showing decreased expression of MYC target genes in MEKi treated KP4 cells. Scale bar represents row z score calculated from log10 (FPKM).
B. Top downregulated pathways (Hallmark and KEGG) identified using gene set enrichment analysis in KP4 cells treated with MEKi.
C. Gene set enrichment analysis showing negative enrichment of MYC target genes in MEKi treated KP4 cells. Normalized enrichment score (NES).
D. RT-qPCR showing decreased expression of MYC mRNA in KP4 (left) and MiaPaca2 (right) cells treated with MEKi relative to DMSO.
E. Western blot analysis of MYC protein levels following MEKi treatment in the indicated cell lines.
F. Immunofluorescence staining (left) and quantification (right) of MYC in KP4 cells following DMSO (top) or MEKi treatment (bottom). Arrowheads indicate examples of nuclear localization. Fluorescence intensity was quantified from 10–14 fields/condition. Scale, 20μm.
G. Immunoblot for MYC in the cytoplasmic and nuclear fractions of KP4 cells treated with DMSO or MEKi. Lamin A/C and GAPDH serve as loading controls for nuclear and cytoplasmic fractions respectively.
H. RT-qPCR analysis showing decreased expression of MYC and its target genes following MEKi treatment (normalized to DMSO) from two independent patient PDA ex-vivo organoid cultures.
I. RT-qPCR showing the effect of siRNA mediated MYC knockdown on the expression of lysosome genes in DMSO or MEKi treated KP4 cells, displayed as fold change normalized to cells transfected with control siRNA treated with DMSO.
Data are the mean ± s.d. and P values were determined using an unpaired two-tailed Student’s t-test (D, F, H) and two-way ANOVA (I). MEKi treatment was 100nM for 48h.
MYC and MiT/TFE transcription factors belong to the MYC superfamily and preferentially bind to canonical E-box elements (CANNTG) or modified E-box elements (CLEAR motif; GTCACGTGAC) respectively (19, 20, 32). The overlap between the canonical E-box and the CLEAR element (underlined above) suggests that these transcription factors may also display overlapping promoter occupancy. Therefore, we hypothesized that downregulation of MYC following KRAS-MAPK pathway suppression may enable increased promoter occupancy by MiT/TFE factors in PDA cells. To test this hypothesis, we first analyzed the effect of acute knockdown of MYC in PDA cells in the presence or absence of MEKi treatment. Consistent with an antagonistic role for MYC in regulation of autophagy and lysosome gene expression (33), siRNA mediated knockdown of MYC under baseline conditions led to a significant increase in the expression of several autophagy-lysosomal genes including TFEB (Fig. 2I). Moreover, downregulating MYC in conjunction with MEKi treatment led to a further increase in TFEB and lysosome gene expression (Fig. 2I). These results suggest that MEKi treatment has opposite effects on MYC and MiT/TFE factor activity that ultimately favors increased induction of lysosome gene expression.
MiT/TFE and MYC transcription factors bind to CLEAR motifs in lysosome gene promoters in PDA.
To directly test whether downregulation of MYC increases lysosome gene expression by allowing increased occupancy of MiT/TFE proteins at their target gene promoters, we analyzed promoter occupancy via chromatin immunoprecipitation of endogenous MYC or TFE3 in control and MEKi treated KP4 cells followed by next generation sequencing. We detected MYC and TFE3 binding at 7465 and 4511 promoter regions respectively under baseline conditions, 2821 of which were common to both transcription factors (Fig. 3A). KEGG pathway analysis of bound genes common to both factors identified ‘Lysosome’ and ‘Regulation of autophagy’ as two significantly enriched pathways (Fig. 3B). Accordingly, MYC bound to the proximal promoter of several lysosomal genes (Fig. 3C,D), including the TFE3 and TFEB promoters (Supplementary Fig. S4A), in addition to its canonical targets (eg., HK2, FASN, LDHA) (Supplementary Fig. S4B) in PDA cells. Importantly, treatment of PDA cells with MEKi led to decreased MYC occupancy at several of its known target promoters and several lysosomal genes (Fig. 3D,E; Supplementary Fig. S4A–D). In parallel, we observed an increase in TFE3 occupancy at several lysosomal CLEAR elements following MEKi treatment (Fig. 3F,G; Supplementary Fig. S4E,F), which was validated by direct ChIP-qPCR (Fig. 3H). These data suggest that MYC occupancy at CLEAR elements serves to limit the magnitude of lysosomal gene expression by MiT/TFE factors in PDA cells.
Figure 3: MEKi treatment induces changes in transcription factor occupancy at lysosome gene promoters.

A. Venn diagram showing unique and overlapping genes bound by TFE3 and MYC under baseline conditions in KP4 cells.
B. KEGG pathway analysis of genes bound by TFE3 and MYC at baseline in KP4 cells. Note that ‘Regulation of autophagy’ and ‘Lysosome’ are two of the significantly enriched terms.
C. Venn diagram (top) and list of lysosome genes (bottom) bound by TFE3 and MYC under baseline conditions.
D. ChIP-seq tracks of MYC occupancy (top row: DMSO treated, bottom row: MEKi treated) at representative lysosome gene promoters.
E. Profile plot showing ChIP-Seq read densities of MYC peaks in control and MEKi conditions on lysosomal gene promoters.
F. ChIP-seq tracks of TFE3 occupancy (top row: DMSO treated, bottom row: MEKi treated) at representative lysosome gene promoters.
G. Profile plot showing ChIP-Seq read densities of TFE3 peaks in control and MEKi conditions on lysosomal gene promoters.
H. ChIP-qPCR showing increased TFE3 occupancy at the indicated lysosomal CLEAR promoters following MEKi treatment relative to DMSO treatment in KP4 cells. IgG serves as negative control for ChIP and Gene desert serves as negative control for TFE3 occupancy.
I. KEGG pathway analysis of genes that are TFE3 direct targets (as determined by ChIP-seq) and upregulated in RNA-Seq analysis. Note that ‘Regulation of autophagy’ and ‘Lysosome’ are significantly enriched terms.
J. Volcano plot showing the differential mRNA expression levels following MEKi treatment, of genes that are also direct targets of TFE3 (as determined by ChIP-seq). Data are plotted as log2 fold change (MEKi/DMSO) of gene expression in KP4 cells quantified using RNA-Seq versus −log10 of the P-value. Representative genes associated with the autophagy-lysosome pathway are indicated in red (see Table S3).
K. Volcano plot of whole cell proteomics data from DMSO and MEKi treated KP4 cells. Data are plotted as log2 fold change (MEKi/DMSO) versus −log10 of the P-value. Proteins considered to be “MYC targets” and “MiT/TFE targets” are indicated in blue and red respectively (see Table S4).
TSS; transcription start site. Data (H) are the mean ± s.d. and P values were determined using two-way ANOVA. MEKi treatment was 100nM for 48h.
Under MEKi treatment conditions, analysis of TFE3 promoter binding coupled to our RNA-seq analysis of upregulated genes identified 1174 genes as direct targets of TFE3 (Table S2). KEGG pathway analysis of these 1174 TFE3 direct targets that were upregulated in MEKi treated cells identified ‘Lysosome’ and ‘Regulation of autophagy’ as two of the top significantly enriched terms (Fig. 3I). Of these targets, 38 core genes belonged to the lysosomal geneset (16) and were significantly upregulated following MEKi treatment (Fig. 3J, Table S3). To confirm that reciprocal expression changes in MYC and MiT/TFE targets result in changes at the protein level, we additionally conducted quantitative whole cell proteomics from DMSO and MEKi treated cells. In line with increased MiT/TFE promoter occupancy and lysosomal gene expression, several lysosomal proteins were significantly upregulated (48 proteins with fold change >1.2; P value <0.05) following MEKi treatment, while several MYC targets (57 proteins with fold change <0.7, P value <0.05) were downregulated upon MEKi treatment compared to control, (Fig. 3K; Table S4). Together, our ChIP-seq, transcriptome, and proteome analysis establish that MYC, through binding to MiT/TFE target promoters, limits the expression of autophagy and lysosome genes. Following MEKi treatment, reduction of MYC levels facilitates unimpeded binding of TFE3 to target promoters vacated by MYC leading to increased lysosomal gene expression.
Ferritin is an enriched lysosomal cargo in cells treated with MEKi.
To understand how induced autophagy and increased lysosome biogenesis promotes adaptation to KRAS-MAPK pathway suppression, we isolated intact lysosomes (Lyso-IP) from DMSO and MEKi treated cells and performed mass spectrometry-based proteomics to identify enriched lysosomal cargo proteins. KP4 cells stably expressing the TMEM192-mRFP-3xHA tag (referred to as LysoTag) were treated with DMSO or MEKi for 48h prior to affinity based capture on HA-conjugated beads as previously described (34). Eluted protein was quantified, and identical concentrations were analyzed by mass spectrometry-based proteomics (Fig. 4A). This analysis identified approximately 616 proteins that were enriched (> 1.2-fold) in MEKi treated samples, of which 97 were statistically significant (Fig. 4B; Table S5). Consistent with increased autophagy flux, several autophagy-related proteins (LC3B and GABARAPL2) and autophagy receptors (p62/SQSTM1) were enriched in lysosomes isolated from MEKi treated cells relative to DMSO treatment, while LAMP1 and NPC1 served as protein normalization controls, and were equally detected in each sample both by proteomics and immunoblotting (Fig. 4C, D).
Figure 4: Ferritinophagy is induced in response to MEKi treatment.

A. Schematic showing lysosome purification using affinity-based capture from KP4 cells stably expressing T192-mRFP-3xHA and treated with DMSO or MEKi.
B. Volcano plot of lysosome proteomics data from KP4 cells expressing T192-mRFP-3xHA treated with DMSO or MEKi. Data are plotted as log2 fold change (MEKi/DMSO) versus −log10 of the p-value (see Table S5). Ferritin light chain (FTL) and Ferritin heavy chain (FTH1) are indicated in red.
C. Average peptide counts for the indicated proteins from n=3 biological replicates per condition.
D. Immunoblot for the indicated proteins in input and lysosomal fractions isolated from KP4 cells expressing T192-mRFP-3xHA and treated with DMSO or MEKi. Note the enrichment of FTH, FTL, NCOA4, and LC3B in the MEKi lysosome fraction. NPC1 and LAMP1 serve as loading controls while the absence of AIF, RCAS1 and PDI confirms organelle purity. FTH, FTL, NCOA4, and LC3B are also increased in the input indicating increased overall expression in MEKi-treated cells.
E. Immuno-fluorescence staining of LAMP2 (red) and FTL (green) in KP4 cells following DMSO or MEKi treatment in the presence or absence of acute BafA1 treatment (500nM for 4h) to suppress lysosome degradation. Arrowheads in insets show increased colocalization of FTL and LAMP2 in cells co-treated with MEKi+BafA1. Scale, 20μm.
F. Quantification of percentage colocalization between FTL and LAMP2 in cells in E. n=10–15 fields per condition.
G. Live cell imaging of KP4 cells incubated with FerroOrange iron dye and treated with the indicated agents.
H. Quantification of fluorescence intensity of images in G from n = 7–10 fields per condition.
I. Immunoblot for total FTH1, FTL and NCOA4 in KP4 cells treated with the indicated concentrations of MEKi for 48h.
J. Immunoblot for total FTH1 and FTL in KP4 cells treated with 1μM ERKi for 48h.
K. Schematic (left) and immunoblot for the indicated proteins (right) of KP4 xenografts isolated from nude mice treated daily for 11 days with vehicle or MEKi (Trametinib 2mg/kg).
L. Immunoblot for total Transferrin receptor (TfR1) and Ferroportin (FPN) in KP4 cells treated with DMSO or MEKi.
M. Flow cytometry-based measurement of cell surface Transferrin receptor in KP4 cells treated with DMSO or MEKi.
N. Uptake of fluorescently labeled Transferrin in KP4 cells treated with DMSO or MEKi.
Data are the mean ± s.d. and P values were determined using an unpaired two-tailed Student’s t-test (F, M, N) and one-way ANOVA (H). MEKi treatment was 100nM for 48h unless otherwise indicated.
Of note, ferritin heavy chain (FTH1) and ferritin light chain (FTL) were significantly enriched in lysosomes isolated from MEKi treated cells (Fig. 4B–D). FTH1 and FTL are subunits of ferritin - the primary cellular iron storage complex (35). Ferritin is degraded by autophagy-dependent capture via the adaptor NCOA4, a process referred to as ferritinophagy (36, 37). Lysosomal degradation of ferritin and conversion of ferric iron (Fe3+) to bioactive ferrous iron (Fe2+) via an endo-lysosomal iron reductase generates a critical source of cellular bioavailable iron – a key micronutrient essential for respiration, energy metabolism and DNA synthesis (38–40). Direct Lyso-IP followed by immunoblotting confirmed significant enrichment of FTH1 and FTL in lysosome fractions of MEKi treated cells (Fig. 4D). In addition to FTH1 and FTL, an increase in the level of NCOA4 was also detected in MEKi treated lysosomes (Fig. 4D). Moreover, immunofluorescence-based measurement of the percentage lysosome localization of FTL in the presence or absence of acute lysosome inhibition with the V-ATPase inhibitor, Bafilomycin A1 (BafA1) confirmed a higher rate of ferritinophagy flux in MEKi treated cells (Fig. 4E,F). These results were recapitulated via Lyso-IP from cells treated with MEKi or MEKi combined with BafA1 (Supplementary Fig. S5A), suggesting that an increase in ferritinophagy occurs in response to MEKi treatment. In contrast, no change in mitophagy, as evidenced by lack of mitochondrial proteins in lysosome fractions, was observed in MEKi treated cells (Supplementary Fig. S5A).
Lysosomal degradation of ferritin leads to liberation of Fe3+ which is subsequently converted to Fe2+ and transported out of lysosomes via endo-lysosomal transporters (41, 42). Importantly, lysosome function is required for maintenance of cellular iron homeostasis (43, 44) and PDA is known to be “ferro-addicted” (45, 46). Consistent with increased ferritinophagy, MEKi treatment led to higher levels of intracellular labile iron relative to DMSO treated PDA cells as measured by live cell imaging and flow cytometry of the fluorescent iron reporters, FeRhoNox-1 and FerroOrange (Fig. 4G,H; Supplementary Fig. S5B–D). Importantly, co-treatment with MEKi and BafA1 for 6h blocked the MEKi induced increase in intracellular iron (Fig. 4G,H; Supplementary Fig. S5D). Addition of exogenous iron (ferrous ammonium sulfate (FAS)) led to an increase in iron levels, while treatment with the iron chelator, deferoxamine (DFO) led to a decrease in iron levels, thus serving as positive and negative controls, respectively (Fig. 4G,H). These results suggest that increased lysosome biogenesis and ferritinophagy are part of an adaptive response to MEKi treatment to regulate intracellular iron homeostasis.
Of note, we found that MEKi or ERKi treatment led to a significant increase in FTH1, FTL mRNA and protein levels in several PDA cell lines (Fig. 4I,J; Supplementary Fig. S5E–G), and treatment of MiaPaca2 cells with AMG 510 similarly led to an increase in FTH1 and FTL protein levels (Supplementary Fig. S5H). Moreover, MEKi treatment of tumor bearing mice caused a decrease in ERK1/2 signaling and MYC protein levels which coincided with an increase in the lysosome protein NPC1, and FTH1 and FTL (Fig. 4K). Regulation of FTH1 and FTL expression are coordinated with iron levels within the cell, whereby an iron replete state induces increased translation of FTH1 and FTL (46). Moreover, MYC is a reported negative regulator of FTH1 (47) and we show that siRNA mediated knockdown of MYC leads to a significant increase in FTH1 and FTL transcript levels in PDA cells consistent with a suppressive role for MYC (Supplementary Fig. S5I). An iron replete state is also associated with decreased uptake of iron-bound transferrin (Tf) by transferrin receptor (TfR1) (38). Importantly, we found that the total mRNA and protein levels of TfR1 were decreased in MEKi treated cells (Fig. 4L; Supplementary Fig. S5J,K), as well as the levels of plasma membrane TfR1 and Tf uptake (Fig 4M,N; Supplementary Fig. S5L). We also found that expression of the iron-exporter ferroportin (FPN) was decreased 48h post MEKi treatment (Fig. 4L). These results suggest that MEKi treatment induces an iron replete state that is mediated by increased ferritinophagy, while decreased FPN ensure reduced flux at the plasma membrane. Taken together, our findings suggest a feed-forward circuit in which increased ferritin synthesis and degradation serves to maintain an iron replete state in KRAS-MAPK pathway suppressed PDA cells. In parallel, downregulation of MYC contributes to transcriptional induction of FTH1 and FTL.
Ferritinophagy-mediated iron supply promotes increased levels of mitochondrial iron-sulfur cluster proteins in MEKi treated cells.
Redox-active iron within the cytosolic labile iron pool (LIP) is utilized for synthesis of heme and ISC (39, 48). ISC are essential cofactors for several proteins within complex I, II and III of the mitochondrial electron transport chain (ETC), while additional proteins within complex II, III and IV contain heme (48). Analysis of our whole cell proteomics data from KP4 cells treated for 48h with MEKi indicated an increase in several ISC containing proteins, particularly those involved in mitochondrial ETC complexes (Fig. 5A, Table S6). Direct immunoblotting in MEKi treated PDA cells further confirmed increased abundance of Aconitase 2 (ACO2) and respiratory chain complex proteins including NDUFS1, NDUFS2, NDUFS3, NDUFS5, NDUFS7 and UQCRFS1 (Fig. 5B; Supplementary Fig. S6A). Of note, the mRNA levels corresponding to mitochondrial ISC proteins and the levels of outer mitochondrial membrane proteins, VDAC and TOM20 were largely unchanged (Supplementary Fig. S6B,C), indicating that increased transcription or mitochondrial number does not contribute to upregulation of mitochondrial ISC proteins following MEKi treatment. Similarly, treatment of MiaPaca2 cells with AGM 510 also led to upregulation of several ISC proteins (Supplementary Fig. S6D). Consistent with our findings, analysis of a published proteomics dataset generated from MiaPaca2 cells treated with Compound 4 (23) similarly showed a significant increase in FTH1, FTL, NCOA4 and ISC proteins involved in mitochondrial respiration (Supplementary Fig. S6E; Table S7). Unlike mitochondrial ISC proteins, those associated with DNA repair and transcription were not increased in response to MEKi treatment (Supplementary Fig. S6F) or oncogenic KRAS inhibition (Supplementary Fig. S6G), suggesting that selective increase of ISC proteins associated with mitochondrial respiration is a conserved response to KRAS-MAPK pathway inhibition.
Figure 5: Mitochondrial iron-sulfur cluster protein levels, complex activity and respiration is increased in response to MEK inhibition.

A. Volcano plot (shown also in figure 3K) of whole cell proteomics data from DMSO and MEKi treated KP4 cells. Data are plotted as log2 fold change (MEKi/DMSO) versus −log10 of the P-value. Iron-sulfur cluster (ISC) proteins specific to mitochondria (red), cytosol (orange) or nucleus (blue) are indicated.
B. Immunoblot for mitochondrial ISC proteins in KP4 cells following treatment with the indicated concentrations of MEKi.
C. Blue native PAGE analysis of purified mitochondrial fractions from KP4 cells treated with DMSO or MEKi showing the presence of ISC proteins in higher molecular weight structures. EZ blue staining on the left serves as the loading control.
D. In-gel activity assay for Complex I activity in purified mitochondria from KP4 cells treated with DMSO or MEKi. Darker purple stain indicates complex activity. Quantification of activity from n=3 biological replicates normalized to control is shown at right.
E. Activity of the ISC protein Aconitase 2 in KP4 cells treated with DMSO or MEKi normalized to total protein.
F. Oxygen consumption rate of individual mitochondrial respiratory complex (complexes I-III and II-III) measured in the presence or absence of MEKi treatment in KP4 cells.
G. Oxygen consumption rate of mitochondrial respiratory complex using seahorse in KP4 cells treated with DMSO or MEKi.
H. Basal and maximal oxygen consumption rate in KP4 cells treated with DMSO or MEKi.
Data are the mean ± s.d. and P values were determined using an unpaired two-tailed Student’s t-test. MEKi treatment was 100nM for 48h.
Mitochondrial activity is increased in MEKi treated cells.
To determine whether increased mitochondrial ISC protein abundance translates to increased mitochondrial activity, we first measured mitochondrial respiratory chain complex assembly into super-complexes, which increases respiratory efficiency (49). Comparative analysis of super-complex formation via blue native page (BN-PAGE) 48h post MEKi treatment showed greater abundance of high-molecular-weight respiratory super-complexes relative to DMSO treated cells (Fig. 5C).
To determine whether the MEKi-induced increase in mitochondrial ISC proteins and super-complexes support enhanced mitochondrial function, we first performed an in-gel activity assay to measure complex I activity of isolated mitochondria from KP4 cells. In accordance with our results, MEKi treatment led to an increase in mitochondrial complex I enzymatic activity (Fig. 5D). Additionally, we observed a significant increase in mitochondrial ACO2 activity in MEKi treated cells (Fig. 5E) suggesting that the increased iron level in MEKi treated cells supports mitochondrial TCA cycle and contributes to ETC activity.
Consistent with increased super-complex assembly and in-gel activity, the respiratory activities of individual complex I and complex II (Fig. 5F), as well as basal and maximal respiration (Fig. 5G,H), measured via Seahorse, were increased in MEKi treated cells. Accordingly, pathways associated with increased mitochondrial activity such as ‘fatty acid metabolism” were also enriched in our whole cell proteomics dataset generated from MEKi treated cells (Supplementary Fig. S6H, Table S8). Consistent with these findings, MEKi treatment sensitized PDA cells to the mitochondrial complex I inhibitor, Phenformin (Supplementary Fig. S6I,J) or iron chelation with DFO (Supplementary Fig. S6K).
Autophagy-lysosome inhibition blocks MEKi induced upregulation of mitochondrial ISC proteins and mitochondrial activity.
Our findings highlight a pivotal role for transcriptional induction of lysosome biogenesis and activation of ferritinophagy in driving metabolic reprogramming in response to MAPK pathway suppression in PDA. To establish a requirement for selective autophagy and the lysosome, we suppressed ferritinophagy or overall lysosomal activity, and measured the level of ISC proteins in MEKi treated cells. We found that blocking ferritinophagy via knockdown of NCOA4 was sufficient to suppress MEKi induced upregulation of ISC proteins in KP4 cells (Fig. 6A), while iron supplementation with ferric ammonium citrate (FAC) was sufficient to rescue the level of ISC proteins under conditions in which NCOA4 knockdown was combined with MEKi treatment (Fig. 6A). Similarly, direct lysosome inhibition with Chloroquine (CQ) also blocked MEKi-induced upregulation of ISC protein expression (Fig. 6B; Supplementary Fig. S7A). Of note, MEKi treatment phenocopied FAC treatment, confirming our finding that increased intracellular iron is associated with MAPK pathway inhibition (Fig. 6B; Supplementary Fig. S7A). CQ treatment also blocked MEKi-induced ETC complex activity, as measured by in-gel activity assays, which could be rescued following addition of FAC (Fig. 6C). Importantly, ferritinophagy blockade via shRNA mediated knockdown of NCOA4, was sufficient to suppress MEKi-induced upregulation in mitochondrial respiration as measured by Seahorse (Fig. 6D,E). These results underscore the critical requirement for lysosomal-derived iron as a major contributor to the generation of ISC-containing proteins and in stabilizing and enhancing mitochondrial respiratory super-complexes in response to MEKi treatment.
Figure 6: Blockade of ferritinophagy or the lysosome impairs mitochondrial activity and cell viability.
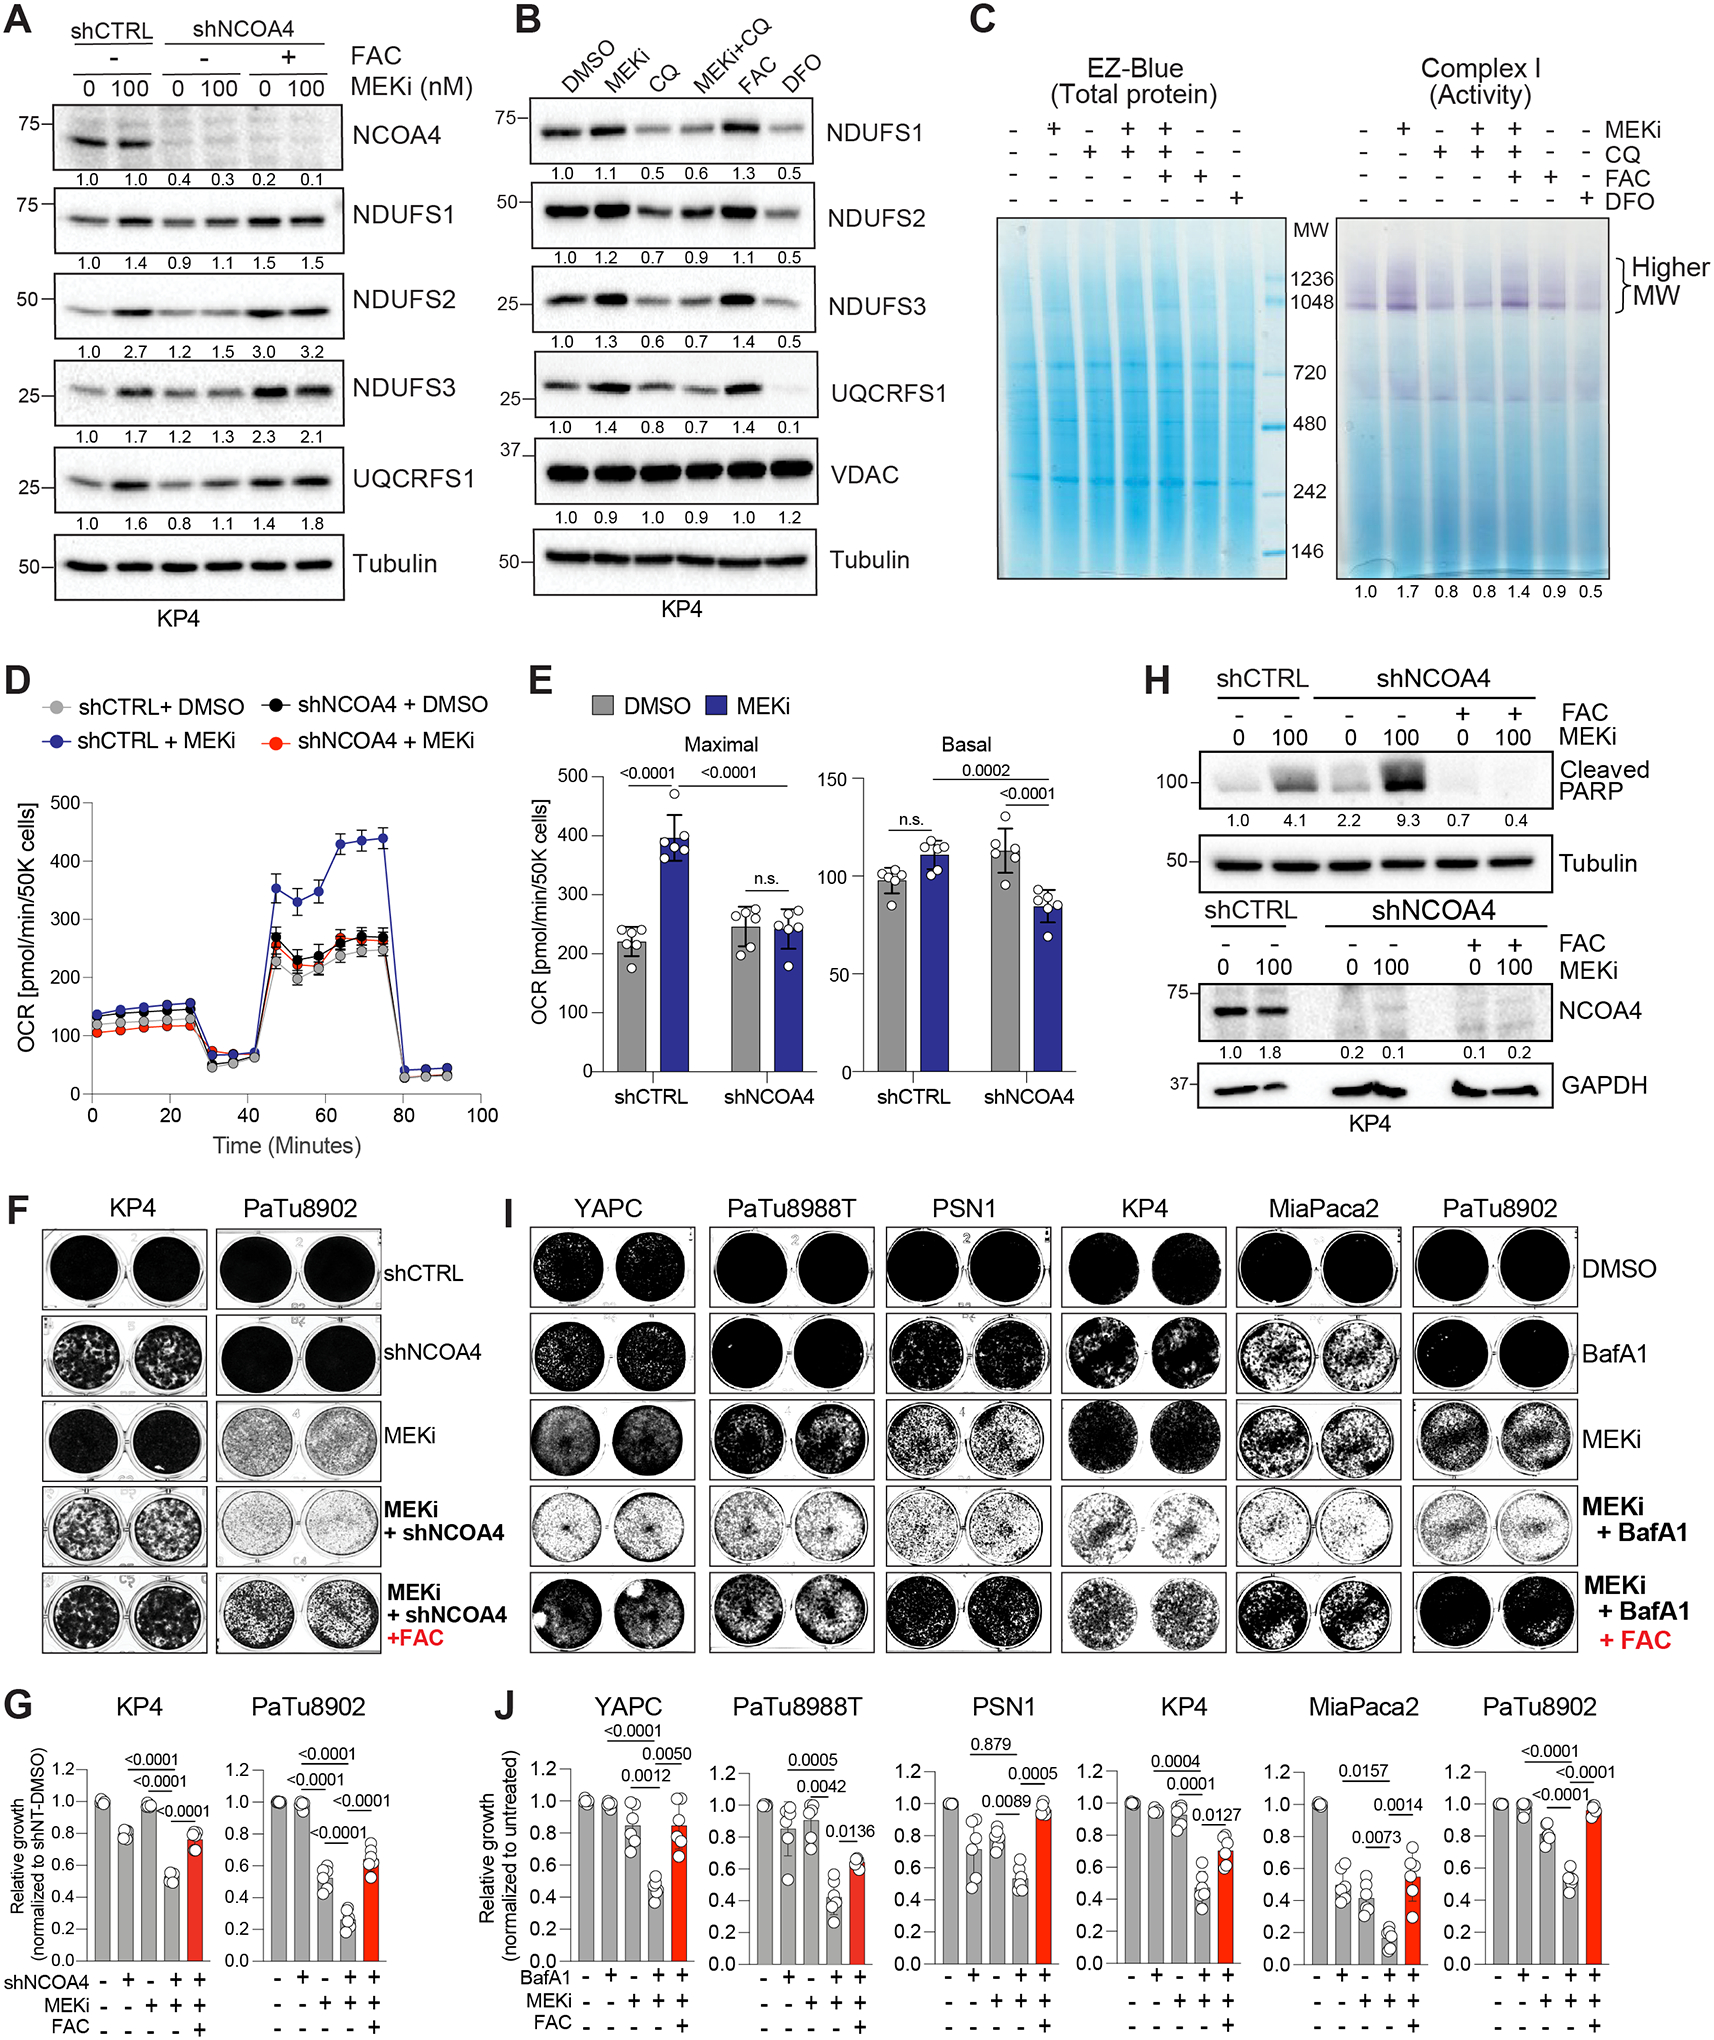
A. Immunoblot of the indicated proteins following shRNA mediated knockdown of NCOA4 in the presence or absence of MEKi or exogenous iron (FAC,150μM).
B. Immunoblot of the indicated ISC proteins and VDAC following 48h treatment with Chloroquine (CQ, 12.5μM) in the presence or absence of MEKi (100nM). Treatment with exogenous iron (FAC, 150μM) or an iron chelator (DFO, 300μM) serve as positive and negative controls, respectively.
C. Complex I in-gel activity assay from purified mitochondria isolated from KP4 cells treated with the indicated agents for 48h. Darker purple stain indicates higher complex activity. EZ-Blue staining (left) serves as loading control.
D. Measurement of oxygen consumption rate following shRNA mediated knockdown of NCOA4 in KP4 cells treated with DMSO or MEKi.
E. Basal and maximal oxygen consumption rates from the experiment in D.
F, G. Crystal violet stain (F) and quantification (G) of proliferation of the indicated cell lines following shRNA mediated knockdown of NCOA4 treated with MEKi, MEKi+FAC.
H. Immunoblot of the indicated proteins following shRNA mediated knockdown of NCOA4 in the presence or absence of MEKi and following addition of exogenous iron (FAC, 150μM).
I, J. Crystal violet stain (I) and quantification (J) of proliferation of the indicated cell lines following treatment with MEKi, BafA1, MEKi+BafA1 or MEKi+BafA1+FAC.
Data are the mean ± s.d (E,G,J) and SEM (D). P values were determined using an unpaired two-way ANOVA (E), one-way ANOVA (G, J). MEKi treatment was 100nM for 48h.
Suppression of ferrintinophagy or lysosomal activity sensitizes PDA cells to MEKi treatment and inhibits growth
To test whether blocking ferritinophagy together with MEKi treatment is sufficient to block PDA growth, we next knocked down NCOA4 in combination with MEKi treatment. We observed a dramatic decrease in PDA growth (Fig. 6F,G) and induction of apoptosis as evidenced by increased levels of cleaved PARP (Fig. 6H). Importantly, iron supplementation was able to reverse the growth inhibition and apoptotic response induced following combined NCOA4 knockdown and MEKi treatment (Fig. 6F–H). These data highlight the importance of ferritinophagy-mediated iron supply for sustaining mitochondrial respiration and PDA viability upon MAPK pathway suppression.
Prior studies showed inhibition of PDA growth following co-treatment with MEKi or ERKi and lysosome inhibitors (11, 12). We confirmed that combined treatment with MEKi (Fig. 6I,J) or ERKi (Supplementary Fig. S7B,C) and low-dose BafA1, or treatment with MEKi and low-dose CQ (Supplementary Fig. S7D,E) was sufficient to block growth across multiple human PDA cell lines. Importantly, we show that exogenous iron supplementation is sufficient to rescue the growth inhibition observed following combined MAPK and lysosome blockade (Fig. 6I,J; Supplementary Fig. S7B–E). Altogether, our results pinpoint a key role for autophagy-lysosome-dependent iron delivery in supporting cell proliferation following MAPK pathway inhibition.
Lysosome-mitochondria signature is maintained following long-term MAPK inhibition.
To test whether coordinated lysosome-mitochondrial activity is maintained during long-term MAPK pathway suppression, we chronically treated KP4 cells with MEKi for 60 days. These cells maintained reduced phospho-ERK1/2, confirming pathway suppression. Importantly, chronic MEKi treatment led to increased TFEB, FTH1, FTL and mitochondrial ISC proteins and a decrease in MYC (Supplementary Fig. S8A). Similarly, mouse iKRAS cells in which oncogenic Kras can be inducibly suppressed following withdrawal of Dox from the culture media (5), also showed an increase in Tfe3, Lamp1, Lc3b, Fth1, Ftl (Supplementary Fig. S8B) and a corresponding increase in mitochondrial ISC proteins (Supplementary Fig. S8C) following 32 days of Dox withdrawal. As with human PDA cells, iKRAS cells also maintained reduced Myc levels (Supplementary Fig. S8B). To test if increased mitochondrial activity is maintained following prolonged exposure to MEKi treatment, we treated KP4 cells for 8 days with MEKi and measured basal and maximal respiration or by individual respiratory complex activity using Seahorse. Similar to acute treatment (Fig. 5F–H), 8-day treatment led to increased mitochondrial respiration (Supplementary Fig. S8D,E) and individual complex activity (Supplementary Fig. S8F) compared to DMSO treatment. Finally, analysis of publicly available datasets identified upregulation of the lysosome gene signature and downregulation of MYC gene targets in response to MEKi treatment of colorectal (HCT116; Fig. 7A) (50) and non-small cell lung cancer (A549, H2030, H460; Fig. 7B) (51) cells, suggesting that reciprocal regulation of these two pathways may be a broad feature of MAPK pathway inhibition.
Figure 7: Activation of autophagy-lysosome signatures occur broadly in response to stress and is anti-correlated with MYC activity.

A, B. Top upregulated pathways (Hallmark and KEGG) identified using gene set enrichment analysis of RNA-seq data obtained from HCT116 cells treated with DMSO and MEKi (30nM) for 8 weeks (GSE118490) (A) and NSCLC cell lines (A549, H2030, H460) treated with DMSO and MEKi (25nM) for 8 days (GSE110397) (B).
C. Pearson correlation analysis of MYC (MYC_score) and MiT/TFE (Lyso_score) signatures in TCGA datasets from the indicated cancers. PAAD (n=111), COAD (n=171) and NSCLC (n=156) KRAS mutant tumors.
D. Violin plots depicting the distribution of MYC_score associated with high and low Lyso_score of the TCGA datasets used in C.
E. Model depicting the interplay between transcriptional and catabolic pathways in mediating adaptation to MAPK pathway suppression. Competition between MYC and MiT/TFE TFs for binding to autophagy and lysosome gene promoters regulates the magnitude of gene expression in PDA. Dysregulation of MYC, following MAPK suppression enables enhanced MiT/TFE-mediated induction of the autophagy-lysosome gene program. Enhanced pathway activity serves to maintain iron homeostasis important for mitochondrial respiration.
P values were determined using an unpaired two-tailed Student’s t-test.
MYC and MiT/TFE activity signatures are anti-correlated across KRAS driven cancers.
MYC and MiT/TFE factors display increased activity in PDA (16, 26, 27) due in part to their increased expression. However, our data suggests that upon KRAS-MAPK pathway suppression, a reduction in MYC levels effectively eliminates competition for binding to CLEAR elements, favoring enhanced promoter occupancy by MiT/TFE factors and increased lysosome gene activation. Based on this finding, we examined TCGA datasets to determine whether, a priori, MYC and MiT/TFE signatures are inversely correlated. We first generated a MYC score (Myc_score) and a MiT/TFE score (Lyso_score) based on the sum of the z-score of 240 MYC target genes and 135 MiT/TFE target genes, respectively. We observed an anti-correlation between high MYC_score and Lyso_score across three KRAS-driven cancer types (PAAD, NSCLC and COAD) (Fig. 7C). Likewise, stratification of PAAD, NSCLC and COAD into high and low Lyso_score based on the median z-score, also showed an inverse correlation with Myc_score (Fig. 7D).
Collectively, our findings uncover an early adaptive response to KRAS-MAPK pathway suppression that involves enhanced MiT/TFE transcriptional activity, which results in increased ferritinophagy flux and lysosome degradation that sustains iron-dependent mitochondrial activity. Our data also highlights a more general anti-correlation between MiT/TFE and MYC transcription factor activity, which may serve to modulate the magnitude of lysosome gene expression. However, in response to KRAS-MAPK suppression, a shift favoring the MiT/TFE program may contribute to establishing a permissive cell state that enables survival.
Discussion
Mutational activation of KRAS and increased downstream signaling via the MAPK pathway are near universal in PDA and function to increase proliferation in part through rewiring of cellular metabolism. Prior studies have shown that KRAS activation drives increased glycolytic flux to provide key intermediates of glucose metabolism that fuel anabolic pathways including hexosamine biosynthesis and generation of nucleic acids (5, 10, 52). Accordingly, genetic suppression of KRAS or treatment with small molecule inhibitors targeting downstream signaling nodes including MEK or ERK, show a significant decrease in glucose uptake and glycolysis (5, 11), and a corresponding increased reliance on autophagy (11, 12) and mitochondrial activity (15) in PDA. These studies point towards a switch in metabolic dependency following KRAS-MAPK pathway suppression and our findings provide mechanistic insight into how this switch occurs (Fig. 7E).
First, we show that despite high levels of baseline autophagy and lysosome activity in PDA (16), this pathway can be further elevated via increased engagement of the MiT/TFE transcription factors in response to MAPK pathway inhibition. Our findings indicate that, at baseline, nuclear localized TFE3 binds to lysosome gene promoters but is restricted from reaching maximal occupancy due to competitive binding of MYC to the same loci. MiT/TFE transcription factors belong to the same superfamily as MYC but they do not heterodimerize (53) and so their common presence at lysosome gene promoters is unlikely due to physical interaction with each other. Instead, both MYC and MiT/TFE factors are highly expressed in PDA (16, 54), which may allow for broader occupancy across canonical and non-canonical E box elements. Accordingly, downregulation of MYC – via genetic suppression of MYC or KRAS or inhibitor-based suppression of KRAS, MEK or ERK – allows MiT/TFE proteins unrestricted occupancy at autophagy and lysosome gene promoters, leading to further upregulation of autophagy and lysosome gene expression in PDA. While signaling mediated mechanisms that impinge on ULK1 activity have also been shown to increase autophagy flux following MAPK pathway inhibition (11, 12), our findings suggest that transcriptional induction ensures sustained and coordinated autophagy-lysosome pathway induction in response to stress.
Recent studies have highlighted a stringent dichotomy between MiT/TFE proteins and MYC in regulation of lysosome gene expression in acute myeloid leukemia (55), Hela cells and iPSCs (33) and in maintenance of stem cell renewal (56). These studies show mutual exclusivity of MiT/TFE and MYC expression patterns, corresponding gene signatures and cellular programs. Our analysis of TCGA datasets indicate that this dichotomous state exists at baseline in several KRAS driven tumors. MAPK pathway suppression and the subsequent decrease in MYC transcript and protein levels, tilts the balance in favor of MiT/TFE factors by effectively eliminating competition for promoter binding, and allowing persistent engagement of MiT/TFE proteins with their target gene promoters. Interestingly, Yun and colleagues show that overexpression of TFEBS211A – a constitutively active nuclear form of TFEB – was able to bypass MYC repression and induce lysosome gene expression in AML cells (55). This finding is in line with our prior study showing that MiT/TFE proteins are upregulated and constitutively nuclear in PDA cells, which may enable partial bypass of MYC driven suppression to maintain high baseline levels of autophagy and lysosome activation (16). Unlike the study by Yun et al (55), in which TFEB was proposed as a tumor suppressor in AML due to its ability to regulate programs favoring differentiation, in PDA, MiT/TFE proteins are pro-tumorigenic and sustain tumor cell metabolism and high rates of autophagic and macropinocytic flux (10, 17). Hence the role of MiT/TFE factors in tumorigenesis may depend on cell type and cell state and the specific gene programs that are activated.
A second key insight is our observation that NCOA4-mediated ferritinophagy is upregulated in the context of unrestricted MiT/TFE activation following MEKi treatment. Immuno-isolation of lysosomes followed by proteomics-based profiling identified increased degradation of ferritin in MEKi treated cells relative to control cells, while other forms of selective autophagy, such as mitophagy, was not induced. Increased ferritinophagy led to a subsequent increase in intracellular labile iron levels. Paradoxically, despite increased degradation of ferritin, we also noted that FTH1 and FTL transcript and protein levels are elevated in MEKi treated cells. This result is consistent with a prior study showing that MYC negatively regulates ferritin expression (47). We confirm that knockdown of MYC or treatment with MEKi, which leads to downregulation of MYC, causes an increase in FTH1 and FTL transcript in PDA cells. Taken together, we propose that ferritin is dually regulated at the transcriptional and protein level in response to MAPK pathway suppression. The purpose of a dual increase in ferritin production and degradation may be to ensure that all iron is captured by ferritin and delivered to lysosomes prior to distribution elsewhere in the cell. Recent work supports a role for the lysosome as an obligate conduit for mitochondrial iron uptake, by ensuring that iron transfer to mitochondria is facilitated by direct contact with endolysosomes (57).
Accordingly, our studies highlight an essential role for lysosome derived iron in maintenance of ISC-containing proteins critical for mitochondrial ETC activity and respiration capacity. ISCs serve as critical cofactors for several proteins involved in DNA replication and repair, TCA cycle and mitochondrial respiration (38, 39). Mitochondrial ISC proteins are components of complex I, II and III of the ETC and are required for the assembly, stabilization, and function of these complexes (48). We find that, in response to MEKi treatment, several ISC proteins of the ETC are upregulated and assemble into stable super-complex structures that promote enhanced respiratory output. Further analysis of our proteomics dataset also showed an enrichment for fatty acid metabolism signatures in MEKi treated cells, which may generate metabolites that fuel increased oxidative phosphorylation. Increased reliance on mitochondrial output was previously shown to be a hallmark of PDA cells that no longer depend on oncogenic KRAS for growth (15). Our studies provide important mechanistic insight into how this reliance is established and the role of enhanced autophagy-lysosome pathway activity in this switch. Likewise, our studies suggest that the synergistic anti-tumor activity resulting from combined MAPK pathway and lysosome inhibition reported previously (11, 12) is due, in large part, to the inability of MEKi treated cells to mobilize lysosome derived iron following co-treatment with CQ. Consistent with this idea, iron supplementation was able to rescue growth and viability of MEKi treated cells in which ferritinophagy or lysosome activity was simultaneously suppressed. While the lysosome plays a central role in regulation of proliferative signaling (58), cholesterol homeostasis and lipid transfer (59), metabolic regulation (60, 61) and maintenance of ion homeostasis including calcium (62) and iron (43, 44, 62) our studies suggest that lysosome dependency following MEKi treatment centers on regulation of iron. Together, our findings highlight a critical role for multi-organelle crosstalk, incorporating NCOA4-mediated ferritinophagy, lysosome dependent iron supply and mitochondrial iron dependent respiration, in promoting adaptation and survival following MAPK pathway inhibition.
Upregulation of ferritinophagy was also observed following treatment of PDA cells with ERKi, genetic suppression of oncogenic KRAS or treatment with the KRASG12C inhibitor AMG 510. Thus, reliance on ferritinophagy and lysosomal iron supply to fuel mitochondrial activity appears to be a broadly applicable dependency following KRAS-MAPK pathway suppression and may therefore have important therapeutic implications. Moreover, we show that upregulation of MiT/TFE proteins and ferritinophagy is retained after 60 days of MEKi treatment, suggesting that cells may utilize this stress response pathway to sustain viability long enough to acquire genetic alterations that enable chronic resistance to KRAS-MAPK inhibition. Results from ongoing clinical trials combining MEKi/ERKi treatment with the lysosomal inhibitor hydroxychloroquine, will help to evaluate the long-term potential of this combination in suppressing PDA progression. Moreover, directly targeting ferritinophagy in the context of KRAS-MAPK inhibition may lead to more potent or sustained anti-tumor activity.
Materials and Methods
Cell culture and reagents
MiaPaCa2, KP4, PaTu8902, PaTu8988T, Panc-1, PSN1, YAPC and HEK293-T cell lines were obtained from ATCC. MiaPaca2, KP4, PaTu8902, PaTu8988T, Panc-1, YAPC and HEK293-T were cultured in DMEM media (Gibco) supplemented with 10% FBS (Atlanta biologicals), 1% Pencillin/Streptomycin (Gibco) and 15mM HEPES (Gibco). PSN1 cells were grown in RPMI media (Gibco) supplemented with 10% FBS (Atlanta biologicals,), 1% Pencillin/Streptomycin (Gibco). Mouse inducible KRAS (iKRAS) cell lines were a gift from Dr. Ronald DePinho (MD Anderson Cancer Center) and were cultured as previously described (63). All cell lines were grown in a humidified chamber at 37°C, 5% CO2. Cells were trypsinized using TrypLE (Gibco). Cell lines are tested for mycoplasma using MycoAlert Detection Kit (Lonza, LT07–418) at least once a month and the cell lines were authenticated by STR fingerprinting. Cell lines are passaged for a maximum of 15 passages upon thawing prior to replacement.
Trametinib and SCH779284 were purchased from Selleckchem. AMG 510 (Sotorasib) was purchased from MedChem Express. Hyroxychloroquine was purchased from Sigma. Bafilomycin was purchased from CST. Ferrous ammonium citrate, ferrous ammonium sulfate, NADH, Deferoxamine and Ferrostatin were purchased from Sigma. Iron binding dye FeRhoNox-1 was purchased from Goryo chemical and FerroOrange was purchased from Dojindo. Mitochondrial complex I inhibitor Phenformin was purchased from Cayman chemicals. Puromycin was purchased from Gibco. All chemicals were used at the indicated concentrations. Subcellular fractionation was performed using NE-PER nuclear and cytoplasmic extraction kit (ThermoFischer, 78833).
Constructs
pLJM1-TMEM192-RFP-3XHA was generated as previously described (34, 64). pMRX-IP-GFP-LC3-RFP-LC3ΔG (Addgene plasmid#:84572) was a gift from N. Mizushima, University of Tokyo, Japan.
shRNA vector, pLKO.1-TRC- puromycin, was obtained from the Sigma MISSION TRC shRNA library. pLKO.1-TRC vector containing human NCOA4, 5’-TCAGCAGCTCTACTCGTTATT-3’, TRCN0000236186 was cloned according to the Addgene shRNA cloning protocol.
Lentiviral experiments
Lentivirus was produced by transfecting HEK293T cells with lentiviral vector pLKO.1 containing shRNA sequence and packaging plasmids psPAX2 (Addgene, plasmid #: 12260) and pMD2.G (Addgene, plasmid #: 12259) at a ratio of 4:3:1 using X-tremeGENE transfection (6365787001; Sigma Aldrich) reagent following manufacturer’s instructions. The supernatant containing the virus was collected after 48h by passing through 0.45μM filter, aliquoted and stored at −80°C until further use. Cells were infected with media containing virus using polybrene reagent (TR-1003-G; EMD Millipore) following manufacturer’s protocol and selected for at least 48 hours in 2μg/mL of puromycin.
siRNA mediated knockdown
Predesigned Silencer select siRNAs were purchased from Invitrogen. Cells were transfected with Silencer select siRNA using Lipofectamine RNAiMAX transfection reagent (Invitrogen, 13778100) following manufacturer’s instruction. Briefly, 250,000 cells were plated in 6 well plates and allowed to attach overnight. 0.5 μM of siRNA in 100 μl of optiMEM media (Gibco) was mixed with 5 ul of RNAiMax solution in OptiMEM and incubated at RT for 15min. The mixture was added dropwise to the cells in media without antibiotics and incubated for at least 8h. Cells were transfected on 2 consecutive days and downstream assays were conducted for 48h. The IDs for the siRNAs used in this study are as follows: siCTRL (4390846, Invitrogen), siTFEB (s15495, Invitrogen) and siMYC (s9129, Invitrogen).
Autophagic flux assay
Stable cell lines expressing GFP-LC3-RFP-LC3ΔG construct were subjected to DMSO (control) or Trametinib treatment for 48h. Following treatment, cells were lifted using TrypLE, resuspended in FACS buffer (1X PBS containing 2% FBS) and the fluorescence was measured by flow cytometry. The ratio of RFP over GFP fluorescence was reported as autophagic flux.
Immunoblotting
Cell were washed twice with ice cold PBS and lysed in either RIPA lysis buffer (50mM Tris-HCl, pH 8.0, 150mM Sodium Chloride, 1% NP-40, 0.5% sodium deoxycholate, 0.1% SDS supplemented with 10mM β-glycerophosphate and protease inhibitor (Fisher Scientific-A32965)) or regular lysis buffer (50mM HEPES, pH 7.4, 40mM Sodium Chloride, 10mM Sodium-pyrophosphate, 10mM β-glycerophosphate, 50mM Sodium Fluoride, 2mM EDTA, 1% Triton X-100 supplemented with protease inhibitor). The protein concentration was quantified using Pierce BCA Protein Assay Kit (Life Technologies-23227) following manufacturer’s instructions. 15–20 ug of protein was resolved on SDS-PAGE (8–15%) and transferred onto PVDF membrane (EMD MIllipore-IPVH00010). The membrane was blocked with 5% skim milk and incubated overnight with primary antibody (see Table S9 for antibody details) diluted in 5% skim milk or 5% bovine serum albumin at 4°C. Membranes were washed in 1XTBS-T and incubated for an 1h at RT with species-specific horseradish peroxidase-conjugated secondary antibody. Membranes were subsequently washed and developed using supersignal West Pico Chemiluminescent substrate (Fisher Scientific-34080), and the images were captured using the ChemiDoc XRS+ System (BioRad).
RNA extraction and quantitative PCR
Total RNA was extracted using PureLink RNA Mini Kit (12183025; Thermo Fisher). cDNA synthesis was performed using iScript Reverse Transcription Supermix (1708841; Bio-Rad) according to manufacturer’s instruction. Real time quantitative PCR was performed using iTaq Universal SYBR Green Supermix (1725122; Bio-Rad) on a CFX384 Touch Real Time PCR Detection System (BioRad) following standard protocols. Relative gene expression level was analyzed by comparative Ct method and was normalized to 18s rRNA. Sequences of primers used are listed in Table S10.
RNA-sequencing and analysis
For transcriptome profiling of PDA cell lines, Illumina compatible RNA-sequencing libraries were created from purified RNA using the Tecan Universal mRNA Plus kit (9156-A01). Libraries were sequenced using an Illumina HiSeq 4000 using single end 50bp reads at the UCSF Center for Advanced Technology (https://cat.ucsf.edu). Sequencing reads were aligned to the human reference genome (GRCh38) and reads per gene matrix were counted using the latest Ensemble annotation build using STAR (65). Read counts per gene were used as input to DESeq2 (66) to test for differential gene expression between conditions using a Wald test, while correcting for possible covariates. Genes passing a multiple testing correct p-value of 0.1 (FDR method) were considered significant.
For public RNA-Seq data analysis, .txt files containing normalized counts for the colon cancer cell line (HCT116; GSE118490) and Non-Small Cell Lung Carcinoma (A549, HCT116 and H460; GSE110397) cell lines were downloaded from GEO database. Geneset enrichment analysis (GSEA) comparing DMSO and MEKi conditions was conducted with Broad institute GSEA software (version 4.2.0) (67) using KEGG and Hallmark geneset in MsigDB. Further visualization was performed using dotplot in R (version 1.3.1073).
Chromatin immunoprecipitation
Cells were crosslinked with 1% formaldehyde for 10min and the reaction was stopped with 125mM glycine at RT. Cells were lysed in lysis buffer (150mM NaCl, 50mM Tris-HCl pH7.5, 5mM EDTA pH 8, 0.5% NP-40, 1.0% Triton X-10) for 10min and cell slurry was homogenized further with a 20G syringe. The lysed cells were pelleted and resuspended in shearing buffer (50mM Tris-HCl pH 8, 10mM EDTA pH 8, 1% SDS) supplemented with protease inhibitor, and sonicated for 25min using Covaris Focused Sonicator at 4°C. Shearing of the chromatin was verified via agarose gel electrophoresis after reverse crosslinking. 100μg of chromatin was diluted ten times in ChIP dilution buffer (50mM Tris-HCl pH 8, 0.167M NaCl, 1.1% Triton X-100, 0.11% sodium deoxycholate) and 3μg of antibody (MYC: 9402, CST, TFE3: HPA023881, Sigma, IgG: 2729, CST) was added per IP (total volume 1.9 ml) and incubated overnight at 4°C. Immunoprecipitated chromatin was captured using 60ul of Protein A Dynabeads (Invitrogen) and incubated with rotation for 2 hours, followed by sequential washing with ice-cold RIPA buffer containing 150 mM salt (50mM Tris-HCl pH 8, 0.15M NaCl, 1mM EDTA pH 8, 0.1% SDS, 1% Triton X-100, 0.1% sodium deoxycholate), or 500 mM salt (50mM Tris-HCl pH 8, 0.5M NaCl, 1mM EDTA pH 8, 0.1% SDS, 1% Triton X-100, 0.1% sodium deoxycholate) and twice with lithium chloride buffer (50mM Tris-HCl pH 8, 1mM EDTA pH 8, 1% Nonidet P-40, 0.7% sodium deoxycholate, 0.5M LiCl2). The final wash was performed with 1xTE buffer (10mM Tris-HCl pH 8, 1mM EDTA pH 8) and eluted for 4h at 55°C with elution buffer (10mM Tris-HCl pH8, 0.3M NaCl, 5mM EDTA pH 8, 0.5% SDS) containing RNaseA. Eluted chromatin was separated from the magnetic beads and reverse crosslinked overnight with Proteinase K at 65°C prior to phenol/chloroform extraction using phase lock tubes (Qiagen) and ethanol precipitation. Eluted DNA was used for library preparation and qPCR analysis.
ChIP-seq library preparation and analysis
Illumina compatible libraries were created from post-ChIP DNA with the Illumina DNA Flex library preparation method (Illumina Cat # 20018705) following the manufacturer’s protocol. DNA libraries were then pooled to run on a MiniSeq for quality assurance prior to sequencing on an Illumina HiSeq 4000 with single end 50bp reads. All libraries were sequenced to a depth of at least 28M reads.
ChIP-seq FASTQ’s were mapped and peak-called using ENCODE’s chip-seq-pipeline2 (https://github.com/ENCODE-DCC/chip-seq-pipeline2) from 2 biological replicate and their replicates. IDR-Optimal peak set at a threshold of 5% was used for ChIP-experiment specific analysis. Using GencodeV38’s ‘All’ Comprehensive Gene Annotation (68) for GrCh38.p13 and the lysosomal geneset and MYC target geneset, promoter regions were designated as +/− 1kb from each TSS. Using deepTools bamCompare (69), ChIP-input normalized bigwig files were generated (70) with options: --binSize 50 –scaleFactorsMethod None –normalizeUsing CPM –smoothLength 1000 –extendReads 275 –centerReads. Profile plots were generated using deepTools computeMatrix (69) with options: --referencePoint center -a 2000 -b 2000 –skipZeros. The original MACS2 narrowpeak peaksets were also sorted by signalValue score for unique gene promoters from highest to lowest for further analysis of the top scoring genes.
Lysosome purification and proteomics
Intact lysosomes were purified as previously described (34). In brief, cell lines stably expressing TMEM192-mRFP-3XHA were treated with DMSO or 100nM MEKi for 48h alone or in combination with Bafilomycin A1 (400nM, 4h). The cells were scraped in ice-cold KPBS buffer (136 mM KCl, 10 mM KH2PO4, pH 7.25) supplemented with Pierce protease inhibitor and were collected by centrifugation. The pellets were resuspended in KPBS buffer supplemented with 50mM sucrose and 0.5μM TCEP and mechanically lysed followed by centrifugation at 2700 rpm for 10 minutes. The supernatant containing the organelles was incubated with 50 ul of anti-HA conjugated Dynabeads (Thermo Scientific, 88837) for 30 minutes with rotation. Lysosome bound beads were washed three times; and eluted overnight at 4°C using KPBS buffer containing 0.1% NP-40 detergent. Protein concentration was measured using the Pierce BCA Protein Assay Kit. Equal amounts of protein from each condition were used for mass spectrometry-based proteomics or immunoblotting.
Mass spectrometry analysis was performed as follows. A trichloroacetic acid (TCA) precipitation was performed to remove detergents by adding 1 volume of 6.1N trichloroacetic acid to 4 volume of sample and incubated on ice for 10 mins. The samples were centrifuged at 14k rpm at 4°C for 5 mins and the supernatant was removed. The pellet was then washed twice with 200μl of cold acetone at 14k rpm at 4°C for 5 mins and the residual acetone was allowed to evaporate.
The precipitated protein was resuspended in 100μl of 6M urea in 100mM Tris pH, 7.8 and treated with 5μl of 200 mM DTT in 100mM Tris pH, 7.8 for 60 mins to reduce the disulfide bonds. The resulting free cysteine residues were subjected to an alkylation reaction. The samples were subjected to tryptic digest at 37°C overnight with gentle shaking. Urea, Tris and other non-volatile reagents in the sample were removed by solid phase extraction using Sep-Pak Plus C18 Cartridges (Waters Corp; WAT020515) according to manufacturer’s specifications.
The peptide solutions were manually injected on a Shimadzu microflow HPLC system consisting of two LC20AD pumps, a CBM20A controller and a FRC10A fraction collector. Fractions were analyzed by reversed phase high performance liquid chromatography (HPLC) using Waters NanoAcquity pumps and autosampler and a ThermoFisher Orbitrap Elite mass spectrometer using a nano flow configuration. Peptides were identified from the MS data using SEQUEST algorithms. A species specific database was generated from NCBI’s non-redundant (nr.fasta) database and concatenated to a database of common contaminants (keratin, trypsin, etc). The resulting data was then loaded into Scaffold (Proteome Software) and a minimum of two peptides and a peptide threshold of 95% and protein threshold of 99% were used for identification of peptides and protein positive identifications.
For comparative analysis between DMSO and MEKi treated lysosomal elutes, minimum peptide abundance was set to 1 for all replicates. Fold change was calculated between the DMSO (3 replicates) and MEKi (3 replicates) treated samples and statistical significance was calculated using a two-tailed unpaired t-test. The data was represented as a volcano plot displayed as the log2 of the fold change, and the −log10 of the P value.
Whole Cell Proteomics
Mass spectrometry-based proteomics was performed as previously described (23). Briefly, cell pellets from KP4 cells were lysed using 8 M urea, 200 mM 4-(2-hydroxyethyl)-1-piperazinepropanesulfonic acid (EPPS) at pH 8.5 with protease inhibitors. A total of 50–100μg of protein was aliquoted for each condition and TMT channel for further downstream processing. Proteins were digested overnight with Lys-C (1:100, enzyme: protein ratio) at room temperature. The next day, trypsin (1:100 ratio) was added and incubated at 37°C for an additional 6h. To each digested sample, 30% anhydrous acetonitrile was added and 50μg of peptides were labeled using 100μg of TMT reagent. To equalize protein loading, a ratio check was performed by pooling 2 μg of each TMT-labeled sample and analyzed by LC-MS/MS. Normalization factors were calculated from this label check, samples were mixed 1:1 across all TMT channels and desalted using a 100 mg Sep-Pak solid phase extraction cartridge. Pooled TMT-labeled peptide samples were fractionated with basic-pH reverse-phase (bRP) HPLC and fractions were subsequently desalted using StageTips prior to analyses using LC-MS/MS.
All mass spectrometry data was acquired using an Orbitrap Lumos mass spectrometer in-line with a Proxeon NanoLC-1200 UHPLC system. Peptides were separated using an in-house 100 μm capillary column packed with 40 cm of Accucore 150 resin (2.6 μm, 150 Å) (ThermoFisher Scientific) using a 120 min LC gradient from 4 to 24% acetonitrile in 0.125% formic acid per fraction. Eluted peptides were acquired using a synchronous precursor selection (SPS-MS3) method for TMT quantification as previously described (71). Intelligent data acquisition (IDA) using real-time searching (RTS) was performed using Orbiter (72). All acquired data were processed using Comet (73) and a previously described informatics pipeline (74). Briefly, peptide spectral libraries were first filtered to a peptide false discovery rate (FDR) of less than 1% using linear discriminant analysis employing a target decoy strategy. Spectral searches were done using a custom fasta-formatted database which included common contaminants, reversed sequences (Uniprot Human, 2020). Resulting peptides were further filtered to obtain a 1% protein FDR and proteins were collapsed into groups. For quantitation, a total sum signal-to-noise of all report ion ions of 100 was required for analysis. Lastly, protein quantitative values were normalized so that the sum of the signal for all protein in each channel was equal to account for sample loading. For comparative analysis, the fold change was calculated between the DMSO (3 replicates) and MEKi (3 replicates) treated samples and statistical significance was calculated using a two-tailed unpaired t-test. The data was represented as a volcano plot displayed as the log2 of the fold change, and the −log10 of the P value.
Immunofluorescence
Cells were cultured on coverslips coated with fibronectin and treated with DMSO or drug for the indicated time. Following treatment, cells were washed twice with PBS and fixed in ice-cold methanol at −20°C for 5min or 4% PFA for 10min at RT. PFA fixed cells were permeabilized in 0.1% saponin for 10min at RT. Cells were blocked with 5% normal goat serum for 15min at RT. After blocking, cells were incubated overnight with primary antibody (for antibody details refer Table S9) at 4°C. Subsequently, cells were washed three times with PBS and incubated in species-specific fluorophore-conjugated secondary antibody for 45min at RT. Coverslips were mounted using Fluoromount-G containing DAPI (100–20, SouthernBiotech) and allowed to dry overnight. Cells were imaged using a Zeiss Laser Scanning Microscope (LSM) 710 using a 63x objective. Image processing and quantification were performed using ImageJ software. Measurement of colocalization was performed using thresholded images using the image calculator function in ImageJ. Percent overlap of pixels in red and green channel was calculated from a minimal of 10 fields per condition. Total fluorescence was measured for at least 60–100 cells per condition using the mean fluorescence intensity function in ImageJ following background fluorescence subtraction.
Iron quantification using live cell imaging and flow cytometry
Quantification of cellular iron by live cell imaging was performed using FerroOrange dye (Dojindo, F374) following manufacturer’s instruction. Briefly, cells were seeded on Poly-D-Lysine coated 35 mM glass bottom MatTek dishes (MatTek P35GC-1.5–14-C) and treated with DMSO or drugs as indicated. Following treatment, cells were washed twice with 1XPBS and incubated with 1μM of FerroOrange for 30 minutes at 37°C. After incubation, cells were imaged live using Leica SP5 microscope equipped with 63X objective at 37°C and 5% CO2. At least ten representative fields were captured per condition and the images were processed using ImageJ software. Mean fluorescence intensity was calculated on a per cell basis for at least 60–100 cells after subtracting the background fluorescence of each image.
For iron quantification using flow cytometry, cells were stained with 5μM FeRhoNox-1 (Goryo Chemical, SCT030) for an hour or 1μM FerroOrange dye (Dojindo, F374) for 30 minutes at 37°C. Following incubation cells were washed, trypsinized and resuspended in FACS buffer. 1 million cells were counted and used for analysis.
Transferrin uptake assay
2000 cells were seeded in a 96-well plate and treated with DMSO or drug as indicated. On the day of the experiment, cells were starved for 30 minutes in media without FBS at 37°C. Starved cells were pre-chilled on ice for 5 minutes and pulsed with pre-chilled Alexa fluorophore 488 conjugated transferrin (ThermoFischer, T13342, 50ug/ml) resuspended in serum free media for 30 minutes on ice. Following incubation, the media was replaced with prewarmed media containing FBS, and cells were immediately transferred to 37°C for 10min to initiate transferrin uptake. Cells were then washed twice with 1XPBS, fixed using 4% PFA for 10min at RT and stained with DAPI. Fluorescence was recorded using a plate reader (Cytation5, BioTek) and transferrin fluorescence intensity was normalized to DAPI.
Transferrin receptor quantification by flow cytometry
To quantify transferrin on the plasma membrane, cells treated with DMSO or drug were washed, detached with TryPLE and resuspended in ice-cold FACS buffer. Cells were stained with FITC-labeled transferrin receptor antibody (BioLegend, 334104) for 1h on ice and 1 million cells were counted per condition in triplicate.
Crude mitochondrial extraction and blue native page
Crude mitochondrial fraction was isolated as described (75) with slight modifications. Cells were pelleted, washed and resuspended in 500μl ice-cold PBS supplemented with protease inhibitor prior to mechanical lysis. 500μl ice-cold PBS was added to the suspension prior to centrifugation at 1000 xg for 10min at 4°C. Supernatant containing mitochondria was transferred to a new tube and centrifuged at max. speed for 10 min at 4°C and pelleted mitochondria was resuspended in ice-cold PBS. Protein concentration was measured using Pierce BCA Protein Assay Kit.
Blue Native (BN) PAGE was performed using Invitrogen NativePAGE system. 100–200μg of crude mitochondria was pelleted and resuspended in buffer containing 50mM Imidazole and 1M 6-aminohexanoic acid, pH 7. Digitonin (GoldBio D-180–2.5) was added at a ratio of 4g per gram of protein. The mixture was incubated on ice for 15–20 min and spun down at max. speed for 30 min at 4°C. Supernatant containing mitochondrial super-complexes was mixed with 1/3 volume of sample buffer (5% Coomassie brilliant blue G250 in 1M 6-aminohexanoic acid). 15–20μg of sample was loaded on 3–12% Bis-Tris Native PAGE gel (Invitrogen, BN1002BOX) with Native PAGE anode (Invitrogen, BN2001) and dark blue cathode buffer (Invitrogen, BN2002) at 90V on ice for 30 min. Dark blue cathode buffer was exchanged with light blue cathode buffer and the gel was run for an additional 90 min at 300V. Gels were transferred onto PVDF membrane and blotted with mitochondrial complex antibodies (for antibody details refer to Table S9). As a loading control, one set of samples were run in parallel and stained with EZBlue gel staining solution (Sigma, G1041).
In-gel activity assay
To measure the activity of mitochondrial respiratory complexes, crude mitochondrial extract was isolated and run on a precast Invitrogen Bis-Tris (3–12%) Native PAGE gel as described above with slight modifications. For in-gel activity, clear PAGE was performed where the gel was run with light blue cathode buffer for 30 min and exchanged with the cathode buffer without any blue dye additive. The gel was incubated in ice cold water for 20 min. Complex I activity was performed in dark at RT by adding freshly prepared activity buffer containing the substrate (0.1M Tris-HCl pH 7.5, 1mg/mL nitro blue tetrazolium (NBT), 0.14mM NADH). The reaction was carried out until the color was fully developed (15–20 min) and stopped with 10% acetic acid solution. The gel was washed in distilled water and scanned.
Aconitase activity assay
Mitochondrial aconitase activity was performed using aconitase activity kit (Abcam, ab183459) following manufacturer’s protocol. Briefly, cells were harvested and homogenized in cold assay buffer using a dounce homogenizer. For mitochondrial aconitase activity, the homogenized cells were spun down at max. speed for 15 minutes at 4°C and the pellet was resuspended in ice-cold assay buffer and sonicated for 20sec. The activity measurement was normalized to the total protein content.
Oxygen consumption rate using Seahorse
Oxygen consumption rate was measured using Seahorse XFe96 analyzer (Agilent). KP4 cells were treated with DMSO or drug or infected with shCTRL or shNCOA4 as indicated. On the day of the experiment, cells were trypsinized and 50000 cells resuspended in Seahorse media: DMEM with 8mM glucose, 2mM pyruvate and 2mM glutamine were seeded on Seahorse 96 well plate pre-coated with 25ug/ml Cell-Tak (Corning, 354240). Respiratory rates were measured with sequential injections of 1μM oligomycin, 750 nM FCCP twice and 1μM Antimycin and 1μM rotenone.
Individual mitochondrial complex activity using Seahorse
Assessments of individual respiratory chain complexes were performed with a Seahorse XFe96 Analyzer (Agilent) according to a previously established protocol (76). Briefly, 40,000 cells were plated in quadruplicate wells of a Cell-Tak treated XFe96 microplate and allowed to seed for 4 hours. Immediately prior to assay, cells were washed twice with 100μL of mitochondrial assay solution (220mM mannitol, 70mM sucrose, 10mM KH2PO4, 5mM MgCl2, 2mM HEPES, 1mM EGTA) and then overlaid with 175μL of mitochondrial assay solution supplemented with the Seahorse Plasma Membrane Permeabilizer (Agilent), 4mM ADP, 10mM sodium pyruvate and 1mM malate Cells were then sequentially subjected to 1μM rotenone, 10mM succinate, 1μM antimycin A, and 10mM ascorbate with 100μM N,N,N’,N’-tetramethyl-ρ-phenylene diamine.
Proliferation assay
To assess cell growth following treatment with MEKi in combination with BafA1, cells were seeded on 12 well plates at the following densities - KP4–35K; MiaPaca2, PaTu8988T-30K; PSN1–45K; PaTu8902–50K; YAPC-80K per well) and allowed to attach for 24h or 48h for YAPC. Cells were treated with DMSO or MEKi (100nM for KP4, YAPC, PaTu8988T; 10nM for PaTu8902, MiaPaca2 and PSN1) with or without low dose (1–2.5nM) BafA1. Rescue of growth was performed by addition of FAC (50μM-300μM) in the presence of ferrostatin (1–2μM). Growth was assessed after 6–7 days without media change.
To assess growth with ERKi, cells were seeded at the densities described above and treated with DMSO or ERKi (1μM for KP4, PaTu8988T, YAPC, 100nM for PaTu8902, MiaPaca2 and PSN1) in the presence or absence of low dose BafA1 (1nM for KP4, PaTu8902, PSN1; 0.75 nM for YAPC; 2 nM for PaTu8988T). Cell growth was rescued with FAC (50–300μM) and Ferrostatin (1–2μM) for 6–7 days without media change. For treatment with chloroquine, cells (MiaPaca2-30K, YAPC-80K) were treated with DMSO or MEKi (100nM for MiaPaca2 and YAPC) in the presence or absence of 12.5μM chloroquine and rescued with 50μM FAC and 1μM ferrostatin for 7 days. At the conclusion of each assay, cells were fixed in ice-cold methanol and stained with 0.1% crystal violet stain.
For proliferation assays with NCOA4 knockdown, cells (shCTRL and shNCOA4) were seeded in a 12 well plate (KP4, 35K; PaTu8902, 50K per well) and treated with MEKi (100nM for KP4, 10nM for PaTu8902) for 6 days. FAC (50 μM for PaTu8902 and 150 μM for KP4) and Ferrostatin (1μM for PaTu8902 and 2μM for KP4) was added on day 1 without media change. Cells were stained as described above.
Organoid culture
Organoids were established based on previously described protocols (77). Organoids were dissociated and 300,000 single cells per well were seeded in 10% growth factor-reduced Matrigel (Corning, 356231) and 90% human organoid feeding medium into 6-well plates. Cells were either treated with DMSO or 100nM Trametinib for 48h before harvest. At harvest, organoid cells were washed twice with ice-cold PBS, resuspended in Cell Recovery Solution (Corning, Cat#354253) for 30–60 min and washed 2–3 times with ice cold PBS to get rid of Matrigel prior to pelleting. Cell pellets were snap frozen on dry ice until use.
Mouse xenograft studies
All experiments were performed in accordance with University of California, San Francisco Institutional Animal Care and Use Committee (IACUC) approved protocol (AN181382). Nude mice (10 weeks old) were purchased from Jackson Laboratory and injected subcutaneously on both flanks with 2.5 ×10⁶ KP4 cells. Once tumors reached ~150 mm3, mice were randomized and treated with vehicle (5% (Hydroxypropyl)methyl cellulose) or MEKi (Trametinib 2mg/kg) for 11 days via oral gavage. The length and width of the tumors were measured three times a week using caliper and the volumes were calculated according to the formula: (length × width2)/ 2. At end point, tumors were dissected, proteins were extracted with RIPA lysis buffer and lysates were generated for analysis of target protein expression.
Analysis of TCGA patient dataset
RNA-seq data from TCGA database for PAAD, NSCLC and COAD tumor tissues carrying KRAS mutations were downloaded from UCSC Xena portal (http://xena.ucsc.edu). To compare the relative expression between lysosomal gene signature (16) and MYC target genes (Hallmark MYC targets), a z-score was calculated for each gene within the respective genesets. Next, the z-scores for all genes within a geneset was summed to generate a “Lyso_Score” and “MYC_score” for each tumor. A Pearson correlation test (GraphPad Prism) was then performed between the Lyso_score and MYC_score. Lyso_score high and low tumors were stratified based on whether a given score for an individual tumor was above or below the median Lyso_score. Statistical analysis was performed using Student t-test.
Statistical analysis
Results are represented as mean ± standard deviation unless otherwise specified and each experiment was repeated at least 3 times. Statistical analysis was performed using GraphPad Prism software (version 9.2.0). The statistical significance between two groups were calculated using unpaired two-tailed student t test. For multiple groups one way ANOVA or two-way ANOVA were used. A P value less than 0.05 was considered significant.
Supplementary Material
Significance.
Reduced c-MYC levels following MAPK pathway suppression facilitates upregulation of autophagy and lysosome biogenesis. Increased autophagy-lysosome activity is required for increased ferritinophagy mediated iron supply, which supports mitochondrial respiration under therapy stress. Disruption of ferritinophagy synergizes with KRAS-MAPK inhibition and blocks PDA growth, thus highlighting a key targetable metabolic dependency.
Acknowledgements
This work was supported by National Cancer Institute Grants R01CA240603, R01CA260249, Damon Runyon Rachleff-Innovator Award, NIH Director’s New Innovator Award DP2CA216364, Shorenstein Fund and the Helen Diller Family Comprehensive Cancer Center and the Ed Marra Passion to Win Fund (to R.M.Perera); National Cancer Institute Grant R37CA230042 (to G. M. DeNicola); Lustgarten Foundation, Dana-Farber Cancer Institute Hale Family Center for Pancreatic Cancer Research, the Doris Duke Charitable Foundation, Pancreatic Cancer Action Network, NIH-NCI K08 CA218420-02 and P50CA127003 (to A. Aguirre).
We thank Hani Goodarzi and Sohit Miglani for advice on ChIP-seq analysis; Suprit Gupta, Grace Hernandez for technical assistance. We thank Lenka Maliskova and Walter L. Eckalbar from the UCSF Genomics Co-Lab for assistance with RNA-Seq and ChIP-seq library preparations.
Disclosures of potential conflicts of interest
J.D.M. is an inventor on a patent pertaining to the autophagic control of iron metabolism. A.J.A. has consulted for Oncorus, Inc., Arrakis Therapeutics, Syros Pharmaceuticals, Mirati Therapeutics, Boehringer Ingelheim, T-knife Therapeutics, and Merck & Co., Inc, and has research funding from Mirati Therapeutics, Syros Pharmaceuticals, Bristol Myers Squibb, Revolution Medicines, Deerfield, Inc., and Novo Ventures that is unrelated to this work.
Data Availability
RNA-sequencing and ChIP-sequencing data is available via the accession code GSE206269; Mass spectrometry data have been deposited in MassIVE with accession code MSV000089676. All other data supporting the findings of this study are available from the corresponding author upon request.
References
- 1.Moore AR, Rosenberg SC, McCormick F, Malek S. RAS-targeted therapies: is the undruggable drugged? Nat Rev Drug Discov 2020;19: 533–52. [DOI] [PMC free article] [PubMed] [Google Scholar]
- 2.Papke B, Der CJ. Drugging RAS: Know the enemy. Science 2017;355: 1158–63. [DOI] [PubMed] [Google Scholar]
- 3.Collins MA, Bednar F, Zhang Y, Brisset JC, Galban S, Galban CJ, et al. Oncogenic Kras is required for both the initiation and maintenance of pancreatic cancer in mice. J Clin Invest 2012;122: 639–53. [DOI] [PMC free article] [PubMed] [Google Scholar]
- 4.Collisson EA, Trejo CL, Silva JM, Gu S, Korkola JE, Heiser LM, et al. A central role for RAF-->MEK-->ERK signaling in the genesis of pancreatic ductal adenocarcinoma. Cancer Discov 2012;2: 685–93. [DOI] [PMC free article] [PubMed] [Google Scholar]
- 5.Ying H, Kimmelman AC, Lyssiotis CA, Hua S, Chu GC, Fletcher-Sananikone E, et al. Oncogenic Kras maintains pancreatic tumors through regulation of anabolic glucose metabolism. Cell 2012;149: 656–70. [DOI] [PMC free article] [PubMed] [Google Scholar]
- 6.Kun E, Tsang YTM, Ng CW, Gershenson DM, Wong KK. MEK inhibitor resistance mechanisms and recent developments in combination trials. Cancer Treat Rev 2021;92: 102137. [DOI] [PubMed] [Google Scholar]
- 7.Lito P, Rosen N, Solit DB. Tumor adaptation and resistance to RAF inhibitors. Nat Med 2013;19: 1401–9. [DOI] [PubMed] [Google Scholar]
- 8.Xue JY, Zhao Y, Aronowitz J, Mai TT, Vides A, Qeriqi B, et al. Rapid non-uniform adaptation to conformation-specific KRAS(G12C) inhibition. Nature 2020;577: 421–5. [DOI] [PMC free article] [PubMed] [Google Scholar]
- 9.Kimmelman AC, White E. Autophagy and Tumor Metabolism. Cell Metab 2017;25: 1037–43. [DOI] [PMC free article] [PubMed] [Google Scholar]
- 10.Perera RM, Bardeesy N. Pancreatic Cancer Metabolism: Breaking It Down to Build It Back Up. Cancer Discov 2015;5: 1247–61. [DOI] [PMC free article] [PubMed] [Google Scholar]
- 11.Bryant KL, Stalnecker CA, Zeitouni D, Klomp JE, Peng S, Tikunov AP, et al. Combination of ERK and autophagy inhibition as a treatment approach for pancreatic cancer. Nat Med 2019;25: 628–40. [DOI] [PMC free article] [PubMed] [Google Scholar]
- 12.Kinsey CG, Camolotto SA, Boespflug AM, Guillen KP, Foth M, Truong A, et al. Protective autophagy elicited by RAF-->MEK-->ERK inhibition suggests a treatment strategy for RAS-driven cancers. Nat Med 2019;25: 620–7. [DOI] [PMC free article] [PubMed] [Google Scholar]
- 13.Lee CS, Lee LC, Yuan TL, Chakka S, Fellmann C, Lowe SW, et al. MAP kinase and autophagy pathways cooperate to maintain RAS mutant cancer cell survival. Proc Natl Acad Sci U S A 2019;116: 4508–17. [DOI] [PMC free article] [PubMed] [Google Scholar]
- 14.Mele L, Del Vecchio V, Liccardo D, Prisco C, Schwerdtfeger M, Robinson N, et al. The role of autophagy in resistance to targeted therapies. Cancer Treat Rev 2020;88: 102043. [DOI] [PubMed] [Google Scholar]
- 15.Viale A, Pettazzoni P, Lyssiotis CA, Ying H, Sanchez N, Marchesini M, et al. Oncogene ablation-resistant pancreatic cancer cells depend on mitochondrial function. Nature 2014;514: 628–32. [DOI] [PMC free article] [PubMed] [Google Scholar]
- 16.Perera RM, Stoykova S, Nicolay BN, Ross KN, Fitamant J, Boukhali M, et al. Transcriptional control of autophagy-lysosome function drives pancreatic cancer metabolism. Nature 2015;524: 361–5. [DOI] [PMC free article] [PubMed] [Google Scholar]
- 17.Perera RM, Di Malta C, Ballabio A. MiT/TFE Family of Transcription Factors, Lysosomes, and Cancer. Annu Rev Cancer Biol 2019;3: 203–22. [DOI] [PMC free article] [PubMed] [Google Scholar]
- 18.Martina JA, Diab HI, Lishu L, Jeong AL, Patange S, Raben N, et al. The nutrient-responsive transcription factor TFE3 promotes autophagy, lysosomal biogenesis, and clearance of cellular debris. Sci Signal 2014;7: ra9. [DOI] [PMC free article] [PubMed] [Google Scholar]
- 19.Palmieri M, Impey S, Kang H, di Ronza A, Pelz C, Sardiello M, et al. Characterization of the CLEAR network reveals an integrated control of cellular clearance pathways. Hum Mol Genet 2011;20: 3852–66. [DOI] [PubMed] [Google Scholar]
- 20.Sardiello M, Palmieri M, di Ronza A, Medina DL, Valenza M, Gennarino VA, et al. A gene network regulating lysosomal biogenesis and function. Science 2009;325: 473–7. [DOI] [PubMed] [Google Scholar]
- 21.Settembre C, Di Malta C, Polito VA, Garcia Arencibia M, Vetrini F, Erdin S, et al. TFEB links autophagy to lysosomal biogenesis. Science 2011;332: 1429–33. [DOI] [PMC free article] [PubMed] [Google Scholar]
- 22.Encarnacion-Rosado J, Kimmelman AC. Harnessing metabolic dependencies in pancreatic cancers. Nat Rev Gastroenterol Hepatol 2021;18: 482–92. [DOI] [PMC free article] [PubMed] [Google Scholar]
- 23.Santana-Codina N, Chandhoke AS, Yu Q, Malachowska B, Kuljanin M, Gikandi A, et al. Defining and Targeting Adaptations to Oncogenic KRAS(G12C) Inhibition Using Quantitative Temporal Proteomics. Cell Rep 2020;30: 4584–99 e4. [DOI] [PubMed] [Google Scholar]
- 24.Zeng M, Lu J, Li L, Feru F, Quan C, Gero TW, et al. Potent and Selective Covalent Quinazoline Inhibitors of KRAS G12C. Cell Chem Biol 2017;24: 1005–16 e3. [DOI] [PubMed] [Google Scholar]
- 25.Dang CV. MYC on the path to cancer. Cell 2012;149: 22–35. [DOI] [PMC free article] [PubMed] [Google Scholar]
- 26.Hessmann E, Schneider G, Ellenrieder V, Siveke JT. MYC in pancreatic cancer: novel mechanistic insights and their translation into therapeutic strategies. Oncogene 2016;35: 1609–18. [DOI] [PubMed] [Google Scholar]
- 27.Skoudy A, Hernandez-Munoz I, Navarro P. Pancreatic ductal adenocarcinoma and transcription factors: role of c-Myc. J Gastrointest Cancer 2011;42: 76–84. [DOI] [PubMed] [Google Scholar]
- 28.Lavoie H, Gagnon J, Therrien M. ERK signalling: a master regulator of cell behaviour, life and fate. Nat Rev Mol Cell Biol 2020;21: 607–32. [DOI] [PubMed] [Google Scholar]
- 29.Farrell AS, Sears RC. MYC degradation. Cold Spring Harb Perspect Med 2014;4. [DOI] [PMC free article] [PubMed] [Google Scholar]
- 30.Hayes TK, Neel NF, Hu C, Gautam P, Chenard M, Long B, et al. Long-Term ERK Inhibition in KRAS-Mutant Pancreatic Cancer Is Associated with MYC Degradation and Senescence-like Growth Suppression. Cancer Cell 2016;29: 75–89. [DOI] [PMC free article] [PubMed] [Google Scholar]
- 31.Sears R, Nuckolls F, Haura E, Taya Y, Tamai K, Nevins JR. Multiple Ras-dependent phosphorylation pathways regulate Myc protein stability. Genes Dev 2000;14: 2501–14. [DOI] [PMC free article] [PubMed] [Google Scholar]
- 32.Halazonetis TD, Kandil AN. Determination of the c-MYC DNA-binding site. Proc Natl Acad Sci U S A 1991;88: 6162–6. [DOI] [PMC free article] [PubMed] [Google Scholar]
- 33.Annunziata I, van de Vlekkert D, Wolf E, Finkelstein D, Neale G, Machado E, et al. MYC competes with MiT/TFE in regulating lysosomal biogenesis and autophagy through an epigenetic rheostat. Nat Commun 2019;10: 3623. [DOI] [PMC free article] [PubMed] [Google Scholar]
- 34.Gupta S, Yano J, Mercier V, Htwe HH, Shin HR, Rademaker G, et al. Lysosomal retargeting of Myoferlin mitigates membrane stress to enable pancreatic cancer growth. Nat Cell Biol 2021;23: 232–42. [DOI] [PMC free article] [PubMed] [Google Scholar]
- 35.Plays M, Muller S, Rodriguez R. Chemistry and biology of ferritin. Metallomics 2021;13. [DOI] [PMC free article] [PubMed] [Google Scholar]
- 36.Dowdle WE, Nyfeler B, Nagel J, Elling RA, Liu S, Triantafellow E, et al. Selective VPS34 inhibitor blocks autophagy and uncovers a role for NCOA4 in ferritin degradation and iron homeostasis in vivo. Nat Cell Biol 2014;16: 1069–79. [DOI] [PubMed] [Google Scholar]
- 37.Mancias JD, Wang X, Gygi SP, Harper JW, Kimmelman AC. Quantitative proteomics identifies NCOA4 as the cargo receptor mediating ferritinophagy. Nature 2014;509: 105–9. [DOI] [PMC free article] [PubMed] [Google Scholar]
- 38.Muckenthaler MU, Rivella S, Hentze MW, Galy B. A Red Carpet for Iron Metabolism. Cell 2017;168: 344–61. [DOI] [PMC free article] [PubMed] [Google Scholar]
- 39.Pantopoulos K, Porwal SK, Tartakoff A, Devireddy L. Mechanisms of mammalian iron homeostasis. Biochemistry 2012;51: 5705–24. [DOI] [PMC free article] [PubMed] [Google Scholar]
- 40.Puig S, Ramos-Alonso L, Romero AM, Martinez-Pastor MT. The elemental role of iron in DNA synthesis and repair. Metallomics 2017;9: 1483–500. [DOI] [PubMed] [Google Scholar]
- 41.Dong XP, Cheng X, Mills E, Delling M, Wang F, Kurz T, et al. The type IV mucolipidosis-associated protein TRPML1 is an endolysosomal iron release channel. Nature 2008;455: 992–6. [DOI] [PMC free article] [PubMed] [Google Scholar]
- 42.Touret N, Furuya W, Forbes J, Gros P, Grinstein S. Dynamic traffic through the recycling compartment couples the metal transporter Nramp2 (DMT1) with the transferrin receptor. J Biol Chem 2003;278: 25548–57. [DOI] [PubMed] [Google Scholar]
- 43.Weber RA, Yen FS, Nicholson SPV, Alwaseem H, Bayraktar EC, Alam M, et al. Maintaining Iron Homeostasis Is the Key Role of Lysosomal Acidity for Cell Proliferation. Mol Cell 2020;77: 645–55 e7. [DOI] [PMC free article] [PubMed] [Google Scholar]
- 44.Yambire KF, Rostosky C, Watanabe T, Pacheu-Grau D, Torres-Odio S, Sanchez-Guerrero A, et al. Impaired lysosomal acidification triggers iron deficiency and inflammation in vivo. Elife 2019;8. [DOI] [PMC free article] [PubMed] [Google Scholar]
- 45.Jiang H, Muir RK, Gonciarz RL, Olshen AB, Yeh I, Hann BC, et al. Ferrous iron-activatable drug conjugate achieves potent MAPK blockade in KRAS-driven tumors. J Exp Med 2022;219. [DOI] [PMC free article] [PubMed] [Google Scholar]
- 46.Torti SV, Torti FM. Iron and Cancer: 2020 Vision. Cancer Res 2020;80: 5435–48. [DOI] [PMC free article] [PubMed] [Google Scholar]
- 47.Wu KJ, Polack A, Dalla-Favera R. Coordinated regulation of iron-controlling genes, H-ferritin and IRP2, by c-MYC. Science 1999;283: 676–9. [DOI] [PubMed] [Google Scholar]
- 48.Stehling O, Lill R. The role of mitochondria in cellular iron-sulfur protein biogenesis: mechanisms, connected processes, and diseases. Cold Spring Harb Perspect Biol 2013;5: a011312. [DOI] [PMC free article] [PubMed] [Google Scholar]
- 49.den Brave F, Becker T. Supercomplex formation boosts respiration. EMBO Rep 2020;21: e51830. [DOI] [PMC free article] [PubMed] [Google Scholar]
- 50.Wagner S, Vlachogiannis G, De Haven Brandon A, Valenti M, Box G, Jenkins L, et al. Suppression of interferon gene expression overcomes resistance to MEK inhibition in KRAS-mutant colorectal cancer. Oncogene 2019;38: 1717–33. [DOI] [PMC free article] [PubMed] [Google Scholar]
- 51.Ruscetti M, Leibold J, Bott MJ, Fennell M, Kulick A, Salgado NR, et al. NK cell-mediated cytotoxicity contributes to tumor control by a cytostatic drug combination. Science 2018;362: 1416–22. [DOI] [PMC free article] [PubMed] [Google Scholar]
- 52.Kimmelman AC. Metabolic Dependencies in RAS-Driven Cancers. Clin Cancer Res 2015;21: 1828–34. [DOI] [PMC free article] [PubMed] [Google Scholar]
- 53.Hemesath TJ, Steingrimsson E, McGill G, Hansen MJ, Vaught J, Hodgkinson CA, et al. microphthalmia, a critical factor in melanocyte development, defines a discrete transcription factor family. Genes Dev 1994;8: 2770–80. [DOI] [PubMed] [Google Scholar]
- 54.Stine ZE, Walton ZE, Altman BJ, Hsieh AL, Dang CV. MYC, Metabolism, and Cancer. Cancer Discov 2015;5: 1024–39. [DOI] [PMC free article] [PubMed] [Google Scholar]
- 55.Yun S, Vincelette ND, Yu X, Watson GW, Fernandez MR, Yang C, et al. TFEB links MYC signaling to epigenetic control of myeloid differentiation and acute myeloid leukemia. Blood Cancer Discov 2021;2: 162–85. [DOI] [PMC free article] [PubMed] [Google Scholar]
- 56.Garcia-Prat L, Kaufmann KB, Schneiter F, Voisin V, Murison A, Chen J, et al. TFEB-mediated endolysosomal activity controls human hematopoietic stem cell fate. Cell Stem Cell 2021;28: 1838–50 e10. [DOI] [PubMed] [Google Scholar]
- 57.Das A, Nag S, Mason AB, Barroso MM. Endosome-mitochondria interactions are modulated by iron release from transferrin. J Cell Biol 2016;214: 831–45. [DOI] [PMC free article] [PubMed] [Google Scholar]
- 58.Shin HR, Zoncu R. The Lysosome at the Intersection of Cellular Growth and Destruction. Dev Cell 2020;54: 226–38. [DOI] [PMC free article] [PubMed] [Google Scholar]
- 59.Thelen AM, Zoncu R. Emerging Roles for the Lysosome in Lipid Metabolism. Trends Cell Biol 2017;27: 833–50. [DOI] [PMC free article] [PubMed] [Google Scholar]
- 60.Lim CY, Zoncu R. The lysosome as a command-and-control center for cellular metabolism. J Cell Biol 2016;214: 653–64. [DOI] [PMC free article] [PubMed] [Google Scholar]
- 61.Perera RM, Zoncu R. The Lysosome as a Regulatory Hub. Annu Rev Cell Dev Biol 2016;32: 223–53. [DOI] [PMC free article] [PubMed] [Google Scholar]
- 62.Xu H, Ren D. Lysosomal physiology. Annu Rev Physiol 2015;77: 57–80. [DOI] [PMC free article] [PubMed] [Google Scholar]
- 63.Adams CR, Htwe HH, Marsh T, Wang AL, Montoya ML, Subbaraj L, et al. Transcriptional control of subtype switching ensures adaptation and growth of pancreatic cancer. Elife 2019;8. [DOI] [PMC free article] [PubMed] [Google Scholar]
- 64.Lim CY, Davis OB, Shin HR, Zhang J, Berdan CA, Jiang X, et al. ER-lysosome contacts enable cholesterol sensing by mTORC1 and drive aberrant growth signalling in Niemann-Pick type C. Nat Cell Biol 2019;21: 1206–18. [DOI] [PMC free article] [PubMed] [Google Scholar]
- 65.Dobin A, Davis CA, Schlesinger F, Drenkow J, Zaleski C, Jha S, et al. STAR: ultrafast universal RNA-seq aligner. Bioinformatics 2013;29: 15–21. [DOI] [PMC free article] [PubMed] [Google Scholar]
- 66.Love MI, Huber W, Anders S. Moderated estimation of fold change and dispersion for RNA-seq data with DESeq2. Genome Biol 2014;15: 550. [DOI] [PMC free article] [PubMed] [Google Scholar]
- 67.Subramanian A, Tamayo P, Mootha VK, Mukherjee S, Ebert BL, Gillette MA, et al. Gene set enrichment analysis: a knowledge-based approach for interpreting genome-wide expression profiles. Proc Natl Acad Sci U S A 2005;102: 15545–50. [DOI] [PMC free article] [PubMed] [Google Scholar]
- 68.Frankish A, Diekhans M, Jungreis I, Lagarde J, Loveland JE, Mudge JM, et al. Gencode 2021. Nucleic Acids Res 2021;49: D916–D23. [DOI] [PMC free article] [PubMed] [Google Scholar]
- 69.Ramirez F, Ryan DP, Gruning B, Bhardwaj V, Kilpert F, Richter AS, et al. deepTools2: a next generation web server for deep-sequencing data analysis. Nucleic Acids Res 2016;44: W160–5. [DOI] [PMC free article] [PubMed] [Google Scholar]
- 70.Kent WJ, Sugnet CW, Furey TS, Roskin KM, Pringle TH, Zahler AM, et al. The human genome browser at UCSC. Genome Res 2002;12: 996–1006. [DOI] [PMC free article] [PubMed] [Google Scholar]
- 71.McAlister GC, Nusinow DP, Jedrychowski MP, Wuhr M, Huttlin EL, Erickson BK, et al. MultiNotch MS3 enables accurate, sensitive, and multiplexed detection of differential expression across cancer cell line proteomes. Anal Chem 2014;86: 7150–8. [DOI] [PMC free article] [PubMed] [Google Scholar]
- 72.Schweppe DK, Eng JK, Yu Q, Bailey D, Rad R, Navarrete-Perea J, et al. Full-Featured, Real-Time Database Searching Platform Enables Fast and Accurate Multiplexed Quantitative Proteomics. J Proteome Res 2020;19: 2026–34. [DOI] [PMC free article] [PubMed] [Google Scholar]
- 73.Eng JK, Hoopmann MR, Jahan TA, Egertson JD, Noble WS, MacCoss MJ. A deeper look into Comet--implementation and features. J Am Soc Mass Spectrom 2015;26: 1865–74. [DOI] [PMC free article] [PubMed] [Google Scholar]
- 74.Huttlin EL, Jedrychowski MP, Elias JE, Goswami T, Rad R, Beausoleil SA, et al. A tissue-specific atlas of mouse protein phosphorylation and expression. Cell 2010;143: 1174–89. [DOI] [PMC free article] [PubMed] [Google Scholar]
- 75.Acin-Perez R, Benador IY, Petcherski A, Veliova M, Benavides GA, Lagarrigue S, et al. A novel approach to measure mitochondrial respiration in frozen biological samples. EMBO J 2020;39: e104073. [DOI] [PMC free article] [PubMed] [Google Scholar]
- 76.Salabei JK, Gibb AA, Hill BG. Comprehensive measurement of respiratory activity in permeabilized cells using extracellular flux analysis. Nat Protoc 2014;9: 421–38. [DOI] [PMC free article] [PubMed] [Google Scholar]
- 77.Tiriac H, Bucobo JC, Tzimas D, Grewel S, Lacomb JF, Rowehl LM, et al. Successful creation of pancreatic cancer organoids by means of EUS-guided fine-needle biopsy sampling for personalized cancer treatment. Gastrointest Endosc 2018;87: 1474–80. [DOI] [PMC free article] [PubMed] [Google Scholar]
Associated Data
This section collects any data citations, data availability statements, or supplementary materials included in this article.
Supplementary Materials
Data Availability Statement
RNA-sequencing and ChIP-sequencing data is available via the accession code GSE206269; Mass spectrometry data have been deposited in MassIVE with accession code MSV000089676. All other data supporting the findings of this study are available from the corresponding author upon request.