

Abstract
From the 1950s to the 1970s, three Superfund sites discharged polychlorinated biphenyl (PCB)-contaminated waste upstream of the Mohawk Nation at Akwesasne, resulting in PCB contamination of groundwater, soil, and sediment in the surrounding area. Given the persistence of PCBs in the environment and in human tissues, there are continued concerns regarding PCB exposures and the potential for adverse health effects in the community. We developed an evidence map of PCB research at Akwesasne in order to characterize the available data and to highlight potential research needs. Human health and exposure biomarker studies were identified from a literature search based on population, exposure, comparator, and outcome (PECO) criteria. Data extracted from references that met the inclusion criteria after full-text review included study characteristics (e.g., sample size, study design, sampling years), details on PCB measurements (e.g., analytical method, number of congeners analyzed, method detection limits), and results (e.g., PCB levels and summary of study conclusions). We identified 33 studies, conducted between 1986 and 2013, that examined PCB exposure characteristics and health effects in residents of the Akwesasne Mohawk Nation. Organizing this literature into an evidence map including information on study cohort, congener groupings, exposure biomarker characteristics, and health effects allowed us to identify research gaps and to suggest future research priorities for the community. We identified current PCB exposure levels and PCB source characterization as major uncertainties, both of which could be addressed by new studies of PCB concentrations in environmental media.
Graphical Abstract

Introduction
Polychlorinated biphenyls (PCBs) are a group of 209 organic chlorinated hydrocarbons that were manufactured worldwide for use in industrial and commercial applications, such as in plasticizers and electrical and hydraulic equipment (ATSDR 2000). Due to their environmental persistence, potential for bioaccumulation, and evidence of adverse health effects, the commercial manufacture of PCBs was banned in the United States in 1979 under the Toxic Substances Control Act (40 CFR 761). Despite the replacement of most PCB-containing products, PCBs continue to be detected in samples of human blood and breastmilk in the general population, where the primary routes of exposure are diet, particularly consumption of fish, meat, and dairy products, and inhalation (Ampleman et al. 2015; Weitekamp et al. 2021). Due to environmental inequities and traditional cultural practices (such as the importance of local fish and game in the diet), many indigenous American populations carry a disproportionate burden of exposure to PCBs (Hoover et al. 2012; NEJAC 2002).
The Mohawk Nation at Akwesasne was founded along the St. Lawrence River in the mid-1700s and contains land in both New York state (recognized as the Saint Regis Mohawk Tribe) and in the Canadian provinces of Ontario and Quebec (Saint Regis Mohawk Tribe 2021). In the 1950s, construction of the St. Lawrence Seaway and the Moses-Saunders Power Dam brought the development of large industry to the area (Schell et al. 2005). At three industrial locations, classified as Superfund Sites since the 1980s, aluminum foundries (which are no longer active) used PCBs as a component of the hydraulic fluids in the die-casting process (U.S. EPA 2021a, b, c). The handling and on-site disposal of these PCB-containing fluids led to PCB contamination of groundwater, soil, and sediment in the surrounding area (U.S. EPA 2020). Elevated levels of PCBs were detected in local fish and wildlife, leading the Saint Regis Mohawk Environmental Health Department to issue advisories against their consumption beginning in 1986 (Fitzgerald et al. 1995; Saint Regis Mohawk Tribe 2019). Superfund site investigation and remediation efforts under both Federal and State jurisdiction have been ongoing since 1987 (ATSDR 2007). However, due to the persistence of PCBs in the environment and in human tissues, there are continued concerns regarding PCB exposures and the potential for adverse health effects in the community.
Here, to characterize the available data and to highlight potential research needs for this community, we developed an evidence map of PCB research at Akwesasne. Evidence maps employ systematic review methods and tools to create a database of research featuring broad characteristics of the evidence base (e.g., types of outcomes evaluated, study designs utilized, other study characteristics) (Wolffe et al. 2019). This information is extracted from each study and compiled into a format that facilitates the identification of knowledge gaps to direct future research, as well as knowledge clusters, which are subsets of evidence useful for addressing secondary research questions (James et al. 2016). While evidence maps can set the stage for future systematic analyses, unlike systematic reviews, they often do not include critical appraisal of each study, synthesis of the evidence across studies, or conclusions about the causality of associations between exposure and health effects (Wolffe et al. 2019). This evidence map characterizes the body of studies that have examined measures of PCB exposure alone or in relation to health outcomes in members of the Akwesasne Mohawk Nation.
Methods
Literature search strategy
The PCB literature database is publicly available in the U.S. Environmental Protection Agency’s (EPA’s) Health and Environmental Research Online (HERO) database. HERO was developed by EPA to hold references identified in the process of developing EPA’s risk assessments (https://hero.epa.gov/hero/index.cfm/project/page/project_id/384). Briefly, PubMed and Web of Science were searched for terms describing PCB mixtures and individual congeners as well as terms to identify population studies that were not indexed by chemical name (e.g., “capacitor manufacturing workers”, “Yu-Cheng”, “New York State Angler Cohort”; Supplemental Material). The search included references published on or before August 31, 2021. The terms “Akwesasne” and “Mohawk” were used to narrow the results of the preliminary search to references most likely to include exposure or health outcome data collected from the Mohawk population at Akwesasne. The list of identified studies was exported to Excel for screening-level review. In addition, reference lists of included studies were examined for any relevant studies not captured by the original search.
Literature review and data extraction
To guide screening and full-text review for exposure biomarker and health outcome studies, we developed and utilized the following PECO criteria (Morgan et al. 2018):
Population (P) – Residents of the Mohawk Nation at Akwesasne (Ontario and Quebec, Canada and New York, US) with exposure to PCBs at any lifestage.
-
Exposure (E) – Exposure biomarker studies: Any exposure to PCBs as determined by measures of exposure in biological tissues (e.g., serum PCB levels).
Health outcome studies: Any exposure to PCBs as determined by controlled exposure studies, or observational studies of PCB exposure (occupational or non-occupational) with PCBs measured in contact medium (e.g., food, air, dust), or biomarkers of exposure in biological tissues (e.g., serum PCB levels).
Comparator (C) – A comparison or referent population exposed to lower levels (or no exposure/exposure below detection limits) of PCBs or exposure to PCBs for shorter time periods.
-
Outcome (O) – Exposure biomarker studies: Any examination of a biomarker of exposure.
Health outcome studies: Any examination of a health effect.
References that did not meet the PECO criteria or that were identified as abstracts only or secondary data were excluded during the screening stage. References were first evaluated for relevance by one reviewer (CW) at the title and abstract level. Those that met the PECO criteria or were ambiguous at the title/abstract level underwent full-text review by two reviewers (CW, RS, CC, KC). Data extracted from the final list of references that met the inclusion criteria after full-text review included study characteristics (e.g., sample size, study design, sampling years), details on PCB measurements (e.g., analytical method, number of congeners analyzed, method detection limits), and results (e.g., PCB levels and summary of study conclusions). Data were extracted by an initial reviewer (CW, RS, CC, KC) and were then checked by a second independent reviewer (CW, RS, CC, KC).
Results
For title and abstract screening, we identified 78 references in the publicly available HERO PCB project page (https://hero.epa.gov/hero/index.cfm/project/page/project_id/384) and three from the reference lists of multiple included studies (Figure 1). Of these 81 references, 43 were moved forward to full-text review. At full-text review, 10 of these studies were found not to meet the PECO criteria. The primary reasons for exclusion at both the title/abstract and full-text screening levels were that the reference reported only secondary data (n = 16), was limited to a conference abstract (n = 10) or did not include an outcome in residents of the Akwesasne Mohawk Nation (n = 10). Among the 33 included studies, there were 14 that examined PCB biomarkers as indices of exposure and 19 that related PCB exposures to health outcomes.
Figure 1. Literature search and screening flow diagram.
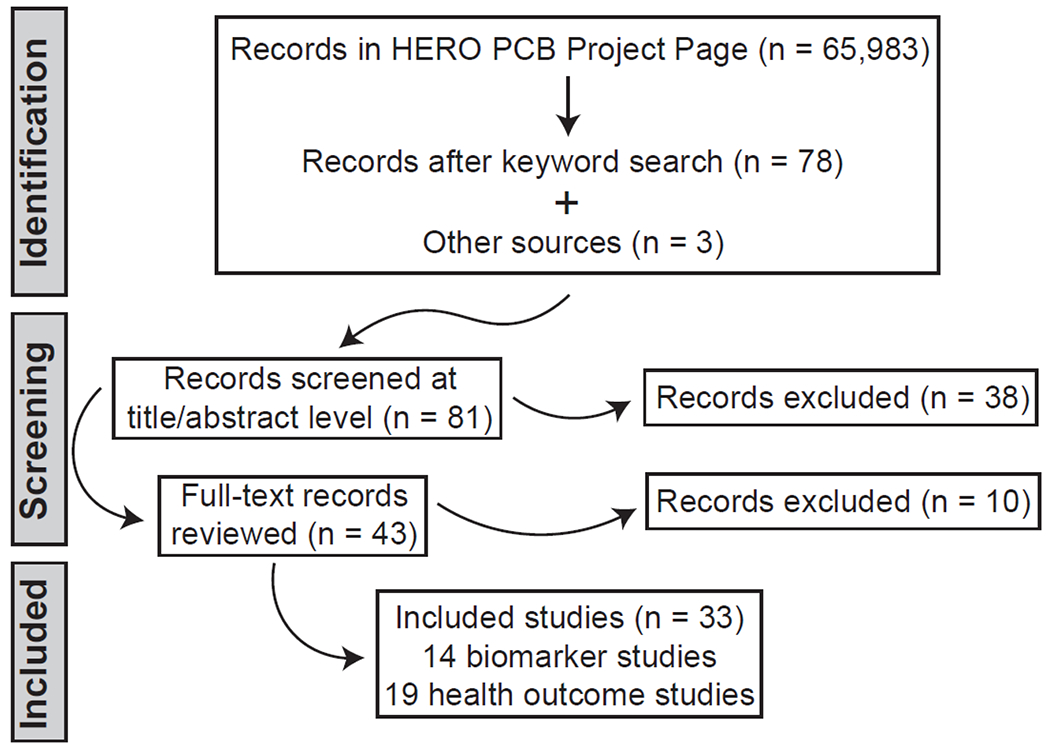
Other sources include reference lists from included studies. HERO = Health and Environmental Research Online. HERO PCB Project Page: https://hero.epa.gov/hero/index.cfm/project/page/project_id/384.
Study cohorts
The majority of the included studies utilized a partnership approach between the Akwesasne Mohawk Nation and academic scientists (as described by Schell et al. 2005). In these studies, a panel of Akwesasne community representatives was assembled to define the target population (Schell et al. 2003). This target population consisted of residents within the boundaries of the Akwesasne Mohawk Nation and residents of Mohawk households in neighboring communities within 10 miles of the Mohawk Nation border. From the included studies, we determined that there were seven primary cohorts of Akwesasne residents who participated in sampling, which took place between 1986 and 2013 (Table 1; Figure 2). The same residents may have participated in more than one of these cohorts. The first cohort included breastfeeding mothers who gave birth between 1986 and 1992. This was followed by the Mohawk Mothers and Infants Study of a cohort of women who became pregnant between 1992 and 1995. In a parallel study, adult men who were husbands or close relatives of women in the Mohawk Mothers and Infants Study were included as a separate study group (Mohawk Men Study). Between 1995 and 2000, studies in the adult Mohawk cohort were conducted, consisting of adults who resided at Akwesasne for at least five years. For the Mohawk Adolescent Well-Being Study (MAWBS), also conducted between 1995 and 2000, each mother/youth pair had to reside in the same household, and the youth could not be a twin, have a serious psychologic impairment or physical condition, or have been diagnosed with fetal alcohol effects. One child per household was eligible to participate. The Young Adult Well-Being Study (YAWBS) was a follow up study conducted between 2000 and 2005 and consisted of young adults who had participated in the MAWBS. Finally, the most recent cohort consisted of Mohawk women recruited between 2009 and 2013. To be eligible, women could not be taking hormonal birth control or thyroid medication and could not be pregnant or nursing.
Table 1.
Characteristics and summary values for the primary study populations at Akwesasne.
| Study Population | Breastfeeding mothers | Mothers and infants | Mohawk men | Adult Mohawk | MAWBS | YAWBS | Mohawk women | |
|---|---|---|---|---|---|---|---|---|
| Sampling years | 1986-1992 | 1992-1995 | 1992-1995 | 1995-2000 | 1995-2000 | 2000-2005 | 2009-2013 | |
| Sample size* | 97 women | 111 women | 139 men | 753 (264 men, 489 women) | 271 (131 males, 140 females) | 152 (61 males, 91 females) | 169 women | |
| Mean age (range) | 24.85 (NR) | 25.9 (NR) | 36.7 (15-77) | NR (18-95) | 13.2 (10-16.9) | 18.1 (17-20) | 30.3 (21-38) | |
| Exposure metric | Breastmilk | Serum | Serum | Serum | Serum | Serum | Serum | |
| Number of exposure biomarker studies | 3 | 2 | 4 | 1 | 2 | 2 | 0 | |
| Number of health outcome studies | 0 | 0 | 0 | 7 | 7 | 2 | 2 | |
| Total number of congeners analyzed | 68 | 68 | 68 | 101 | 101 | 101 | 101 | |
| ΣTotal, wet-weight (ppb) | Arithmetic mean | NR | 1.8 | 4.39 | 4.9 | 1.71 | 0.876 | NR |
| Geometric mean | 336 (fat basis) | 1.2 | NR | 2.8 | 1.62 | 0.824 | NR | |
| Median | 339 (fat basis) | 1.2 | 3.18 | 3.2 | NR | NR | NR | |
| SD | 26 (SE; fat basis) | 1.6 | 4.18 | 5.6 | 0.641 | 0.4205 | NR | |
| Σ50%, wet-weight (ppb) | Arithmetic mean | NR | NR | NR | NR | 0.72 | 0.474 | NR |
| Geometric mean | NR | NR | 0.64 | NR | 0.65 | 0.433 | 0.64 | |
| Median | NR | NR | 0.63 | NR | NR | NR | 0.63 | |
| SD | NR | NR | 0.394 | NR | 0.372 | 0.2640 | 0.394 | |
| Median congener specific MDL (ppb) (range) | 8 (fat basis) | 0.02 (0.01-0.1) | 0.02 (0.01-0.1) | (0.01-0.04) | (0.01-0.02) | (0.002-0.024) | NR | |
| Approach to values below MDL | Values between instrument detection limit of 0.001 ppb and MDL were included in analyses. | Values below MDL were included in analyses. | Values below MDL were included in analyses. | Values below MDL replaced with zero. | Values below MDL replaced with midpoint value between zero and the MDL of each congener. | Values below MDL replaced with midpoint value between zero and the MDL of each congener. | If the proportion of results below MDL <40%, levels below MDL replaced with value equal to MDL divided by the square root of 2. | |
| References for summary values | (Fitzgerald et al. 1995; Fitzgerald et al. 1998) | (Fitzgerald et al. 2004) | (Fitzgerald et al. 1999) | (DeCaprio et al. 2005) | (Gallo et al. 2015; Schell et al. 2003) | (Gallo et al. 2011) | (Gallo et al. 2016; Gallo et al. 2018) | |
| Exposure biomarker studies | (Fitzgerald et al. 1998; Hong et al. 1994; Hwang et al. 2001) | (Fitzgerald et al. 2004; Fitzgerald et al. 2005) | (Fitzgerald et al. 1996; Fitzgerald et al. 2005; Fitzgerald et al. 2007; Hwang et al. 1999) | (DeCaprio et al. 2000; DeCaprio et al. 2005) | (Ravenscroft et al. 2018; Schell et al. 2003) | (Gallo et al. 2011; Gallo et al. 2015) | NA | |
| Health outcome studies | NA | NA | NA | (Aminov et al. 2016; Aminov and Carpenter 2020; Bella and Carpenter 2021; Codru et al. 2007; Goncharov et al. 2008; Goncharov et al. 2009; Santiago-Rivera et al. 2007) | (Denham 2005; Newman et al. 2006; Newman et al. 2009; Newman et al. 2014; Schell et al. 2004; Schell et al. 2008; Schell et al. 2014) | (Behforooz et al. 2017; Schell et al. 2009) | (Gallo et al. 2016; Gallo et al. 2018) | |
MAWBS = Mohawk Adolescent Well-Being Study; YAWBS = Young Adult Well-Being Study; Σ50% = sum limited to congeners measured in 50% or more of samples; MDL = method detection limit; SD = standard deviation; SE = standard error; NR = not reported; NA = not applicable.
Sample size refers to primary cohorts; some studies assessed subsets of participants
Figure 2. The number of exposure biomarker only or exposure biomarker and health outcome studies conducted within each cohort of Akwesasne residents.
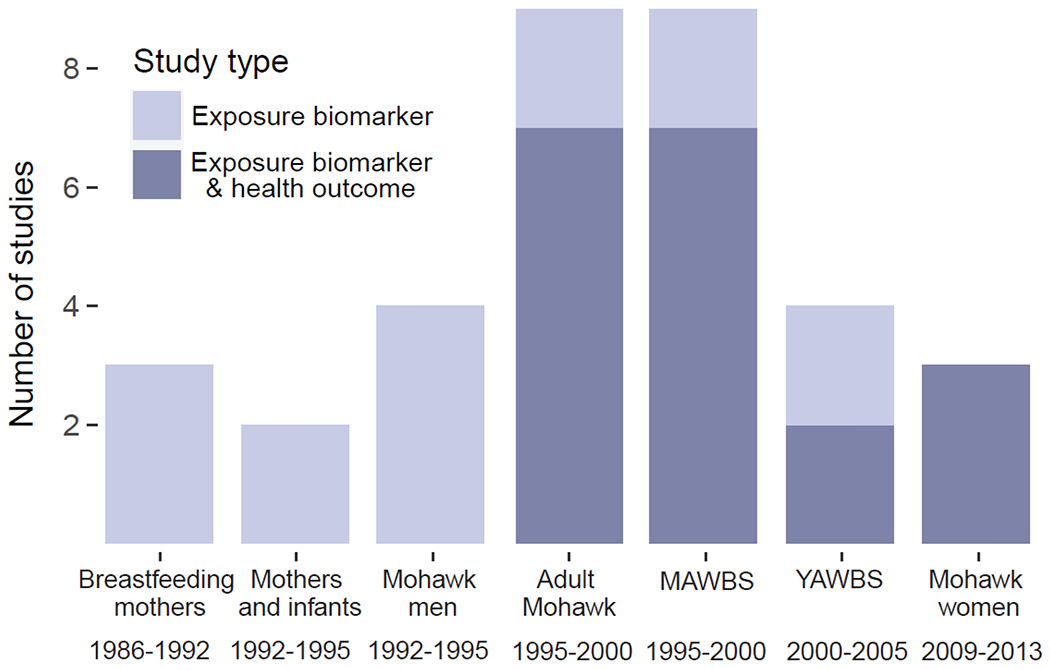
MAWBS = Mohawk Adolescent Well-Being Study; YAWBS = Young Adult Well-Being Study
PCB congeners
The earlier studies (including breastfeeding mothers, mothers and infants, and Mohawk men) analyzed 68 PCB congeners, while the later studies analyzed 101 congeners. All studies used gas chromatography-electron capture detection to measure levels of individual PCB congeners. Individual congener level analysis is advantageous for the research presented in these studies because it allows for more accurate measurement of the composition of weathered, degraded, and metabolized PCB mixtures (Erickson 2017). Values below the method detection limit (MDL) were approached in different ways across studies. Common approaches included utilizing machine-read values below MDL with no manipulation, or replacing values below MDL with a set value (zero, MDL/2, or MDL/√2).
The resulting measured levels of PCB congeners were grouped in a variety of ways for analysis; importantly, across studies, groups with the same name did not always contain the same specific congeners. In our reporting, we use the terminology employed by the authors of each study. The most frequently reported congener groupings were a sum of the total number of measured congeners (ΣTotal, 20 studies) or a sum of the congeners that were detected in 50% or more of individuals (Σ50%, 9 studies). In some studies, authors classified certain congeners based on their presumed persistence in the body (e.g., Σ“Persistent”, 10 studies or Σ“Non-”/“Low-persistent”, 8 studies). Other classifications were based on structure or activity. Based on their mode of action, 12 congeners are considered dioxin-like because they interact with the aryl-hydrocarbon receptor. The sum of these congeners (ΣDioxin-like) was assessed in four studies. For the dioxin-like congeners, toxic equivalency values (TEQs), weighted measures of relative toxicity, can be calculated as one approach to quantify the potential for adverse health effects (U.S. EPA 2010). Other groupings were characterized by the number of ortho-substituted chlorines (ΣMonoOrtho, 6 studies; ΣDiOrtho, 7 studies; ΣTriTetraOrtho, 7 studies), by estrogenic activity (4 studies), or by potential for enzyme induction (2 studies). As an example of the variation in the specific congeners included in each grouping, we show the congeners grouped as Σ“Persistent” in Table 2. For other groupings, the specific congeners included are provided in Tables 3–7 and shown by grouping in Supplemental Tables S1–S8. In Supplemental Table S9, we illustrate the frequency with which each congener was used within groupings employed in 3 or more studies.
Table 2.
Congeners analyzed as Σ“Persistent” as reported by study authors.
| Congener | |||||||||||
|---|---|---|---|---|---|---|---|---|---|---|---|
| 28 | * | * | * | ||||||||
| 74 | * | * | * | * | * | * | * | * | * | * | |
| 99 | * | * | * | * | * | * | * | * | * | * | |
| 105 | * | * | * | * | * | * | * | * | * | * | |
| 118 | * | * | * | * | * | * | * | * | * | * | * |
| 138 | * | ||||||||||
| 138+163+164 | * | * | * | * | * | * | * | * | * | * | |
| 153 | * | * | * | * | * | * | * | * | * | * | * |
| 170 | * | ||||||||||
| 180 | * | * | * | * | * | * | * | * | * | * | * |
| 183 | * | ||||||||||
| 187 | * | * | * | * | * | * | * | * | * | * | * |
| (Ravenscroft et al. 2018) | (Gallo et al. 2015) | (Gallo et al. 2011) | (Newman et al. 2009) | (Newman et al. 2014) | (Behforooz et al. 2017) | (Schell et al. 2004)# | (Schell et al. 2004)# | (Schell et al. 2008) | (Schell et al. 2009) | (Schell et al. 2014) | |
Grey shaded cells with asterisk indicate congener was included in the grouping for each study.
Two different approaches were applied toward values below the MDL resulting in groupings with different congeners.
Table 3.
Summary values and characteristics of exposure studies.
| Study population (sampling date; sample size) | Comparison to referent group | Metric (co-variates) | Congener groupings | Number of congeners/coelutions quantified (IUPAC numbers); number of congeners analyzed | Arithmetic mean, wet-weight (ppb) | Geometric mean, wet-weight (ppb) | SD (ppb) | Summary of results | Reference |
|---|---|---|---|---|---|---|---|---|---|
| Breastfeeding mothers (1986-1992; n = 97 Mohawk women, 154 referent women) | Yes | Breastmilk (dietary assessment) | ΣTotal1 | 9 (60+55, 99, 118, 138, 153, 171+156, 176+163, 180, 199); 68 | NR | Fat basis: Mohawk = 336; Referent = 372 | SE: Mohawk = 26; Referent = 22 | No difference vs referent group for total PCBs in breastmilk. When binned by birth year, Mohawk mothers who delivered in 1986-1989 had total PCB levels ~50% higher than controls. | (ATSDR 1995; Fitzgerald et al. 1998) |
| Breastfeeding mothers (1986-1992; n = 97 Mohawk women, 154 referent women) | Yes | Breastmilk (fish exposure assessment) | Individual congeners above MDL included | 17 (19, 60+56, 94+74, 97, 99, 118, 134, 138, 146, 153+132, 176+163, 171+156, 172, 180, 200, 199, 206); 68 | NR | NR | NR | Mohawk women who consumed the most local fish had a congener pattern that more closely resembled local fish than Mohawk women who ate less fish or the referent women. | (Hwang et al. 2001) |
| Breastfeeding mothers (1988-1990; n = 20 Mohawk women, 30 referent women) | Yes | Breastmilk | ΣTotal2 | 12 (15, 77, 81, 114, 118, 123, 126, 156, 157, 167, 169, 189); 68 | Fat basis: Mohawk = 49; Referent = 55 | NR | NR | No difference vs referent group for total PCB levels in breastmilk. | (Hong et al. 1994) |
| Mohawk men (1992-1995; n = 139 men) | No | Blood (dietary assessment) | ΣTotal1 | NR (NR); 68 | 4.9 | 2.8 | 5.6 | Age, fish consumption, and never being married positively associated with total PCB levels. | (Fitzgerald et al. 1999) |
| Mohawk men (1992-1995; n = 93 men) | No | Blood (dietary assessment, soil, tap water, sediment, produce, air, caffeine breath test) | ΣTotal3 | NR (NR); 68 | 5.4 | 3.3 | NR | Age, occupation, and fish consumption identified as risk factors for elevated serum PCB levels. In general, environmental data within background ranges for upstate New York. | (Fitzgerald et al. 1996) |
| Mohawk men (1992-1995; n = 139 men) | No | Blood (dietary assessment) | ΣTotal1 | NR (NR); 68 | 4.9 | 2.8 | 5.6 | PCB concentrations associated with cumulative lifetime exposure from local fish consumption; also associated with occupation, age, and inversely with marital status; no association with residential location. | (Fitzgerald et al. 2007) |
| Mohawk mothers and infants (1992-1995; n = 111 pregnant women) | No | Blood (dietary assessment, soil, air, meat, produce) | ΣTotal1 | 7 (74, 99, 118, 138, 153, 180, 187+181); 68 | 1.8 | 1.2 | 1.6 | Controlling for age, lifetime exposure from local fish consumption marginally associated with total PCB levels; no association with soil exposure, living at Raquette Point for past 10 years, or ever having eaten local meat, wild duck, or produce from Raquette Point. | (Fitzgerald et al. 2004) |
| Mohawk mothers and infants; Mohawk men (1992-1995; n = 103 adults, 63 men, 40 women) | No | Blood (caffeine breath test) | ΣTotal1 | NR (NR); 68 | 2.808 | NR | 0.293 (SE) | Positive association between sum of nine mono- or di-ortho-substituted PCB congeners and caffeine breath test values (metric of CYP1A2 activity); levels of congeners 153, 170, and 180 positively associated with caffeine breath test values. | (Fitzgerald et al. 2005) |
| ΣMonoDiOrtho1 | 9 (105, 118, 138, 153, 158, 167, 170, 180, 194) | 1.415 | NR | 0.164 (SE) | |||||
| MAWBS (1995-2000; n = 271 youth) | Yes | Blood (maternal dietary assessment) | ΣTotal4 | 84 (4+2, 7, 8, 9, 10, 13, 15, 17, 18, 19, 22, 24+27, 25, 26, 28, 29, 31, 32+16, 33, 40, 42, 44, 45, 46, 47+59, 49, 51, 52, 53, 56, 64, 66, 70, 71, 74, 77, 83, 84, 87, 91, 92, 95, 99, 101+90, 105, 109+147, 110, 114, 118, 128, 129, 130, 132, 134, 136, 137, 138+163+164, 141, 144, 146, 149+123, 151, 153, 156, 158, 170, 171, 172, 174, 176, 177, 179, 180, 183, 187, 190, 194, 195, 196, 199, 200, 201, 203, 206); 101 | 1.71 | 1.62 | 0.641 | Overall, total PCBs for Mohawk youth lower than published studies of similar-age cohorts; relatively high detection rates of shorter-lived congeners suggested ongoing source of exposure. | (Schell et al. 2003) |
| Σ50%5 | 16 (52, 70, 74, 84, 87, 95, 99, 101+90, 105, 110, 118, 138+163+164, 149+123, 153, 180, 187) | 0.72 | 0.65 | 0.372 | |||||
| Σ75%5 | 10 (52, 74, 95, 99, 101+90, 110, 118, 138+163+164, 153, 180) | 0.57 | 0.51 | 0.308 | |||||
| Σ“Persistent”5 | 8 (74, 99, 105, 118, 138+163+164, 153, 180, 187) | 0.43 | 0.38 | 0.259 | |||||
| MAWBS (1995-2000; 246 youth) | No | Blood (maternal dietary assessment) | ΣTotal5 | NR (NR); 101 | 1.13 | NR | 0.73 | Principal component analysis identified four PCB congener profiles. Diet, age, sex, prior breastfeeding, and BMI predicted one or more of three of the profiles. The “1248-like” pattern was not related to other typical PCB determinants, suggesting an alternative source/exposure (potentially airborne exposure pathway). | (Ravenscroft et al. 2018) |
| Σ“Persistent”5 | 8 (74, 99, 105, 118, 138+163+164, 153, 180, 187) | 0.44 | NR | 0.22 | |||||
| Σ“Non-persistent”5 | 6 (52, 84, 95, 101+90, 110, 149+123) | 0.23 | NR | 0.19 | |||||
| “1248-like” 5 | 9 (52, 70, 84, 87, 90+101, 95, 110, 99123+149) | NR | NR | NR | |||||
| “Persistent, 1260-like” 5 | 4 (74, 180, 153, 187) | NR | NR | NR | |||||
| “Mono-ortho” 5 | 2 (105, 118) | NR | NR | NR | |||||
| “1254-like” 5 | 4 (99, 110, 153, 164+138) | NR | NR | NR | |||||
| Adult Mohawk (NR; n = 282) | No | Blood | ΣTotal2 | 45 (18, 28, 31, 44, 47+59, 52, 56, 66, 70, 74, 84, 87, 90+101, 92 95, 99, 105, 110, 114, 118, 123+149, 128, 130, 137, 141, 146, 151, 153, 156, 158, 164+163+138, 170, 172, 174, 177, 180, 183, 187, 190, 194, 196, 199, 201, 203, 206); 101 | NR | NR | NR | Preliminary assessment for Adult Mohawk cohort reported in DeCaprio et al. 2005; median total PCBs = 3.63 ppb. | (DeCaprio et al. 2000) |
| Adult Mohawk (1998-2000; n = 753 adults, 264 men, 489 women) | No | Blood | ΣTotal2 | 39 (28, 44, 47+59, 52, 66, 70, 74, 84, 87, 90+101, 95, 99, 105, 110, 114, 118, 123+149, 138+164+163, 130, 137, 146, 151, 153, 156, 158, 170, 172, 174, 177, 180, 183, 187, 190, 194, 195, 196, 199, 201, 203, 206); 101 | 4.39 | NR | 4.18 | PCB profile “consistent with a combination of an age-dependent accumulation of persistent congeners and of ongoing background ambient environmental and/or dietary exposure.” | (DeCaprio et al. 2005) |
| YAWBS (2000-2005; 151 young adults) | No | Blood (dietary assessment) | Σ50%4 | 16 (52, 70, 74, 84, 87, 95, 99, 101+90, 105, 110, 118, 149+123, 138+163+164, 153, 180, 187) | 0.50 | 0.46 | 0.287 | Levels of all congener groupings decreased from sampling in MAWBS to YAWBS. | (Gallo et al. 2015) |
| Σ“Persistent”4 | 8 (74, 99, 105, 118, 138+163+164, 153, 180, 187) | 0.35 | 0.31 | 0.228 | |||||
| Σ“Non-persistent”4 | 6 (52, 84, 95, 101+90, 110, 149+123) | 0.12 | 0.11 | 0.082 | |||||
| YAWBS (2000-2005; 152 young adults) | Yes | Blood (dietary assessment) | ΣTotal4 | NR (NR); 101 | 0.876 | 0.824 | 0.4205 | Compared to CDC cohort data, Akwesasne young adults had higher levels of 12 out of 13 congeners. | (Gallo et al. 2011) |
| Σ50%4 | 14 (28, 52, 74, 87, 95, 99, 101+90, 105, 110, 118, 138+163+164, 153, 180, 187) | 0.474 | 0.433 | 0.2640 | |||||
| Σ“Persistent”4 | 9 (28, 74, 99, 105, 118, 138+163+164, 153, 180, 187) | 0.357 | 0.316 | 0.2291 | |||||
| Σ“Non-persistent”4 | 5 (52, 87, 95, 101+90, 110) | 0.117 | 0.106 | 0.0598 |
Included;
Replaced with zero;
NR;
MDL/2;
Imputed with Cohen’s method
MAWBS = Mohawk Adolescent Well-Being Study; YAWBS = Young Adult Well-Being Study; ΣX% = sum limited to congeners measured in X% or more of samples; MDL = method detection limit; NR = not reported; SD = standard deviation; SE = standard error;
Superscripts denote approach applied toward values below MDL
Table 7.
Summary values and reproductive health outcomes associated with serum PCB levels.
| Study population | Outcome(s) measured | Congener groupings used in analysis | Congener IUPAC numbers | Arithmetic mean, wet-weight (ppb) | Geometric mean, wet-weight (ppb) | SD (ppb) | Statistically significant outcome(s): test statistic [95% CI] (p-value) | Summary of outcome(s) observed in relation to serum PCB levels | Reference |
|---|---|---|---|---|---|---|---|---|---|
| MAWBS (1995-2000, n = 138) | Age at menarche | Σ“Estrogenic”50%1 | 52, 70, 101+90, 187 | 0.12 | NR | 0.083 | β = 2.13 (0.04) | Σ“Estrogenic” associated with higher likelihood of having reached menarche | (Denham 2005) |
| Σ“Anti-estrogenic”50%1 (Dioxin-like) | 74, 105, 118, 138+163+164 | NR | NR | NR | NS | ||||
| Σ“Enzyme-inducing”50%1 | 99, 153, 180 | NR | NR | NR | NS | ||||
| MAWBS (1995-2000, n = 120) | Testosterone | Σ50%1 | 52, 70, 74, 84, 87, 95, 99, 101+90, 105, 110, 118, 138+163+164, 149+123, 153, 180, 187 | 0.77 | NR | 0.41 | β = −0.56 [−1.08, −0.05] (0.03) | Negative association with testosterone levels | (Schell et al. 2014) |
| Σ“Persistent”50%1 | 74, 99, 105, 118, 138+163+164, 153, 180, 187 | 0.47 | NR | 0.30 | β = −0.57 [−1.1, −0.04] (0.03) | ||||
| Σ“Non-persistent”50%1 | 52, 84, 95, 101+90, 110, 149+123 | 0.24 | NR | 0.16 | NS | ||||
| Σ“Estrogenic”50%1 | 52, 70, 95, 99, 101+90, 110, 153 | 0.38 | NR | 0.22 | β = −0.47 [−0.92, −0.01] (0.05) | ||||
| Σ“Anti-estrogenic”50%1 | 105 | 0.02 | NR | 0.02 | NS | ||||
| ΣMonoOrtho50%1 | 70, 74, 105, 118 | 0.15 | NR | 0.09 | β = −0.62 [−1.12, −0.12] (0.02) | ||||
| ΣDiOrtho50%1 | 52, 87, 99, 101+90, 110, 138+163+164, 153, 180 | 0.51 | NR | 0.29 | NS | ||||
| ΣTriTetraOrtho50%1 | 84, 95, 187 | 0.08 | NR | 0.04 | NS | ||||
| Adult Mohawk (1995-2000, n = 257)a | Testosterone | ΣTotal2 | NR | 5.93 | NR | NR | Highest tertile OR = 1.7 | Negative association with testosterone levels in men (no association in women) | (Goncharov et al. 2009) |
| Σ“Non-persistent”2 | 31, 44, 49, 52, 70 | 0.13 | NR | NR | NS | ||||
| ΣMonoOrtho2 | 1, 6, 7, 8, 9, 22, 25, 26, 28, 29, 31, 33, 56, 63, 66, 67, 70, 74, 105, 114, 118, 156 | 1.24 | NR | NR | Highest tertile OR = 0.35 [0.12-0.97] | ||||
| ΣDiOrtho2 | 4+2, 10, 17, 18, 19, 24+27, 32+16, 40, 42, 44, 47+59, 49, 52, 64, 71, 83, 87, 90+101, 92, 97, 99, 110, 128, 129, 130, 137, 163+164+138, 141, 146, 153, 158, 170, 172, 180, 190, 194 | 3.46 | NR | NR | Highest tertile OR = 0.30 [0.08-0.91] | ||||
| ΣTriTetraOrtho2 | 45, 46, 51, 53, 84, 91, 95, 132, 134, 136, 144, 151, 171, 174, 176, 177, 179, 183, 185, 187, 195, 196, 199, 200, 201, 203, 206 | 1.11 | NR | NR | Highest tertile OR = 0.30 [0.08-0.97] | ||||
| ΣDioxin-like2 (TEQ) | 77, 105, 114, 118, 156 | 1.9x10⁻⁵ | NR | NR | Highest tertile OR = 0.32 [0.11-0.90] | ||||
| Mohawk women (2009-2013, n = 140) | Ovulatory status | Σ50%3 | 31, 52, 66, 70, 74, 84, 87, 101, 105, 110, 118, 136, 138, 153, 158, 180, 183, 187 | NR | 0.64 | 0.394 | NS | ΣMonoOrtho20% higher among anovulatory women | (Gallo et al. 2016) |
| ΣMonoOrtho20%3 | 28, 31, 33, 56, 63, 74, 70, 66, 105, 114, 118, 156 | NR | 0.17 | 0.147 | β = 2.36 [1.06, 5.28] (0.04) | ||||
| ΣDiOrtho20%3 | 52, 101, 87, 110, 153, 138, 158, 180 | NR | 0.44 | 0.290 | NS | ||||
| ΣTriTetraOrtho20%3 | 51, 53, 91, 95, 136, 144, 151, 174, 177, 183, 185, 187, 199 | NR | 0.13 | 0.183 | NS | ||||
| Mohawk women (2009-2013, n = 169) | Reproductive hormone levels | Σ“Estrogenic”4 | 28, 31, 44, 47+59, 49, 52, 66, 70, 74, 95, 99, 101+90, 105, 110, 136, 153, 174, 177, 187 | NR | 0.39 | 0.304 | β = 4.85 [1.71, 13.76] (<0.01) | Positive association with ratio of follicle-stimulating hormone to luteinizing hormone (indicator of ovarian responsivity) | (Gallo et al. 2018) |
| Σ“Airborne”4 | 28, 52, 66, 74 | NR | 0.08 | 0.074 | β = 2.66 [1.14, 6.19] (0.02) | ||||
| ΣMonoOrtho20%4 | 28, 31, 33, 56, 63, 66, 70, 74, 105, 114, 118, 156 | NR | 0.16 | 0.138 | β = 5.01 [1.79, 14.03] (<0.01) | ||||
| ΣDiOrtho20%4 | 32+16, 42, 44, 47+59, 49, 52, 64, 71, 83, 87, 92, 99, 101+90, 110, 128, 138+164+163, 153, 158, 170, 172, 180, 190 | NR | 0.57 | 0.326 | NS | ||||
| ΣTriTetraOrtho20%4 | 51, 53, 84, 91, 95, 136, 144, 151, 174, 177, 183, 185, 187, 199, 203 | NR | 0.16 | 0.199 | β = 2.28 [1.06, 4.92] (0.04) |
Imputed with Cohen’s method;
MDL/2;
If <40% below MDL, replaced with MDL/√2; >40%, replaced with zero;
MDL/√2
Men only; data for 436 women not shown
NR = not reported; NS = non-significant (p > 0.05); SD = standard deviation; MAWBS = Mohawk Adolescent Well-Being Study; YAWBS = Young Adult Well-Being Study; Σ50% = sum limited to congeners measured in 50% or more of samples;
Superscripts denote approach applied toward values below the method detection limit (MDL)
Exposure biomarker studies
Among the 14 studies that examined biomarkers of exposure (not in relation to health outcomes), three evaluated PCB levels in breastmilk and 11 in serum (Table 3). The three unique studies of PCB levels in breastmilk were conducted between 1986 and 1992. Two of these studies reported no difference in total PCB levels between Mohawk mothers and a referent group when examined across all birth years; however, Mohawk mothers who delivered from 1986-1989 had levels 50% higher than the referent group (Fitzgerald et al. 1998; Hong et al. 1994). The third study compared the congener patterns in breastmilk of Mohawk and referent mothers to each other and to those in locally caught fish (Hwang et al. 2001). There was no difference between the congener patterns in the Mohawk women compared to the referent women except when stratified by fish consumption. Mohawk women who consumed the most fish had breastmilk PCB congener patterns that resembled those in locally caught fish.
Of the 11 exposure studies measuring PCB levels in serum, several studies examined individual characteristics associated with PCB levels. Three studies in the cohort of Mohawk men reported that age, fish consumption, never being married, and occupational exposure were positively associated with serum total PCB levels (Fitzgerald et al. 1996; Fitzgerald et al. 2007; Hwang et al. 1999). No association was found between residential location and serum PCB levels (Fitzgerald et al. 2007). Similar to the results in Mohawk men, an examination of serum PCB levels in Mohawk Mothers and Infants revealed a marginal association between total serum PCB levels and local fish consumption when controlling for age while there was no association with residential location or soil exposure (Fitzgerald et al. 2004). In addition, YAWBS participants who were breastfed, first born, or had consumed local fish within the past year had higher serum PCB levels (Gallo et al. 2011).
A study of the MAWBS cohort used principal component analysis to identify congener profile patterns in serum (Ravenscroft et al. 2018). The authors labeled the four patterns as “Aroclor 1248-like,” “Persistent, Aroclor 1260-like,” “Mono-ortho PCBs,” and “Aroclor 1254-like.” Because the Aroclor 1248-like pattern was not related to typical determinants of PCB exposures (diet, age, body mass index, or breastfeeding status), the authors suggested this pattern could represent an airborne exposure pathway (Ravenscroft et al. 2018). In a similar approach in the adult Mohawk cohort, multivariate exploratory analysis was used to identify five congener patterns in serum (DeCaprio et al. 2005) (preliminary data from the study was reported in DeCaprio et al. 2000). The study authors reported these patterns to correspond with volatilized Aroclor 1248, unaltered Aroclor 1254, Aroclor 1262 without labile congeners, and two patterns with subsets of (author-designated) persistent congeners.
In the MAWBS cohort, total serum PCB levels were reported to be lower than published studies of similar-age referent populations (Schell et al. 2003). For individuals who participated in both the MAWBS and subsequent YAWBS cohorts, levels of all PCB congener groupings were reported to have decreased over time, with individual participants showing decreases ranging from 15 to over 40% (Gallo et al. 2015). However, compared to a referent population of youth ages 12 to 19 from the Centers for Disease Control and Prevention (CDC), YAWBS participants had higher geometric mean levels of 12 out of 13 congeners (Gallo et al. 2011).
A study of both the Mohawk men and Mohawk Mothers and Infants cohorts used the caffeine breath test as a metric of CYP1A2 activity (an enzyme induced by exposure to xenobiotics). After adjusting for cigarette smoking and sex, total PCB levels in serum were not associated with caffeine breath test values in either the wet-weight or lipid-adjusted analysis. However, an association was reported between ΣMonoDiOrtho congeners and caffeine breath test values (Fitzgerald et al. 2005).
Health outcome studies
Among the 19 health outcome studies identified, there were five studies of cognitive-behavioral outcomes (Table 4), five studies of thyroid function (Table 5), four studies of metabolic-related health outcomes (Table 6), and five studies of reproductive outcomes (Table 7). All studies evaluated associations between health outcome measures and concentrations of PCBs in serum.
Table 4.
Summary values and cognitive-behavioral health outcomes associated with serum PCB levels.
| Study population (date, sample size) | Outcome(s) measured | Congener groupings used in analysis | Congener IUPAC numbers | Arithmetic mean, wet-weight (ppb) | Geometric mean, wet-weight (ppb) | SD (ppb) | Statistically significant outcomes: Std β [95% CI] (p-value) | Summary of outcome(s) observed in relation to serum PCB levels | Reference |
|---|---|---|---|---|---|---|---|---|---|
| MAWBS (1995-2000, n = 271) | Learning and memory | Σ50%1 | 52, 70, 74, 84, 87, 95, 99, 105, 110, 118, 101+90, 138+163+164, 149+123, 153, 180, 187 | 0.731 | NR | 0.366 | Delayed recall: −0.191 (0.019) Long-term retrieval: −0.235 (0.004) Comprehension-knowledge: −0.168 (0.043) |
Negative associations with measures of long-term memory and a measure of comprehension and knowledge | (Newman et al. 2006) |
| MAWBS (1995-2000, n = 271) | Learning and memory | ΣDioxin-like50%1 | 105, 118, 149+123 | NR | 0.11 | 0.064 | Ravens reasoning measure: −0.16 (0.04) Delayed recall: −0.16 (0.04) Long-term retrieval: −0.16 (0.04) |
Negative associations between congener groupings and measures of learning and memory. | (Newman et al. 2009) |
| ΣNon-dioxin-like50%1 | 52, 70, 74, 84, 87, 95, 99, 101+90, 110, 138+163+164, 153, 180, 187 | NR | 0.55 | 0.319 | Delayed recall: −0.21 (0.01) Long-term retrieval: −0.25 (0) |
||||
| Σ“Persistent”50%1 | 74, 99, 105, 118, 138+163+164, 153, 180, 187 | NR | 0.39 | 0.257 | Delayed recall: −0.22 (0.02) Long-term retrieval: −0.20 (0.03) Auditory processing: −0.23 (0.02) |
||||
| Σ“Low-persistent”50%1 | 52, 70, 84, 87, 95, 101+90, 110 | NR | 0.24 | 0.156 | Delayed recall: −0.16 (0.02) Long-term retrieval: −0.22 (0) Comprehension-knowledge: −0.15 (0.05) |
||||
| MAWBS (1995-2000, n = 271) | Attention and impulsivity | Σ“Persistent”2 | 74, 99, 105, 118, 138+163+164, 153, 180, 187 | 0.43 | NR | 0.26 | Conners impulsive-hyperactive: −0.16 (0.04) | Negative association with measure of impulsivity and hyperactivity (lower score indicative of fewer problems) | (Newman et al. 2014) |
| YAWBS (2000-2006, n = 140) | Attention and impulsivity | Σ“Persistent”3 | 28, 74, 99, 105, 118, 138, 153, 180, 187 | 0.36 | NR | 0.24 | Omission scores (males only): 0.36 [1.16, 6.59] (0.01) | Positive association with measure of inattentiveness in males only | (Behforooz et al. 2017) |
| Adult Mohawk (1995-2000, n = 353) | Distress, depression, quality of life | ΣTotal2 | NR | NR | NR | NR | NS | No association with distress, depression, or quality of life | (Santiago-Rivera et al. 2007) |
Imputed with Cohen’s method;
MDL/2;
Replaced with zero
NR = not reported; NS = non-significant (p > 0.05); SD = standard deviation; CI = confidence interval; MAWBS = Mohawk Adolescent Well-Being Study; YAWBS = Young Adult Well-Being Study; 50% = sum limited to congeners measured in 50% or more of samples;
Superscripts denote approach applied toward values below the method detection limit (MDL)
Table 5.
Summary values and thyroid function outcomes associated with serum PCB levels.
| Study population (date, sample size) | Outcome(s) measured | Congener groupings used in analysis | Congener IUPAC numbers | Arithmetic mean, wet-weight (ppb) | Geometric mean, wet-weight (ppb) | SD (ppb) | Statistically significant outcomes: Std β [95% CI] (p-value) | Summary of outcome(s) observed in relation to serum PCB levels | Reference |
|---|---|---|---|---|---|---|---|---|---|
| MAWBS (1995-2000, n = 115) | Thyroid function | ΣTotal1 | NR | NR | 1.8 | 0.67 | FT4: −0.25 (<0.05) T4: −0.23 (<0.05) |
Positive associations with thyroid-stimulating hormone; negative associations with free thyroxine and total thyroxine | (Schell et al. 2004) |
| Σ5-9chlorines1 | NR | NR | 1.1 | 0.42 | TSH: 0.30 (<0.01) FT4: −0.33 (<0.01) T4: −0.31 (<0.01) |
||||
| Σ1-4chlorines1 | NR | NR | 0.68 | 0.32 | FT4: −0.19 (<0.05) | ||||
| Σ“Persistent”1 | 118, 138+164+163, 153, 170, 180, 183, 187 | NR | 0.35 | 0.21 | TSH: 0.37 (<0.01) FT4: −0.35 (<0.01) T4: −0.33 (<0.01) |
||||
| Σ50%2 | 52, 70, 74, 84, 87, 95, 99, 101+90, 105, 110, 118, 149+123, 138+164+163, 153, 180, 187 | NR | 0.75 | 0.34 | TSH: 0.25 (<0.05) FT4: −0.30 (<0.01) T4: −0.29 (<0.01) |
||||
| Σ75%2 | 52, 74, 95, 99, 101+90, 110, 118, 138+164+163, 153, 180 | NR | 0.58 | 0.28 | TSH: 0.26 (<0.05) FT4: −0.29 (<0.01) T4: −0.29 (<0.01) |
||||
| Σ“Persistent”2 | 74, 99, 105, 118, 138+164+163, 153, 180, 187 | NR | 0.43 | 0.23 | TSH: 0.29 (<0.05) FT4: −0.30 (<0.05) T4: −0.35 (<0.01) |
||||
| MAWBS (1995-2000, n = 232) | Thyroid function | Σ50%2 | 52, 70, 74, 84, 87, 95, 99, 101+ 90, 105, 110, 118, 149+ 123, 138+164+163, 153, 180, 187 | NR | Non-breastfed: 0.59 | Non-breastfed: 0.272 | TSH: 0.24 (<0.05) FT4: −0.27 (<0.01) |
Positive association with thyroid-stimulating hormone; negative association with free thyroxine; no association with triiodothyronine | (Schell et al. 2008) |
| Breastfed: 0.77 | Breastfed: 0.405 | ||||||||
| Σ“Persistent”2 | 74, 99, 105, 118, 138+164+163, 153, 180, 187 | NR | Non-breastfed: 0.34 | Non-breastfed: 0.168 | TSH: 0.31 (<0.01) FT4: −0.27 (<0.05) |
||||
| Breastfed: 0.47 | Breastfed: 0.259 | ||||||||
| Σ“Non-persistent”2 | 52, 70, 84, 87, 95, 101+ 90, 110, 149+123 | NR | Non-breastfed: 0.25 | Non-breastfed: 0.148 | FT4: −0.24 (<0.05) | ||||
| Breastfed: 0.28 | Breastfed: 0.203 | ||||||||
| YAWBS (2000-2006, n = 115) | Thyroid dysfunction | Σ50%1 | 28, 52, 74, 87, 95, 99, 101+90, 105,110, 118, 138+163+164, 153, 180, 187 | NR | Non-breastfed: 0.40 | NR | NS | Positive associations with anti-thyroid peroxidase antibody levels only when stratified by breastfeeding-status | (Schell et al. 2009) |
| Breastfed: 0.48 | NR | 0.43 [0.04, 0.23] (0.01) | |||||||
| Σ“Persistent”1 | 28, 74, 99, 105, 118, 138+163+164, 153, 180, 187 | NR | Non-breastfed: 0.28 | NR | NS | ||||
| Breastfed: 0.36 | NR | 0.40 [0.03, 0.18] (0.01) | |||||||
| Σ“Non-persistent”1 | 52, 87, 95, 101+90, 110 | NR | Non-breastfed: 0.11 | NR | NS | ||||
| Breastfed: 0.10 | NR | NS | |||||||
| ΣMonoOrtho1 | 28, 66, 70, 105, 114, 118, 156 |
NR |
Non-breastfed: 0.10 | NR | NS | ||||
| Breastfed: 0.12 | NR | NS | |||||||
| ΣDiOrtho1 | 47, 52, 87, 99, 101+90, 110, 138+163+164, 146, 153, 170, 180, 190 | NR | Non-breastfed: 0.32 | NR | NS | ||||
| Breastfed: 0.40 | NR | 0.45 [0.04, 0.23] (0.01) | |||||||
| ΣTriTetraOrtho1 | 84, 96, 123+149, 183, 187, 196, 199 | NR | Non-breastfed: 0.05 | NR | NS | ||||
| Breastfed: 0.13 | NR | 0.40 [0.02, 0.15] (0.01) | |||||||
| ΣWolff11 (Estrogenic) | 52, 70, 101+90, 187 | NR | Non-breastfed: 0.08 | NR | NS | ||||
| Breastfed: 0.09 | NR | NS | |||||||
| ΣWolff21 (Anti-estrogenic, dioxin-like) | 66, 74, 105, 118, 138+163+164, 156, 170 | NR | Non-breastfed: 0.15 | NR | NS | ||||
| Breastfed: 0.18 | NR | 0.40 [0.02, 0.18] (0.01) | |||||||
| ΣWolff31 (CYP1A and CYP2B inducers) | 99, 153, 180,196 | NR | Non-breastfed: 0.12 | NR | NS | ||||
| Breastfed: 0.16 | NR | 0.40 [0.02, 0.16] (0.01) | |||||||
| Σ“EnzPCBs”1 (UPD-GT inducing) | 52, 99, 101+90, 118, 153, 156, 180, 183, 187, 199 | NR | Non-breastfed: 0.25 | NR | NS | ||||
| Breastfed: 0.32 | NR | 0.42 [0.03, 0.19] (0.01) | |||||||
| Adult women (NR, n = 46 cases hypothyroidism, 75 control) | Thyroid function | ΣTotal3 | NR | NR | NR | NR | NS | No difference in PCB levels between patients with or without hypothydroidism | (Sukdolova et al. 2000) |
| Adult Mohawk (1995-2000, n = 703) | Thyroid function | ΣTotal3 | NR | Men: 5.29 | NR | Men: 5.39 | NS | No significant associations with measures of thyroid function | (Bella and Carpenter 2021) |
| Women: 3.97 | NR | Women: 3.35 | NS |
MDL/2;
Imputed with Cohen’s method;
NR;
MDL/√2;
Replaced with zero
NR = not reported; NS = non-significant (p > 0.05); SD = standard deviation; MAWBS = Mohawk Adolescent Well-Being Study; YAWBS = Young Adult Well-Being Study; 50% = sum limited to congeners measured in 50% or more of samples; FT4 = free thyroxine; T4 = total thyroxine; TSH = thyroid-stimulating hormone; Q4 OR = quartile 4 odds ratio; ML = maximum likelihood;
Superscripts denote approach applied toward values below the method detection limit (MDL)
Table 6.
Summary values and metabolic-related health outcomes associated with serum PCB levels.
| Study population (date, sample size) | Outcome(s) measured | Congener groupings used in analysis | Congener IUPAC numbers | Arithmetic mean, wet-weight (ppb) | Geometric mean, wet-weight (ppb) | SD (ppb) | Statistically significant outcomes: test statistic [95% CI] (p-value) | Summary of outcome(s) observed in relation to serum PCB levels | Reference |
|---|---|---|---|---|---|---|---|---|---|
| Adult Mohawk (1995-2000, n = 601) | Metabolic syndrome | ΣTotal1 | NR | 5.26 | NR | NR | High serum lipids: III tertile β = 0.19 (0.05) | Lower chlorinated congener groupings associated with diabetes and hypertension; higher chlorinated congener groupings associated with obesity and elevated serum lipids. Metabolic syndrome (presence of 3 or more metabolic disorders) associated with specific congener groupings; no associations with cardiovascular disease. |
(Aminov and Carpenter 2020) |
| ΣNonMonoOrtho | 1, 3, 6, 7, 8, 9, 13, 15, 22, 25, 26, 28, 29, 31, 33, 56, 63, 66, 67, 70, 74, 77, 105, 114, 118, 156 | 1.34 | NR | NR | High blood pressure: III tertile β = 0.62 (0.0229) Diabetes: III tertile β = 1.06 (0.0328) Metabolic syndrome: III tertile β = 1.12 (0.0018) |
||||
| ΣMonoDiChloro1 | 1, 2+4, 3, 6, 7, 8, 9, 13, 15 | 0.27 | NR | NR | NS | ||||
| ΣTriTetraChloro1 | 17, 18, 19, 22, 24+27, 25, 26, 28, 29, 31, 32+16, 33, 40, 42, 44, 45, 46, 47+59, 49, 51, 52, 53, 56, 63, 64, 66, 67, 70, 71, 74, 77 | 0.99 | NR | NR | High blood pressure: III tertile β = 0.72 (0.0043) Diabetes: III tertile β = 1.63 (0.026) Metabolic syndrome: III tertile β = 1.12 (0.0008) |
||||
| ΣPentaHexaChloro1 | 95, 91, 92, 84, 90+101, 99, 83, 97, 87, 136, 110, 151, 144, 109+147, 123+149, 118, 134, 114, 146, 153, 132, 105, 141, 137, 130, 164+163+138, 158, 129, 128, 156 | 2.62 | NR | NR | High serum lipids: III tertile β = 0.26 (0.0098) | ||||
| ΣHeptaOctaNonaDecaChloro1 | 170, 171, 172, 174, 176, 177, 179, 180, 183, 187, 190, 194, 195, 196, 199, 200, 201, 203, 206 | 1.49 | NR | NR | Obesity: III tertile β = 0.51 (0.0044) High serum lipids: III tertile β = 0.30 (0.0021) |
||||
| ΣDioxin-like1 | 77, 105, 114, 118, 123+149, 156 | 0.58 | NR | NR | High serum lipids: III tertile β = 0.20 (0.032) | ||||
| ΣNon-dioxin-likeNonMonoOrtho1 | 3, 6, 7, 8, 9, 13, 15, 22, 25, 26, 28, 29, 31, 33, 56, 63, 66, 67, 70, 74 | 0.80 | NR | NR | High blood pressure: III tertile β = 0.60 (0.017) Diabetes: III tertile β = 1.57 (0.013) Metabolic syndrome: III tertile β = 0.82 (0.031) |
||||
| ΣDiOrtho1 | 4+2, 17, 18, 24+27, 32+16, 40, 42, 44, 47+59, 49, 52, 64, 71, 83, 87, 90+101, 92, 97, 99, 110, 128, 129, 130, 137, 141, 146, 153, 158, 164+163+138, 170, 172, 180, 190, 194 | 2.92 | NR | NR | High serum lipids: III tertile β = 0.30 (0.0016) | ||||
| ΣTriTetraOrtho1 | 19, 45, 46, 51, 53, 84, 91, 95, 123+149, 132, 134, 136, 144, 147+109, 151, 171, 174, 176, 177, 179, 183, 185, 187, 195, 196, 199, 200, 201, 203, 206 | 1.06 | NR | NR | High blood pressure: III tertile β = 0.64 (0.037) High serum lipids: III tertile β = 0.22 (0.015) Metabolic syndrome: III tertile β = 0.82 (0.031) |
||||
| Adult Mohawk (1995-2000, n = 601) | Diabetes | ΣTotal1 | NR | 5.26 | NR | 4.01 | NS | Positive association between diabetes and non-dioxin-like, low-chlorinated congeners | (Aminov et al. 2016) |
| ΣNonMonoOrtho1 | 1, 3, 6, 7, 8, 9, 13, 15, 22, 25, 26, 28, 31, 33, 56, 63, 66, 67, 70, 74, 77, 105, 114, 118, 156 | 1.32 | NR | 1.13 | Q4 OR = 4.55 [1.48, 13.95] (0.0081) | ||||
| ΣDioxin-like1 (TEQ) | 77, 105, 114, 118, 123+149, 156 | 1.7 | NR | 1.9 | NS | ||||
| ΣNon-dioxin-likeNonMonoOrtho1 | 1, 3, 6, 7, 8, 9, 13, 15, 22, 25, 26, 28, 29, 31, 33, 56, 63, 66, 67, 70, 74 | 0.79 | NR | 0.52 | Q4 OR = 5.01 [1.76, 14.24] (0.0025) | ||||
| ΣDiOrtho1 | 4+2, 17, 18, 24+27, 32+16, 40, 42, 44, 47+59, 49, 52, 64, 71, 83, 87, 90+101, 92, 97, 99, 110, 128, 129, 130, 137, 141, 146, 153, 158, 164+163+138, 170, 172, 180, 190, 194 | 2.86 | NR | 2.26 | NS | ||||
| ΣTriTetraOrtho1 | 19, 45, 46, 51, 53, 84, 91, 95, 123+149, 132, 134, 136, 144, 147+109, 151, 171, 174, 176, 177, 179, 183, 185, 187, 195, 196, 199, 200, 201, 203, 206 | 1.04 | NR | 0.79 | Q4 OR = 2.9 [0.99, 8.51] (0.053) | ||||
| ΣTriTetraChloro1 | 17, 18, 19, 22, 24+27, 25, 26, 28, 29, 31, 32+16, 33, 40, 42, 44, 45, 46, 47+59, 49, 51, 52, 53, 56, 63, 64, 66, 67, 70, 71, 74, 77 | 0.98 | NR | 0.56 | Q4 OR = 3.66 [1.37, 9.78] (0.0098) | ||||
| ΣPentaHexaChloro1 | 83, 84, 87, 90+101, 91, 92, 95, 97, 99, 105, 109+147, 110, 114, 118, 123+149, 128,129, 130, 132, 134, 136, 137, 141, 144, 146, 151, 153, 156, 158, 164+163+138 | 2.56 | NR | 2.16 | NS | ||||
| ΣHeptaDecaOctaNonaChloro1 | 170, 171, 172, 174, 176, 177, 179, 180, 183, 187, 190, 194, 195, 196, 199, 200, 201, 203, 206 | 1.45 | NR | 1.49 | NS | ||||
| Adult Mohawk (1995-2000, n = 352) | Diabetes | ΣTotal2 | NR | 5.03 | NR | 4.29 | NS | No significant associations in adjusted models | (Codru et al. 2007) |
| Adult Mohawk (1995-2000, n = 277) | Self-reported cardiovascular disease; serum lipid levels | ΣTotal3 | NR | 4.23 | NR | 0.19 (SE) | Lipids: ML estimate = 60.35 (0.00) | Positive association with lipids; no associations identified with specific congeners | (Goncharov et al. 2008) |
MDL/√2;
Replaced with zero;
MDL/2
NR = not reported; NS = non-significant (p > 0.05); SD = standard deviation; MAWBS = Mohawk Adolescent Well-Being Study; YAWBS = Young Adult Well-Being Study; Q4 OR = quartile 4 odds ratio; ML = maximum likelihood;
Superscripts denote approach applied toward values below the method detection limit (MDL)
Cognitive-behavioral outcomes
Of the five cognitive-behavioral health outcome studies (Table 4), two studies of the MAWBS cohort examined potential associations between serum PCB levels and learning and memory through the administration of three tests of cognitive measures. The first test, the Woodcock Johnson-Revised Tests of Cognitive Ability, Standard, and Supplemental Batteries, provides a measure of overall cognitive functioning, as well as scores for seven different domains: long-term retrieval, short-term memory, processing speed, auditory processing, visual processing, comprehension-knowledge, and fluid reasoning. The Ravens Progressive Matrices, Standard Form is a measure of intellectual ability and reasoning skills that assesses the “individual’s ability to discern patterns and derive meaning from complex data.” The third test is the Test of Memory and Learning (TOMAL), a measure of general and specific memory. When congeners were grouped as Σ50% (i.e., the sum of those measured in 50% or more of samples), there was no association reported with Ravens Progressive Matrices, but negative associations were reported with one of four TOMAL indices (delayed recall) and with two of eight Woodcock Johnson scores (long-term retrieval and comprehension-knowledge) (Newman et al. 2006). A related study examined associations with the same scores when the congeners were grouped as ΣDioxin-like, ΣNon-dioxin-like, Σ“Persistent”, and Σ“Low-persistent” (Newman et al. 2009). All groupings were reported to be negatively associated with TOMAL delayed recall and Woodcock Johnson long-term retrieval scores. There were no associations reported with the three other TOMAL scores or with five of the Woodcock Johnson scores. Additional (negative) associations were reported with other PCB groupings: Ravens Progressive Matrices with ΣDioxin-like, Woodcock Johnson auditory processing with Σ“Persistent”, and Woodcock Johnson comprehension-knowledge with Σ“Low-persistent” (Newman et al. 2009).
Associations between serum PCB levels and measures of attention and impulsivity were investigated in two studies of the MAWBS and YAWBS cohorts. To assess attention and impulsivity in the MAWBS cohort, scores on the Attention Deficit Disorders Evaluation Scale and the Conners Rating Scales were computed based on ratings from parents and teachers. Of the 9 scores evaluated, a negative association was reported only between Σ“Persistent” and scores on the Conners Impulsive–Hyperactive measure derived from the parent’s report (i.e., higher PCB levels were associated with lower impulsivity/hyperactivity) (Newman et al. 2014). To assess attention and impulsivity in the YAWBS cohort, a computerized version of the Conners continuous performance test was given, resulting in four different scores. Here, in males only, a positive association was reported between Σ“Persistent” serum PCB levels and errors of omission (considered indicative of lapses of sustained attention) (Behforooz et al. 2017).
Finally, one study of cognitive-behavioral outcomes was conducted in the Mohawk adult cohort. This study found no associations between total serum PCB levels and quality of life, psychological distress, or self-reported levels of depression (Santiago-Rivera et al. 2007).
No studies of potential associations between cognitive-behavioral outcomes and prenatal or early postnatal exposures were identified for the Akwesasne population.
Thyroid function
We identified five studies evaluating thyroid function in relation to serum PCB levels (Table 5). There were two studies of the MAWBS cohort, one of YAWBS, and two studies in adults. In studies of the MAWBS cohort, thyroid function was characterized using measured levels of total thyroxine (T4), free thyroxine (FT4), triiodothyronine (T3), and thyroid-stimulating hormone (TSH) (Schell et al. 2004; Schell et al. 2008). There were no associations reported in either study with T3 (Schell et al. 2004; Schell et al. 2008). In Schell et al. 2004, all congener groupings (three groupings of total PCBs, congeners with 1-4 chlorines, congeners with 5-9 chlorines, and two different groupings of Σ“Persistent” congeners) were reported to be negatively associated with FT4, while all groupings except congeners with 1-4 chlorines were positively associated with TSH and negatively associated with T4. In Schell et al. 2008, congeners were grouped as Σ50%, Σ“Persistent”, and Σ“Non-persistent”. There were no significant associations reported with T4. Similarly to the earlier study, FT4 was negatively associated with all groupings, while TSH was reported to be positively associated with Σ50% and Σ“Persistent” (Schell et al. 2008). In the YAWBS cohort, antibody levels of anti-thyroid peroxidase were used as a biomarker of thyroid dysfunction. Eleven different congener groupings were used in analyses (see Table 5). No associations were noted among participants who had not been breastfed; in contrast, among breastfed participants a positive association was reported between seven of the congener groupings and anti-thyroid peroxidase antibody levels. There were no associations reported with Σ“Non-persistent”, ΣMonoOrtho, or ΣWolff1 (estrogenic congeners grouped according to Wolff et al. (1997)) (Schell et al. 2009).
In contrast to the studies conducted among the MAWBS and YAWBS, studies conducted among adult Mohawk men and women did not report associations between serum PCB levels and thyroid outcomes. Total serum PCB levels were not found to be different between adult Mohawk women with or without hypothyroidism (Sukdolova et al. 2000). Similarly, in a larger cohort of men and women, there was no significant association between total serum PCBs and any of the thyroid hormones measured (T4, FT4, T3, FSH) (Bella and Carpenter 2021).
Metabolic-related health outcomes
We identified four studies that evaluated health outcomes related to metabolic syndrome (Table 6). Two studies of the adult Mohawk cohort examined associations between serum PCBs and diabetes (defined as fasting glucose values > 125 mg/dL or by a physician’s diagnosis) (Aminov et al. 2016; Codru et al. 2007). Codru et al. 2007 examined associations with total serum PCBs. After adjustments for other pollutants (Mirex, hexachlorobenzene (HCB), dichloro-diphenyl-dichloro-ethylene (DDE)), no significant association was reported between diabetes and total serum PCB levels (Codru et al. 2007). In a second study, congeners were classed into eight different groupings: ΣNonMonoOrtho, ΣNon-dioxin-like, ΣTriTetraChloro, ΣDiOrtho, ΣTriTetraOrtho, ΣDioxin-like (TEQ), ΣPentaHexaChloro, and ΣHeptaOctaNonaDecaChloro. In adjusted models, significant positive associations were reported between diabetes and ΣNonMonoOrtho, ΣNon-dioxin-like, and ΣTriTetraChloro congeners, while associations were nonsignificant for the other five congener groupings (Aminov et al. 2016). In a related study of the adult Mohawk cohort, components of the metabolic syndrome were investigated, including diabetes (defined by self-report of having been diagnosed with diabetes by a physician or by measured serum fasting glucose level of >125 mg/dL), hypertension (self-reported), central adiposity (estimated from body mass index), cardiovascular disease (self-reported), and hyperlipidemia (measured in serum) (Aminov and Carpenter 2020). In addition to total serum PCBs, congeners were classed into the eight groupings used in Aminov et al. 2016. The authors reported that groupings of higher chlorinated congeners were positively associated with obesity and elevated serum lipids, while groupings of lower chlorinated congeners were positively associated with diabetes and hypertension (Table 6) (Aminov and Carpenter 2020). In adjusted models, the metabolic syndrome (presence of three or more metabolic syndrome components) was associated with four of the nine groupings (ΣTriTetraChloro, ΣNonMonoOrthoPCBs, ΣNon-dioxin-like, and ΣTriTetraOrtho) (Aminov and Carpenter 2020). The study reported no associations between serum PCBs and cardiovascular disease. An additional study of the adult Mohawk cohort also reported no associations between total serum PCB levels and self-reported cardiovascular disease (Goncharov et al. 2008).
Reproductive health outcomes
Reproductive health outcomes were investigated in five studies: two of the MAWBS cohort, one of the adult Mohawk cohort, and two of the Mohawk women cohort (Table 7). In MAWBS, a positive association was reported between Σ“Estrogenic” congeners and likelihood of having reached menarche, while there was no association reported between age of menarche and Σ“Anti-estrogenic” or Σ“Enzyme-inducing” (Denham 2005). In the Mohawk women cohort, congeners were grouped as total PCBs, ΣMonoOrtho, ΣDiOrtho, and ΣTriTetraOrtho (Gallo et al. 2016). ΣMonoOrtho was reported to be higher among anovulatory women, while there was no difference in levels of other congener groupings (Gallo et al. 2016). In the second study of the Mohawk women cohort, ovarian responsivity was investigated by measuring the ratio of follicle stimulating hormone to luteinizing hormone (FSH:LH), with a higher ratio indicating less ovarian responsivity (Gallo et al. 2018). In this study, congeners were grouped into five subsets: ΣMonoOrtho, ΣDiOrtho, ΣTriTetraOrtho, Σ“Airborne”, and Σ“Estrogenic”. Four of the five congener groupings were reported as positively associated with a higher FSH:LH ratio (ΣMonoOrtho, ΣTriTetraOrtho, Σ“Airborne”, and Σ“Estrogenic”) (Gallo et al. 2018).
In the second study of the MAWBS cohort, congeners were grouped as total PCBs, Σ“Persistent”, Σ“Non-persistent”, Σ“Estrogenic”, Σ“Anti-estrogenic”, ΣMonoOrtho, ΣDiOrtho, ΣTriTetraOrtho congeners (Schell et al. 2014). There were negative associations reported between serum testosterone in males and total PCBs, Σ“Persistent”, Σ“Estrogenic”, and ΣMonoOrtho congeners (Schell et al. 2014). A similar relationship was found in a study of adult men, whereby there was a negative association reported between serum testosterone levels and all evaluated congener groupings, including ΣMonoOrtho, ΣDiOrtho, ΣTriTetraOrtho, and ΣDioxin-like (TEQ) congeners (Goncharov et al. 2009).
Discussion
The Akwesasne Mohawk Nation has a history of disproportionate burden of PCB exposure (U.S. EPA 2020, 2021d). Quantifying past and current exposures and identifying potential adverse health effects is critical to understanding risk in this community. We identified 33 studies conducted on PCB exposures and health effects in residents of the Akwesasne Mohawk Nation. This review characterized and categorized the available literature into an evidence map by study cohort, congener groupings, exposure biomarker studies, and health effect categories. The identified studies were conducted between 1986 and 2013 and have contributed valuable data toward understanding PCB exposures and potential health effects. However, research gaps remain that limit the ability to identify potential sources of exposure and to evaluate risk of adverse health outcomes; these gaps, described below, should be addressed in future research.
Exposure routes
For adults in the general population, diet is the largest contributor to total PCB exposures, contributing an estimated average of 88% to the total, based on existing data (Weitekamp et al. 2021). Historically, one of the main dietary sources of PCB exposure for the Akwesasne population was local fish consumption. In 1986, the Saint Regis Mohawk Environmental Health Department issued advisories against the consumption of local fish and wildlife with the goal of decreasing dietary PCB exposure. Consistent with adherence to these advisories, elevated levels in breastmilk were only observed in women who gave birth between 1986 and 1989 while levels were similar to those in the general population among women giving birth in later years (Fitzgerald et al. 1998). Exposure studies conducted between 1992 and 1995 reported that total PCB serum levels in adults were associated with lifetime local fish consumption, likely reflecting the persistent nature of many PCBs in human tissues (Fitzgerald et al. 1996; Fitzgerald et al. 2004; Fitzgerald et al. 2007). In the young adult cohort sampled between 2000 and 2005, local fish consumption was low, but those who reported consuming local fish had higher levels of persistent PCB congeners compared to those who did not report local fish consumption (Gallo et al. 2011).
We did not identify more recent studies that examined associations between serum PCB levels and local fish consumption. However, this could still be a route of exposure, given that a fish sampling study found elevated levels of PCBs above the concentrations considered safe for consumption in some adult fish near the Superfund sites during sampling in 2016 (U.S. EPA 2020, 2021d). In recognition of this, the current guides to locally caught fish issued by the Saint Regis Mohawk Tribe and the New York State Department of Health designate these areas as unsafe for fish consumption and provide further recommendations based on species, size, and number of portions consumed (NYS Department of Health 2021; Saint Regis Mohawk Tribe Environment Division 2013a). Indeed, species-specific considerations are important given that fish species vary in cultural significance. More data on PCB levels in the fish species traditionally consumed by the tribe, as well as research on traditional fish consumption patterns and current preferences, could be useful to support customized fish consumption advisories to avoid setting overly conservative limits based on species less likely to be consumed. In addition to fish species-specific considerations, additional research on traditional foods and medicine may also inform a more complete understanding of the dietary exposure route as it pertains to the Akwesasne population.
Aside from diet, PCBs in air may represent another important route of exposure, particularly for children (Weitekamp et al. 2021). Two different approaches have been employed to identify the potential relevance of inhalation exposures in the community through measured serum PCB levels. Air PCB concentrations were previously identified as highest at Raquette Point/Turtle Cove (located adjacent to the General Motors Superfund site) (Chiarenzelli et al. 2000); subsequently, studies by Fitzgerald et al. in 2004 and 2007 defined potential airborne PCB exposure according to whether a participant ever lived at Raquette Point over the previous ten years. However, in neither of these studies were serum PCB levels associated with Raquette Point residence (Fitzgerald et al. 2004; Fitzgerald et al. 2007). The second approach was to examine PCB congener patterns in serum that may derive from inhalation exposure. In Schell et al. 2003, the authors suggest that the relatively high detection rates observed for shorter-lived congeners may represent continued exposure through environmental media. DeCaprio et al. 2005 identified a congener pattern in 5% of participants that was similar to the congener pattern in volatilized Aroclor 1248 (Chiarenzelli et al. 2000; Chiarenzelli et al. 1997), which was the predominant commercial mixture discharged in the St. Lawrence River (Sokol et al. 1994). Similarly, Ravenscroft et al. 2018 identified a congener pattern in serum similar to Aroclor 1248. Since this pattern was not associated with age, sex, body mass index, or prior breastfeeding status, the authors suggested it may also be indicative of an inhalation exposure route. Finally, in Gallo et al. 2018, the sum of four congeners were classified as airborne by the study authors. The predominant congeners in each of these three studies were highly variable, with only PCB 52 shared among all three studies and only PCB 70 shared between the predominant congeners identified in DeCaprio et al. 2005 and Ravenscroft et al. 2018.
Inhalation exposures to PCBs could occur through the indoor or outdoor environment. Elevated levels of PCBs in outdoor air can result as PCBs volatilize from contaminated soils and from water in contact with contaminated sediments (Meng et al. 2008). Outdoor air PCB concentrations were sampled in 1993 at four sites at Akwesasne and one control site at St. Lawrence University in Canton, New York (Chiarenzelli et al. 2000). The Cornwall Island sites had yearly averages of 1.2, 1.4, and 1.9 ng/m3. The highest yearly average was at Turtle Cove (6.6 ng/m3). Notably, the control location at the university had similar levels (5.3 ng/m3). While there were some peaks in PCB concentrations measured in the summer months, these averages are generally within the range of background levels (0.0002–13.0 ng/m3) (Weitekamp et al. 2021). Remediation efforts have been ongoing since the sampling effort in 1993, and we are unaware of more recent peer-reviewed studies that examined outdoor air PCB concentrations at Akwesasne. However, outdoor air PCB levels were measured in 2017 and 2018 during remediation activities and during loadout of impacted materials at the General Motors Superfund site at Akwesasne (RACER Trust 2019). High-volume air sampling was conducted at five sites using field-based methods. The daily average across all samples was 2.36 ng/m3 with a standard deviation of 2.95 ng/m3 (non-detects treated as zero) (RACER Trust 2019). During the remedial actions, a number of controls were used to reduce potential releases; even so, background levels relevant to human exposure are unlikely to exceed these values (Bremle and Larsson 1998).
In indoor air, volatilized PCBs can come from legacy sources, such as fluorescent light ballasts or window caulking, or from products containing PCB-contaminated pigments (Lehmann et al. 2015). For adults in the general population, indoor air exposure was estimated to contribute approximately 11% toward total PCB exposure, while outdoor air was estimated to contribute a much smaller fraction (0.44%) toward the total (Weitekamp et al. 2021). This was partly due to higher PCB concentrations in indoor air compared to outdoor air but also resulted from the large percentage of time U.S. adults in the general population spend indoors compared to outdoors (80% vs 20%, respectively) (U.S. EPA 2011). At PCB-contaminated sites, even when outdoor air PCB concentrations are elevated, the contribution to total exposure may still be substantially lower, especially if sources of indoor air contamination exist. As an example, in a study of PCB levels in indoor and outdoor air near the PCB-contaminated New Bedford Harbor Superfund site in Massachusetts, indoor air concentrations exceeded outdoor air concentrations at all sites, mostly independent of proximity to an outdoor source (Vorhees et al. 1997); this difference is amplified when considering the relative amounts of time spent indoors and outdoors.
As discussed above, studies have interpreted serum PCB congener patterns similar to Aroclor 1248 to indicate inhalation exposures (DeCaprio et al. 2005; Ravenscroft et al. 2018). In a study of New York City schools, altered patterns for Aroclors 1248 and 1254 were most frequently detected in indoor air samples (U.S. EPA 2012). Given the available data, it is therefore difficult to localize a potential source of volatilized Aroclor 1248, as it could arise from indoor or outdoor exposures. Interestingly, in DeCaprio et al. 2005, the putative volatilized congener pattern contributed a very low proportion to the congener profiles of most study participants, but when the profile accounted for over 20% of the total serum PCB profile (in 5% of participants), it was generally in adult Mohawk below the age of 40. Relatedly, the congener pattern identified in Ravenscroft et al. 2018 hypothesized to represent inhalation exposure was the dominant profile among the study participants, who ranged in age from 10 to 16.
Exposure to PCBs from indoor/outdoor air is a function of several variables, including PCB levels in the air and the amount of time spent indoors compared to outdoors (Weitekamp et al. 2021). In children, the potential contribution from indoor air exposures is higher than in adults because children generally spend more time indoors (U.S. EPA 2011), although it is important to note that this fraction will vary across populations. One potential source of PCB inhalation exposure for children is school buildings, and elevated levels of PCBs have been reported in schools in communities near Akwesasne, including in Burlington, VT (Barton 2021), as well as in New York City, NY (median indoor air level across six schools of 318 ng/m3 (U.S. EPA 2012)), Worcester, MA (Worcester Public Schools 2021), and Hartford, CT (De La Torre 2015). Collection of data on indoor and outdoor air PCB concentrations and the indoor/outdoor time fraction specifically at Akwesasne may be helpful for pinpointing sources of exposure and understanding risk in the community. Furthermore, measurement of airborne PCB concentrations in Akwesasne schools could lead to a better understanding of exposures in children and adolescents.
Temporal trends
In addition to sources of exposure, an additional question to address from this body of literature is whether levels of PCB biomarkers have changed over time, and if so, to what extent. Unfortunately, there are many limitations to comparing across studies and across time. First, the exposure biomarker studies conducted between 1986 and 1995 measured 68 congeners, while the studies that followed measured 101 congeners. In addition, while the 1986-1995 studies measured 68 congeners, often only a handful of these (8-12 congeners) were routinely above the MDL. One potential approach to address these limitations and to facilitate comparisons across studies would be to examine the sum of 6 (PCB 28, PCB 52, PCB 101, PCB 138, PCB 153, PCB 180) or 7 (+ PCB 118) indicator congeners within each study. This approach is effective when the source of contamination is closely related to commercial PCB mixtures (Kraft et al. 2021), such as Aroclors, but is less reliable when substantial weathering has occurred or when a non-Aroclor source is present (Megson et al. 2019). Relatedly, dominant congeners in air may not be well represented by indicator congeners. For example, in a study of indoor and outdoor air exposures in mothers and children, non-indicator, lower-chlorinated congeners represented 70-80% of the total inhalation exposure to PCBs (Ampleman et al. 2015).
An additional limitation to comparing across studies is that the MDLs as well as the approach used for values below the MDL varied across studies. Most of the earlier studies included values below the MDL in estimates of total PCB serum levels. In contrast, later studies replaced the value with zero or with a value halfway between zero and the MDL for that congener. Another approach was to impute a value that accounts for both the rate of detection of each congener and the MDL. Each approach is commonly used in epidemiologic studies; however, use of different approaches can result in substantial differences in estimates of PCB serum levels, thus limiting our ability to compare across studies and across time. While consistent data for PCB biomarkers in humans is lacking, there are additional sources of information that may help inform temporal trends. For example, consistent sampling and analytical methodology have been employed in the Five-Year Review Reports for General Motors and Reynolds Metals Superfund sites (U.S. EPA 2020, 2021d). The data on PCB levels in sediment and fish tissues in these reports could offer insight into how environmental exposures to PCBs may have changed over time.
Health outcomes
Health studies associated with PCB exposures in residents of the Mohawk Nation at Akwesasne have reported associations between cognitive, thyroid, metabolic, and reproductive health outcomes and total and specific PCB congener groupings. In general, the results from these studies appear consistent with the large body of evidence from both experimental and epidemiological studies of other populations (ATSDR 2000; Bergman et al. 2013). Effects on cognitive outcomes were reported in the Mohawk adolescent and young adult cohorts with associations found between several different congener groupings and several different measures of cognition and/or behavior. Gestation has been identified as a period of neurodevelopment sensitive to chemical exposure (Rock and Patisaul 2018). The individuals in the adolescent and young adult cohorts were born around the time of the first fish advisories when maternal dietary exposure may have been relatively high. Regarding specific congener groupings, Newman et al. 2009 reported the strongest associations with non-dioxin-like and ortho-substituted congeners, which is consistent with other reports of PCB exposure and nervous system effects (Pessah et al. 2019). Several studies also reported associations with thyroid hormone levels in the Mohawk adolescent and young adult cohorts. Disruption in thyroid hormone signaling has been proposed as a potential mechanism through which PCB exposure could result in neurotoxicity (Pessah et al. 2019). In the identified studies that examined associations between PCB levels and reproductive health outcomes, most significant associations were reported with estrogenic and mono-ortho substituted congeners. For example, subsets of mono-ortho substituted congeners were reported to be negatively associated with testosterone levels in adolescent and adult males and positively associated with greater occurrence of anovulatory cycles and decreased ovarian responsivity in women (Gallo et al. 2016; Gallo et al. 2018; Goncharov et al. 2009; Schell et al. 2014). It will be important to evaluate this literature critically and systematically alongside studies of PCB exposure and health effects in other populations before drawing conclusions about the specific hazards of PCB exposure and levels of exposure associated with those hazards.
Research challenges and opportunities
There are certain limitations to note when evaluating the body of health outcome studies in residents at Akwesasne. First, most studies were cross-sectional, which means that they measured the exposure and the outcome at the same time (e.g., serum PCB levels were measured at approximately the same time that a health outcome was assessed). The best support for a conclusion about causality is evidence that exposure began before the effect occurred; this temporal relationship cannot be assessed with a cross-sectional study design. Further, because the potential health effects of individual congeners or the interactions between congeners largely remain unknown, most studies look for associations between a given health outcome and several different congener groupings. Without controlling for multiple hypothesis testing, this approach has the potential to lead to spurious correlations. In addition, the specific congeners included within a given grouping can differ between studies, based both on different statistical approaches employed and because authors can make different assumptions about congener structure and function. For example, Schell et al. (2004) used two different imputation methods to calculate the sum of persistent congeners. The first method included 9 congeners while the second method included 10, but 5 of the specific congeners were non-overlapping. An additional statistical challenge is that individual congeners and their groupings are often highly correlated. These differences in approaches toward congener groupings can increase the challenge of comparing results across studies and with the larger literature. Finally, the measured congeners may not necessarily be representative of the primary or original exposure (Christensen et al. 2021). For example, exposure to specific congeners could lead to adverse health effects at the time of exposure, but once the congeners are metabolized or eliminated, the signature of exposure may no longer be detectable while the health effect could continue, particularly for less persistent congeners. Relatedly, there is increasing evidence for the potential toxicity of PCB metabolites (Dhakal et al. 2017; Liu et al. 2020) and yet these metabolites are rarely measured in human tissues; we are unaware of metabolite sampling in residents at Akwesasne.
As described in EPA’s cumulative risk framework, adverse health outcomes associated with exposure to PCBs could be exacerbated by nonchemical and other chemical stressors (Couch and Coles 2011; U.S. EPA 2003). Indigenous American populations have experienced generations of trauma arising from social and structural inequalities (Hoover et al. 2012; Ravenscroft et al. 2015). Added to this is the psychosocial stress from uncertainties regarding potential health effects related to PCB exposures in the community. Furthermore, the tribe has also had to limit important cultural practices that contribute to community well-being, such as fish and game hunting. Advisories with the aim of reducing PCB exposure via the cessation of fish consumption are interpreted as a zero-risk alternative – but this is false. In interviews, residents at Akwesasne expressed concerns regarding reduced local fish consumption due to the loss of important cultural and social connections and because fish has been replaced with processed foods (Hoover 2013). Similarly, knowledge that PCBs transfer through breastmilk could affect a woman’s choice to breastfeed. Both breastfeeding and fish consumption provide important nutritional benefits, and it can be challenging to balance the risks and benefits associated with avoiding these potential exposures (Dellinger et al. 2018; Mead 2008; Wilson 2004). Partly because of the success of remediation efforts, the tribe issued revised fish and game guidelines in 2013-14. While locality restrictions remain in place, the new guidelines point to local species and portions that are preferred choices for consumption (Saint Regis Mohawk Tribe Environment Division 2013a, b). Still, the need to balance a promotion of Mohawk culture and tradition with health and safety is an additional stressor that requires consideration for this community.
In addition to elevated levels of PCBs, there is potential for other chemicals to be present at Akwesasne and the surrounding area. For example, groundwater sampling reported in the Fourth Five-Year Review for the General Motors site showed elevated levels of the volatile organic compound trans-1,2-dichloroethylene, phenolic compounds, and some emerging contaminants (residential drinking water is provided by a public water system derived from surface water) (U.S. EPA 2020). Furthermore, several PCB health outcome studies reported associations with multiple chemical exposures. For example, an association was reported between serum lead levels and reproductive health in Akwesasne Mohawk girls (Denham 2005) and between serum levels of HCB and lead and thyroid hormone levels in Mohawk youth (Schell et al. 2008). In another study, pesticides, HCB, DDE, and Mirex were each associated with different metabolic disorders (Aminov and Carpenter 2020). To further understand cumulative risk at Akwesasne from multiple stressors (U.S. EPA 2003), studies could be designed to apply statistical approaches that would allow an estimation of the potential for interactions between multiple stressors and health outcomes.
Research strengths
An important strength of the research on PCB exposures and health outcomes at Akwesasne that emerges from this evidence map is that it was conducted under a community partnership approach (Ravenscroft et al. 2015; Schell et al. 2005). Community involvement and advocacy helps to ensure that the research questions and approaches are meaningful and relevant at the local level (Ravenscroft et al. 2015). The partnership approach involved capacity building, where the data collection staff were hired from the Akwesasne Mohawk Nation. Being active agents in the research increased community investment in the projects, resulting in successful recruitment and retention of study participants (Ravenscroft et al. 2015). To engage in research, the tribe founded the Akwesasne Task Force on the Environment (Schell et al. 2005). In addition to research, the tribe also has a participatory role in remediation efforts. For example, on the U.S. side of Akwesasne, the Saint Regis Mohawk Tribe is working with the U.S. EPA and the New York State Department of Environmental Conservation to review all sampling and remediation work plans at the Superfund sites (Benedict and Arquette 2021).
Conclusions
Overall, future research could benefit by focusing on the identification of exposure sources through measurements of PCBs in environmental media at Akwesasne, especially indoor and outdoor air. In the general population, humans spend a much greater proportion of time indoors where there is potential exposure to PCBs from sources including fluorescent light ballasts or window caulking. Thus, this represents a highly important inhalation exposure pathway. It could be informative to determine to what extent the fraction of time Mohawk children and adults spend indoors varies compared to the general population. Furthermore, because the most recent measurements of PCBs in serum were conducted between 2009 and 2013, with most sampling occurring between 1995 and 2005, future research could seek to determine whether current levels of PCBs in breastmilk and serum are elevated compared to referent populations. Additional research in this community could also consider health effects under a cumulative risk framework that includes potential interactions between PCB exposures, other chemical stressors, and nonchemical stressors, such as the negative effects of environmental contamination on important social and cultural traditions. Finally, our evidence map identified many studies that were conducted using a community partnership approach, suggesting that research at Akwesasne can serve as a successful model that could benefit other communities facing similar environmental challenges.
Supplementary Material
Acknowledgements
We thank Kent Thomas and Martha Powers for help improving the manuscript. Graphical abstract created using elements designed by macrovector/Freepik. This manuscript has been reviewed by the U.S. EPA and approved for publication. Approval does not necessarily signify that the contents reflect the views or opinions of the U.S. EPA, nor does mention of trade names or commercial products constitute endorsement or recommendation for use.
Footnotes
Conflicts of Interest
The authors declare they have nothing to disclose.
References
- Aminov Z, Haase R, Rej R, Schymura MJ, Santiago-Rivera A, Morse G, et al. 2016. Diabetes prevalence in relation to serum concentrations of polychlorinated biphenyl (pcb) congener groups and three chlorinated pesticides in a native american population. Environ Health Persp 124:1376–1383. [DOI] [PMC free article] [PubMed] [Google Scholar]
- Aminov Z, Carpenter DO. 2020. Serum concentrations of persistent organic pollutants and the metabolic syndrome in akwesasne mohawks, a native american community. Environmental Pollution 260. [DOI] [PMC free article] [PubMed] [Google Scholar]
- Ampleman MD, Martinez A, DeWall J, Rawn DFK, Hornbuckle KC, Thorne PS. 2015. Inhalation and dietary exposure to pcbs in urban and rural cohorts via congener-specific measurements. Environ Sci Technol 49:1156–1164. [DOI] [PMC free article] [PubMed] [Google Scholar]
- ATSDR. 1995. Exposure to pcbs from hazardous waste among mohawk women and infants at akwesasne. ATSDR/HS-95/43. [Google Scholar]
- ATSDR. 2000. Toxicological profile for polychlorinated biphenyls.U.S. Department for Health and Human Services. [Google Scholar]
- ATSDR. 2007. Public health consultation for general motors (central foundry division) – update, massena, st. Lawrence county, new york. NYDO91972554 Atlanta, Georgia. [Google Scholar]
- Barton A. 2021. Burlington abandons contaminated high school in favor of constructing new building. Available: https://www.burlingtonfreepress.com/story/news/2021/05/05/burlington-high-school-vt-build-new-school-pcb-contamination-extensive/4953155001/ [accessed October 14, 2021.
- Behforooz B, Newman J, Gallo MV, Schell LM. 2017. Pcbs and measures of attention and impulsivity on a continuous performance task of young adults. Neurotoxicology and Teratology 64:29–36. [DOI] [PMC free article] [PubMed] [Google Scholar]
- Bella D, Carpenter DO. 2021. Interactions among thyroid hormones and serum lipid levels in association with pcb exposure in the mohawk akwesasne population. Environmental Research 200. [DOI] [PubMed] [Google Scholar]
- Benedict A, Arquette C. 2021. Gm cleanup a reality, central foundry superfund site - decades in the making. Available: https://storymaps.arcgis.com/stories/fa27cb7720c44f8aa7a8b6a5862e96cb [accessed August 4, 2021.
- Bergman A, Heindel J, Jobling S, Kidd K, Zoeller RT, World Health Organization. 2013. State of the science of endocrine disrupting chemicals 2012:World Health Organization. [Google Scholar]
- Bremle G, Larsson P. 1998. Pcb in the air during landfilling of a contaminated lake sediment. Atmospheric Environment 32:1011–1019. [Google Scholar]
- Chiarenzelli J, Bush B, Casey A, Barnard E, Smith B, O’Keefe P, et al. 2000. Defining the sources of airborne polychlorinated biphenyls: Evidence for the influence of microbially dechlorinated congeners from river sediment? Canadian Journal of Fisheries and Aquatic Sciences 57:86–94. [Google Scholar]
- Chiarenzelli JR, Scrudato RJ, Wunderlich ML. 1997. Volatile loss of pcb aroclors from subaqueous sand. Environ Sci Technol 31:597–602. [Google Scholar]
- Christensen K, Carlson LM, Lehmann GM. 2021. The role of epidemiology studies in human health risk assessment of polychlorinated biphenyls. Environmental Research 194. [DOI] [PMC free article] [PubMed] [Google Scholar]
- Codru N, Schymura MJ, Negoita S, Rej R, Carpenter DO. 2007. Diabetes in relation to serum levels of polychlorinated biphenyls and chlorinated pesticides in adult native americans. Environ Health Persp 115:1442–1447. [DOI] [PMC free article] [PubMed] [Google Scholar]
- Couch SR, Coles CJ. 2011. Community stress, psychosocial hazards, and epa decision-making in communities impacted by chronic technological disasters. American Journal of Public Health 101:S140–S148. [DOI] [PMC free article] [PubMed] [Google Scholar]
- De La Torre V. 2015. Hartford budget proposal puts pcb cleanup at $4m. Available: https://www.courant.com/community/hc-hartford-clark-pcbs-0317-20150316-story.html [accessed October 14, 2021.
- DeCaprio AP, Tarbell AM, Bott A, Wagemaker DL, Williams RL, O’Hehir CM. 2000. Routine analysis of 101 polychlorinated biphenyl congeners in human serum by parallel dual-column gas chromatography with electron capture detection. J Anal Toxicol 24:403–420. [DOI] [PubMed] [Google Scholar]
- DeCaprio AP, Johnson GW, Tarbell AM, Carpenter DO, Chiarenzelli JR, Morse GS, et al. 2005. Polychlorinated biphenyl (pcb) exposure assessment by multivariate statistical analysis of serum congener profiles in an adult native american population. Environ Res 98:284–302. [DOI] [PubMed] [Google Scholar]
- Dellinger MJ, Olson JT, Holub BJ, Ripley MP. 2018. Mercury, polychlorinated biphenyls, selenium, and fatty acids in tribal fish harvests of the upper great lakes. Risk Analysis 38:2029–2040. [DOI] [PMC free article] [PubMed] [Google Scholar]
- Denham M. 2005. Relationship of lead, mercury, mirex, dichlorodiphenyldichloroethylene, hexachlorobenzene, and polychlorinated biphenyls to timing of menarche among akwesasne mohawk girls. Pediatrics 115:e127–e134. [DOI] [PubMed] [Google Scholar]
- Dhakal K, Gadupudi GS, Lehmler H-J, Ludewig G, Duffel MW, Robertson LW. 2017. Sources and toxicities of phenolic polychlorinated biphenyls (oh-pcbs). Environmental Science and Pollution Research 25:16277–16290. [DOI] [PMC free article] [PubMed] [Google Scholar]
- Erickson MD. 2017. Aroclor misidentification in environmental samples: How do we communicate more effectively between the laboratory and the data user? Environmental Science and Pollution Research 25:16291–16299. [DOI] [PubMed] [Google Scholar]
- Fitzgerald EF, Hwang SA, Brix KA, Bush B, Cook K, Worswick P. 1995. Fish pcb concentrations and consumption patterns among mohawk women at akwesasne. J Expo Anal Environ Epidemiol 5:1–19. [PubMed] [Google Scholar]
- Fitzgerald EF, Brix KA, Deres DA, Hwang S-A, Bush B, Lambert G, et al. 1996. Polychlorinated biphenyl (pcb) and dichlorodiphenyl dichloroethylene (dde) exposure among native american men from contaminated great lakes fish and wildlife. Toxicology and Industrial Health 12:361–368. [DOI] [PubMed] [Google Scholar]
- Fitzgerald EF, Hwang SA, Bush B, Cook K, Worswick P. 1998. Fish consumption and breast milk pcb concentrations among mohawk women at akwesasne. American Journal of Epidemiology 148:164–172. [DOI] [PubMed] [Google Scholar]
- Fitzgerald EF, Deres DA, Hwang S-A, Bush B, Yang B-z, Tarbell A, et al. 1999. Local fish consumption and serum pcb concentrations among mohawk men at akwesasne. Environmental Research 80:S97–S103. [DOI] [PubMed] [Google Scholar]
- Fitzgerald EF, Hwang S-A, Langguth K, Cayo M, Yang B-Z, Bush B, et al. 2004. Fish consumption and other environmental exposures and their associations with serum pcb concentrations among mohawk women at akwesasne. Environmental Research 94:160–170. [DOI] [PubMed] [Google Scholar]
- Fitzgerald EF, Hwang S-A, Lambert G, Gomez M, Tarbell A. 2005. Pcb exposure and in vivo cyp1a2 activity among native americans. Environ Health Persp 113:272–277. [DOI] [PMC free article] [PubMed] [Google Scholar]
- Fitzgerald EF, Hwang S-A, Gomez M, Bush B, Yang B-Z, Tarbell A. 2007. Environmental and occupational exposures and serum pcb concentrations and patterns among mohawk men at akwesasne. Journal of Exposure Science & Environmental Epidemiology 17:269–278. [DOI] [PubMed] [Google Scholar]
- Gallo MV, Schell LM, DeCaprio AP, Jacobs A. 2011. Levels of persistent organic pollutant and their predictors among young adults. Chemosphere 83:1374–1382. [DOI] [PMC free article] [PubMed] [Google Scholar]
- Gallo MV, Deane GD, DeCaprio AP, Schell LM. 2015. Changes in persistent organic pollutant levels from adolescence to young adulthood. Environmental Research 140:214–224. [DOI] [PMC free article] [PubMed] [Google Scholar]
- Gallo MV, Ravenscroft J, Carpenter DO, Frye C, Akwesasne Task Force on the E, Cook B, et al. 2016. Endocrine disrupting chemicals and ovulation: Is there a relationship? Environmental Research 151:410–418. [DOI] [PubMed] [Google Scholar]
- Gallo MV, Ravenscroft J, Carpenter DO, Schell LM, Akwesasne Task Force on the E. 2018. Persistent organic pollutants as predictors of increased fsh:Lh ratio in naturally cycling, reproductive age women. Environmental Research 164:556–564. [DOI] [PMC free article] [PubMed] [Google Scholar]
- Goncharov A, Haase RF, Santiago-Rivera A, Morse G, McCaffrey RJ, Rej R, et al. 2008. High serum pcbs are associated with elevation of serum lipids and cardiovascular disease in a native american population. Environmental Research 106:226–239. [DOI] [PMC free article] [PubMed] [Google Scholar]
- Goncharov A, Rej R, Negoita S, Schymura M, Santiago-Rivera A, Morse G, et al. 2009. Lower serum testosterone associated with elevated polychlorinated biphenyl concentrations in native american men. Environ Health Persp 117:1454–1460. [DOI] [PMC free article] [PubMed] [Google Scholar]
- Hong CS, Xiao J, Casey AC, Bush B, Fitzgerald EF, Hwang SA. 1994. Mono-ortho- and non-ortho-substituted polychlorinated biphenyls in human milk from mohawk and control women: Effects of maternal factors and previous lactation. Arch Environ Contam Toxicol 27:431–437. [DOI] [PubMed] [Google Scholar]
- Hoover E, Cook K, Plain R, Sanchez K, Waghiyi V, Miller P, et al. 2012. Indigenous peoples of north america: Environmental exposures and reproductive justice. Environ Health Persp 120:1645–1649. [DOI] [PMC free article] [PubMed] [Google Scholar]
- Hoover E. 2013. Cultural and health implications of fish advisories in a native american community. Ecological Processes 2. [DOI] [PMC free article] [PubMed] [Google Scholar]
- Hwang S-A, Fitzgerald EF, Cayo M, Yang B-Z, Tarbell A, Jacobs A. 1999. Assessing environmental exposure to pcbs among mohawks at akwesasne through the use of geostatistical methods. Environmental Research 80:S189–S199. [DOI] [PubMed] [Google Scholar]
- Hwang S-A, Yang B-Z, Fitzgerald EF, Bush B, Cook K. 2001. Fingerprinting pcb patterns among mohawk women. Journal of Exposure Science & Environmental Epidemiology 11:184–192. [DOI] [PubMed] [Google Scholar]
- James KL, Randall NP, Haddaway NR. 2016. A methodology for systematic mapping in environmental sciences. Environmental Evidence 5. [Google Scholar]
- Kraft M, Rauchfuss K, Fromme H, Grün L, Sievering S, Köllner B, et al. 2021. Inhalation exposure to pcb from contaminated indoor air—how much is absorbed into the blood? Pollutants 1:181–193. [Google Scholar]
- Lehmann GM, Christensen K, Maddaloni M, Phillips LJ. 2015. Evaluating health risks from inhaled polychlorinated biphenyls: Research needs for addressing uncertainty. Environ Health Persp 123:109–113. [DOI] [PMC free article] [PubMed] [Google Scholar]
- Liu J, Tan Y, Song E, Song Y. 2020. A critical review of polychlorinated biphenyls metabolism, metabolites, and their correlation with oxidative stress. Chem Res Toxicol 33:2022–2042. [DOI] [PubMed] [Google Scholar]
- Mead MN. 2008. Contaminants in human milk: Weighing the risks against the benefits of breastfeeding. Environ Health Perspect 116:A427–434. [PMC free article] [PubMed] [Google Scholar]
- Megson D, Benoit NB, Sandau CD, Chaudhuri SR, Long T, Coulthard E, et al. 2019. Evaluation of the effectiveness of different indicator pcbs to estimating total pcb concentrations in environmental investigations. Chemosphere 237:124429. [DOI] [PubMed] [Google Scholar]
- Meng F, Wen D, Sloan J. 2008. Modelling of air–water exchange of pcbs in the great lakes. Atmospheric Environment 42:4822–4835. [Google Scholar]
- Morgan RL, Whaley P, Thayer KA, Schünemann HJ. 2018. Identifying the peco: A framework for formulating good questions to explore the association of environmental and other exposures with health outcomes. Environ Int 121:1027–1031. [DOI] [PMC free article] [PubMed] [Google Scholar]
- NEJAC. 2002. Fish consumption and environmental justice. Washington, DC. [Google Scholar]
- Newman J, Aucompaugh AG, Schell LM, Denham M, DeCaprio AP, Gallo MV, et al. 2006. Pcbs and cognitive functioning of mohawk adolescents. Neurotoxicology and Teratology 28:439–445. [DOI] [PubMed] [Google Scholar]
- Newman J, Gallo MV, Schell LM, DeCaprio AP, Denham M, Deane GD. 2009. Analysis of pcb congeners related to cognitive functioning in adolescents. NeuroToxicology 30:686–696. [DOI] [PMC free article] [PubMed] [Google Scholar]
- Newman J, Behforooz B, Khuzwayo AG, Gallo MV, Schell LM. 2014. Pcbs and adhd in mohawk adolescents. Neurotoxicology and Teratology 42:25–34. [DOI] [PMC free article] [PubMed] [Google Scholar]
- NYS Department of Health. 2021. St. Lawrence valley region health advice on eating fish you catch. Available: https://www.health.ny.gov/publications/2769.pdf [accessed November 16, 2021.
- Pessah IN, Lein PJ, Seegal RF, Sagiv SK. 2019. Neurotoxicity of polychlorinated biphenyls and related organohalogens. Acta Neuropathologica 138:363–387. [DOI] [PMC free article] [PubMed] [Google Scholar]
- RACER Trust. 2019. 10-million-gallon lagoon final report. [Google Scholar]
- Ravenscroft J, Schell LM, Cole Tt. 2015. Applying the community partnership approach to human biology research. American Journal of Human Biology 27:6–15. [DOI] [PubMed] [Google Scholar]
- Ravenscroft J, Schell LM, Environm ATF. 2018. Patterns of pcb exposure among akwesasne adolescents: The role of dietary and inhalation pathways. Environ Int 121:963–972. [DOI] [PubMed] [Google Scholar]
- Rock KD, Patisaul HB. 2018. Environmental mechanisms of neurodevelopmental toxicity. Curr Environ Health Rep 5:145–157. [DOI] [PMC free article] [PubMed] [Google Scholar]
- Saint Regis Mohawk Tribe. 2019. New york state fish consumption advisory affirms tribal guidelines. Available: https://www.srmt-nsn.gov/news/2019/new-york-state-fish-consumption-advisory-affirms-tribal-guidelines [accessed November 16, 2021.
- Saint Regis Mohawk Tribe. 2021. Culture and history. Available: https://www.srmt-nsn.gov/culture_and_history [accessed September 9, 2021 2021].
- Saint Regis Mohawk Tribe Environment Division. 2013a. Akwesasne family guide to eating locally-caught fish. [Google Scholar]
- Saint Regis Mohawk Tribe Environment Division. 2013b. Game advisory. [Google Scholar]
- Santiago-Rivera AL, Skawenio Morse G, Haase RF, McCaffrey RJ, Tarbell A. 2007. Exposure to an environmental toxin, quality of life and psychological distress. Journal of Environmental Psychology 27:33–43. [Google Scholar]
- Schell LM, Hubicki LA, DeCaprio AP, Gallo MV, Ravenscroft J, Tarbell A, et al. 2003. Organochlorines, lead, and mercury in akwesasne mohawk youth. Environ Health Persp 111:954–961. [DOI] [PMC free article] [PubMed] [Google Scholar]
- Schell LM, Gallo MV, DeCaprio AP, Hubicki L, Denham M, Ravenscroft J. 2004. Thyroid function in relation to burden of pcbs, p,p′-dde, hcb, mirex and lead among akwesasne mohawk youth: A preliminary study. Environmental Toxicology and Pharmacology 18:91–99. [DOI] [PubMed] [Google Scholar]
- Schell LM, Ravenscroft J, Cole M, Jacobs A, Newman J. 2005. Health disparities and toxicant exposure of akwesasne mohawk young adults: A partnership approach to research. Environ Health Persp 113:1826–1832. [DOI] [PMC free article] [PubMed] [Google Scholar]
- Schell LM, Gallo MV, Denham M, Ravenscroft J, DeCaprio AP, Carpenter DO. 2008. Relationship of thyroid hormone levels to levels of polychlorinated biphenyls, lead,p,p′-dde, and other toxicants in akwesasne mohawk youth. Environ Health Persp 116:806–813. [DOI] [PMC free article] [PubMed] [Google Scholar]
- Schell LM, Gallo MV, Ravenscroft J, DeCaprio AP. 2009. Persistent organic pollutants and anti-thyroid peroxidase levels in akwesasne mohawk young adults. Environmental Research 109:86–92. [DOI] [PMC free article] [PubMed] [Google Scholar]
- Schell LM, Gallo MV, Deane GD, Nelder KR, DeCaprio AP, Jacobs A. 2014. Relationships of polychlorinated biphenyls and dichlorodiphenyldichloroethylene (p,p’ -dde) with testosterone levels in adolescent males. Environ Health Persp 122:304–309. [DOI] [PMC free article] [PubMed] [Google Scholar]
- Sokol RC, Kwon OS, Bethoney CM, Rhee GY. 1994. Reductive dechlorination of polychlorinated biphenyls in st. Lawrence river sediments and variations in dechlorination characteristics. Environ Sci Technol 28:2054–2064. [DOI] [PubMed] [Google Scholar]
- Sukdolova V, Negoita S, Hubicki L, DeCaprio A, Carpenter DO. 2000. The assessment of risk to acquired hypothyroidism from exposure to pcbs: A study among akwesasne mohawk women. Cent Eur J Public Health 8:167–168. [PubMed] [Google Scholar]
- U.S. EPA. 2003. Framework for cumulative risk assessment. EPA/600/P-02/001F, 2003. Washington Office, Washington, DC. [Google Scholar]
- U.S. EPA. 2010. Recommended toxicity equivalence factors (tefs) for human health risk assessments of 2,3,7,8-tetrachlorodibenzo-p-dioxin and dioxin-like compounds EPA/100/R - 10/005. Washington, DC. [Google Scholar]
- U.S. EPA. 2011. Exposure factors handbook: 2011 edition (final). EPA/600/R-09/052F. Washington, D.C. [Google Scholar]
- U.S. EPA. 2012. Polychlorinated biphenyls (pcbs) in school buildings: Sources, environmental levels, and exposures. EPA/600/R-12/051|. Washington, D.C. [Google Scholar]
- U.S. EPA. 2020. Fourth five-year review report for the gm massena central foundry superfund site. New York, New York. [Google Scholar]
- U.S. EPA. 2021a. Hazardous waste cleanup: Reynolds metals company in massena, new york. Available: https://www.epa.gov/hwcorrectiveactionsites/hazardous-waste-cleanup-reynolds-metals-company-massena-new-york [accessed November 16, 2021. [Google Scholar]
- U.S. EPA. 2021b. Hazardous waste cleanup: Alcoa incorporated in massena, new york. Available: https://www.epa.gov/hwcorrectiveactionsites/hazardous-waste-cleanup-alcoa-incorporated-massena-new-york [accessed November 16, 2021. [Google Scholar]
- U.S. EPA. 2021c. General motors (central foundry division) massena, ny. Available: https://cumulis.epa.gov/supercpad/cursites/csitinfo.cfm?id=0201644 [accessed November 16, 2021. [Google Scholar]
- U.S. EPA. 2021d. Fourth five-year review report for the reynolds metals superfund site. New York, New York. [Google Scholar]
- Vorhees DJ, Cullen AC, Altshul LM. 1997. Exposure to polychlorinated biphenyls in residential indoor air and outdoor air near a superfund site. Environ Sci Technol 31:3612–3618. [Google Scholar]
- Weitekamp CA, Phillips LJ, Carlson LM, DeLuca NM, Cohen Hubal EA, Lehmann GM. 2021. A state-of-the-science review of polychlorinated biphenyl exposures at background levels: Relative contributions of exposure routes. Sci Total Environ 776. [DOI] [PMC free article] [PubMed] [Google Scholar]
- Wilson JF. 2004. Balancing the risks and benefits of fish consumption. Annals of Internal Medicine 141:977–980. [DOI] [PubMed] [Google Scholar]
- Wolff MS, Camann D, Gammon M, Stellman SD. 1997. Proposed pcb congener groupings for epidemiological studies. Environ Health Perspect 105:13–14. [DOI] [PMC free article] [PubMed] [Google Scholar]
- Wolffe TAM, Whaley P, Halsall C, Rooney AA, Walker VR. 2019. Systematic evidence maps as a novel tool to support evidence-based decision-making in chemicals policy and risk management. Environ Int 130:104871. [DOI] [PMC free article] [PubMed] [Google Scholar]
- Worcester Public Schools. 2021. Pcbs. Available: https://worcesterschools.org/about/departments-offices/facilities-management/environmental-management/pcbs/ [accessed October 14, 2021 2021].
Associated Data
This section collects any data citations, data availability statements, or supplementary materials included in this article.