

Abstract
Successional theory proposes that fast growing and well dispersed opportunistic species are the first to occupy available space. However, these pioneering species have relatively short life cycles and are eventually outcompeted by species that tend to be longer-lived and have lower dispersal capabilities. Using Autonomous Reef Monitoring Structures (ARMS) as standardized habitats, we examine the assembly and stages of ecological succession among sponge species with distinctive life history traits and physiologies found on cryptic coral reef habitats of Kāneʻohe Bay, Hawaiʻi. Sponge recruitment was monitored bimonthly over 2 years on ARMS deployed within a natural coral reef habitat resembling the surrounding climax community and on ARMS placed in unestablished mesocosms receiving unfiltered seawater directly from the natural reef deployment site. Fast growing haplosclerid and calcareous sponges initially recruited to and dominated the mesocosm ARMS. In contrast, only slow growing long-lived species initially recruited to the reef ARMS, suggesting that despite available space, the stage of ecological succession in the surrounding habitat influences sponge community development in uninhabited space. Sponge composition and diversity between early summer and winter months within mesocosm ARMS shifted significantly as the initially recruited short-lived calcareous and haplosclerid species initially recruit and then died off. The particulate organic carbon contribution of dead sponge tissue from this high degree of competition-free community turnover suggests a possible new component to the sponge loop hypothesis which remains to be tested among these pioneering species. This source of detritus could be significant in early community development of young coastal habitats but less so on established coral reefs where the community is dominated by long-lived colonial sponges.
Subject terms: Biodiversity, Community ecology, Ecosystem ecology, Molecular ecology
Introduction
Understanding species compositional variation across temporal scales is a central goal in community ecology and fundamental for predicting the process of community development under environmental or anthropogenic change1. In terrestrial systems, when physical or biological disturbances open space for species to occupy, species composition varies according to the stage of ecological succession within the habitat which is influenced by life history traits among species2–4. During early succession, fast growing and well dispersed opportunistic species grow first5. However, these species have relatively short life cycles and are eventually displaced by more competitive ones that tend to have lower dispersal capabilities but live longer6. Similar patterns of succession are prevalent across temperate and neotropical forests. While the patterns of ecological succession in terrestrial systems have been observed over centuries2,3,7 marine systems such as coral reefs have received far less attention8–10.
Coral reefs are one of the most biologically rich ecosystems on the planet11. The considerable diversity within this ecosystem is primarily attributed to the species occupying the cryptobenthic spaces within the reef framework12–14 which are largely overlooked, and can harbor up to 90% of the reef volume and about 50% of reef surface area15–17. Sponges are a diverse group of sessile benthic organisms that can comprise up to 73% of the biomass in cryptic habitats18 in the Caribbean and 60% of the surface area19 within these cryptic habitats in the Red Sea. Sponges are pivotal in sustaining the diversity in these ecosystems through their essential role in nutrient uptake and release20,21. Unlike surface-dwelling macrosponges that assimilate dissolved organic matter (DOM) primarily for somatic growth22, encrusting and predominantly cryptic sponges use a large portion of their DOM uptake (up to 58%) to fuel rapid cell turnover23. Thus, somatic growth for cryptic sponges is assumed to be close to zero since newly formed cells largely replace old cells which are released as detritus23,24. This released detritus feeds detritivorous invertebrates thereby fueling the coral reef food web25 and making cryptic sponges functionally critical to coral reef ecosystems26. Yet despite their functional importance, we know very little about the ecological succession and temporal variability of this important and understudied group of organisms.
Previous work on the succession of Caribbean cryptic reef fauna under ledges and within caves showed that sponges with colonial behavior dominate after pioneering stages27. By increasing their persistence over time through lateral expansion, colonial organisms have an advantage over solitary organisms by completely overgrowing space-limited hard substrata28,29. While previous studies of cryptobenthic succession provided invaluable insight on colonization and competition of forms, they were limited by taxonomic resolution of Porifera as a phylum. Porifera are notoriously difficult to identify to species, but such identification is essential because groups have distinctive life history traits and physiologies that could influence the succession of these communities. Orders within the most abundant and specious sponge class (Demospongiae) have a variety of growth morphologies30, life history traits31,32, reproductive strategies33, and chemical defense mechanisms against predators34 – the latter being a tradeoff with rapid growth35. On the other hand, the Calcarea are a small, inconspicuous sponge class36 that tend to be more solitary than colonial and can reproduce throughout the year exhibiting high fecundity but are short lived37–39. In addition to the taxonomic challenges with identifying sponges, previous studies on cryptobenthic succession have primarily been limited to caves and ledges because these environments could easily be observed and monitored. However, the vast diversity of sponges are hidden deep within the interstices of the reef framework19, rendering observational and sampling difficulties. As a result, few studies have targeted the cryptobenthic succession of these functionally important sponges.
Standardized artificial sampling devices, such as Autonomous Reef Monitoring Structures (ARMS), overcome cryptobenthic sampling constraints by providing suitable habitat for cryptobenthic marine invertebrates to colonize. ARMS were explicitly designed as a tiered structure to mimic the three-dimensional complexity of the reef and provide unobtrusive access to these elusive cryptobiota40–42. In a recent study targeting Hawaiian sponge diversity, ~ 100 new records were documented from the interstitial spaces of the ARMS, despite field surveys covering more than two orders of magnitude more area (1750 m2 of reef habitat) than the ARMS (15 m2)43,44. The proven success of ARMS in capturing a rich diversity of cryptic sponges, combined with the ease by which the structure is disassembled and reassembled, provides an unprecedented opportunity to evaluate the stages of ecological succession among cryptobenthic sponges.
Here we examine sponge community development over two years in ARMS deployed on an established coral reef habitat resembling the local climax community and within ARMS placed in mesocosms receiving unfiltered seawater from the same reef. We report temporal trends in sponge community composition and investigate whether adaptive strategies or physiological constraints among Porifera groups influence the order in which they occupy cryptic spaces throughout ecological succession.
Materials and methods
Site locations
Modified two-tiered ARMS (Figure S1b in Vicente et al. (2021)) were used to examine the temporal recruitment of cryptobenthic sponges in mesocosms and natural reef environments. Sponges were sampled every other month for two years (July 2016-June 2018) from six replicate ARMS placed in mesocosms receiving unfiltered, flow-through seawater from an intake pipe along the adjacent reef and from six replicates attached to the bottom of the intake pipe and 2 m away from the intake opening at the Hawaiʻi Institute of Marine Biology (HIMB) on Moku o Loʻe (Coconut Island). The intake pipe is suspended 1 m above the reef and faces the reef slope. Herein, ARMS recovered from the mesocosm tanks are referred to as “mesocosm ARMS”, and those retrieved from the intake pipe are labeled as “reef ARMS” (Figure S1c in Vicente et al. (2021)).
Mesocosm flow-through system
The flow-through system at HIMB is fed by alternating seawater pumps with intake lines ~ 2 m deep on the adjoining reef flat, and the active line is switched and flushed every two months to prevent fouling within the pipes. This creates consistent incoming water flow with a residence time of 57 min and allows for an influx of larvae directly sourced from the coral reef adjacent to the reef ARMS. Unfiltered seawater from this system fed six replicate mesocosm tanks (70 L) that were set up to mimic the Hawaiian reef community. Considering a mesocosm tank volume of 70 L and an inflow rate of ~ 1.2 L min−1 mean residence time was estimated to be roughly 1 h in all mesocosm tank replicates, well in excess of minimum recommendations45. Each mesocosm contained the eight most common Hawaiian reef-building coral species (Porites compressa, Porites lobata, Porites evermanni, Pocillopora acuta, Pocillopora meandrina, Montipora capitata, Montipora flabellata and Montipora patula) that collectively account for greater than 95% of coral cover in the state of Hawai‘i46,47. These corals were placed on a plastic platform above 2 cm of carbonate sand and gravel, and a collection of 3 pieces of reef rubble (roughly 10–20 cm) were collected from the adjacent reef habitat48. Each mesocosm tank also contained herbivorous reef snails (Trochus spp.) a juvenile Threadfin butterflyfish (Chaetodon auriga), a juvenile Convict tang (Acanthurus triostegus), and the two-tiered ARMS placed beneath the coral platform to simulate the cryptobenthic habitat of the living reef matrix at biomass values similar to those reported for Hawaiian reef fishes49. In addition to ~ 1.2 L min−1 of inflowing unfiltered seawater (turnover), water circulation within each mesocosm tank was generated with a Maxi-Jet Pro propeller seawater pump (~ 4900 L hr−1 flow) to closely simulate adjacent reef conditions. Chemical and physical parameters of mesocosm ARMS simulating ambient open reef habitats are reported in Timmers et al. (2021) and Jury et al. (2021) as “control”. Temperature data from both mesocosm and reef habitats were monitored throughout (Supplementary Figure S1). Temperature values of mesocosms were meant to simulate mean values for open reef habitats of Kāneʻohe Bay, Hawaiʻi48,50 and averaged 0.64 ± 0.06 °C warmer during 18 out of the 23 months of temperature recordings than the adjoining reef habitat at the HIMB.
Sponge identification
At each sampling period, modified ARMS were disassembled, photographed with a Nikon D7100 and Nikkor 60 mm lens, and were carefully examined for any newly settled sponge recruits. Sponges showing unique morphological features on each plate were individually photographed, subsampled, DNA barcoded, categorized into solitary or colonial, and classified to species or operational taxonomic units (OTUs) following Vicente et al. (2021). Due to the taxonomic challenges associated with this group51, and the limited number of species descriptions that currently exists for the majority of these highly understudied cryptic sponge taxa we used individual OTUs as our proxy for species. A total of 314 sponges were collected and vouchered during this survey. All sequences were deposited in GenBank. Accession numbers pertaining to either COI sequences, 28S rRNA sequences or sequences from both loci were provided for 87 vouchers and the remaining 219 vouchers were identified by matching morphological features to the 87 vouchers with DNA accession numbers (Supplementary Table S1) or the 616 voucher specimens with accession numbers reported in Vicente et al. (2021). A classification table was generated for each OTU following Vicente et al. (2021) (Supplementary Table S2). All OTUs were vouchered with the Florida Museum of Natural History at the University of Florida and the HIMB. In situ images of voucher specimens with the FMNH voucher acronym (UF) (Supplementary Table S1) are publicly available at https://www.invertebase.org/portal/checklists/checklist.php?clid=14&pid=where and http://specifyportal.flmnh.ufl.edu/iz/.
Monitoring temporal sponge diversity and abundance
Vouchered and barcoded sponges were labeled on high-resolution images of individual modified ARMS plates. Metadata for each sponge included: date, ARMS number, plate number (1 through 3), and side of the plate (top or bottom). Each individual sponge was monitored through time using the initial position of recruits as a reference. Alpha diversity estimates were calculated as the total number of OTUs encountered per ARMS at a given time point. For each ARMS, the abundance of each OTU was based on the presence of that OTU on each side of the three plates resulting in values between 0 and 6. When considering the abundance of multiple or all OTUs on an ARMS, the abundance value could range between 1 and 438 for all 73 OTUs ARMS-1.
Data analysis
Data was analyzed and visualized using R v.3.6.352. Observed richness, Shannon and Simpsons indices were calculated using the estimate_richness function from the ‘vegan v.2.5-653 package (Supplementary Table S3). We used the specaccum function to generate OTU richness rarefaction curves for comparison between habitat types. Mean cumulative differences in sponge abundance and observed diversity were analyzed using parametric (t.test function) and nonparametric (wilcox.test function) paired t-tests. The ‘nlme v.3.1-151′54 package with repeated-measures ANOVA and multilevel modeling were used to compare mean differences in species richness and abundance of sponges across time points using the lme function. We tested three models (1) a base linear mixed effect model (lme function) with ‘time’ and ‘habitat’ as fixed effects and ‘ARMS number’ as a random effect; (2) the base model with compound symmetry; and (3) the base model with autoregressive lag 1 (corAR1) covariance structure. The autoregressive lag 1(corAR1) covariance structure produced the best model based on an ANOVA model comparison. Residuals were normally distributed (QQ-plot linearity between residuals and quantiles) and randomly distributed (residuals vs number of OTUs and abundance of OTUs). The homogeneity of variance (HOV) assumption for abundance was both visually inspected with box plots of residuals vs. fitted values showing similar variation across residuals55 and tested through a Levene’s test (p = 0.303). HOV for richness was confirmed visually with boxplots showing similar variation across residuals. Significant Tukey’s post hoc pairwise comparisons using the R package ‘lsmeans’ v.2.3056 was used to measure significant differences (p < 0.05) in sponge diversity and abundance between habitats at different time points.
Nonmetric multidimensional scaling (NMDS) (metaMDS function) was used to plot sponge community composition between time points showing peak (June 2017) and minimum (November 2017) recruitment periods. Bray–Curtis dissimilarity indices were computed (vegdist function) on square-root transformed sponge OTU abundance. Permutational analysis of multivariate dispersion (PERMDISP – betadisper function) was performed to examine community dispersion of OTUs between habitat types and at time points showing peak and minimum recruitment throughout the two years. Permutational analysis of variance (PERMANOVA – adonis function) was used to analyze sponge community composition among habitats and time points based on 1000 permutations. OTUs responsible for significant temporal shifts (p = 0.01) within the sponge community composition were identified as vectors and plotted within NMDS plots using the envfit function. Nonparametric Kruskal–Wallis tests identified sponge classes or orders responsible for significant shifts (p < 0.05) in community composition between the two time points. All figures were generated using the R package ‘ggplot 2’ v3.3.357.
Results
Cumulative sponge diversity and abundance in mesocosms and reef habitats
A total of 73 sponge OTUs recruited onto ARMS throughout the 2-year monitoring period (Supplementary Figure S2). Sponge diversity was greatest in class Demospongiae (52 OTUs), followed by Calcarea (13 OTUs) and Homoscleromorpha (8 OTUs). Orders Haplosclerida (18 OTUs), Suberitida (12 OTUs), Poecilosclerida (7), Tethyida (4 OTUs), Tetractinellida (5 OTUs), Dictyoceratida (2 OTUs) and Dendroceratida (2 OTUs) contributed to the overall diversity within Demospongiae (Supplementary Figures S2 and S3). OTUs that were less abundant and not assigned to specific orders within demosponges included Verongimorpha sp. 1 and Heteroscleromorpha sp. 9 (Supplementary Figure S3). Distinct differences in community richness between mesocosm and reef habitats were observed, where 36 OTUs were confined to mesocosms, 18 OTUs were found only on reefs, and 19 OTUs were shared between habitats (Supplementary Figure S2). The proportion of OTUs exhibiting colonial growth was higher on reef ARMS (73%) than mesocosm ARMS (58%) (Supplementary Figure S4). Total richness and abundance of sponge recruits to mesocosm ARMS (diversity = 52 OTUs, abundance = 2130 individuals) exceeded reef ARMS (diversity = 37 OTUs, abundance = 1065 individuals) (Fig. 1; Supplementary Table S3). Higher total richness and abundance of sponge recruits in mesocosms were mainly attributed to sponges in the class Calcarea (diversity = 9 OTUs, abundance = 551 individuals) and Order Tetractinellida (diversity = 5 OTUs, abundance = 257 individuals) (Supplementary Table S3). Calcareous sponges in mesocosms significantly exceeded those on the reef by a mean difference of 3.12 OTUs ARMS−1 (t (7.70) = 5.84, pWelch =< 0.0001; pWilcoxon = 0.0042) and a mean abundance of 72.50 individuals ARMS−1 (t (5.94) = 8.36, pWelch =< 0.0001; pWilcoxon = 0.0040). Tetractinellid sponges in mesocosms exceeded those on the reef by a mean difference of 2.17 OTUs ARMS−1 (t(5.00) = 5.40, pWelch =< 0.0029; pWilcoxon = 0.0023) and 42.83 individuals ARMS−1 t(7.70) = 5.84, pWelch = 0.0043; pWilcoxon = 0.0028)) (Supplementary Figure S5; Table 1).
Figure 1.
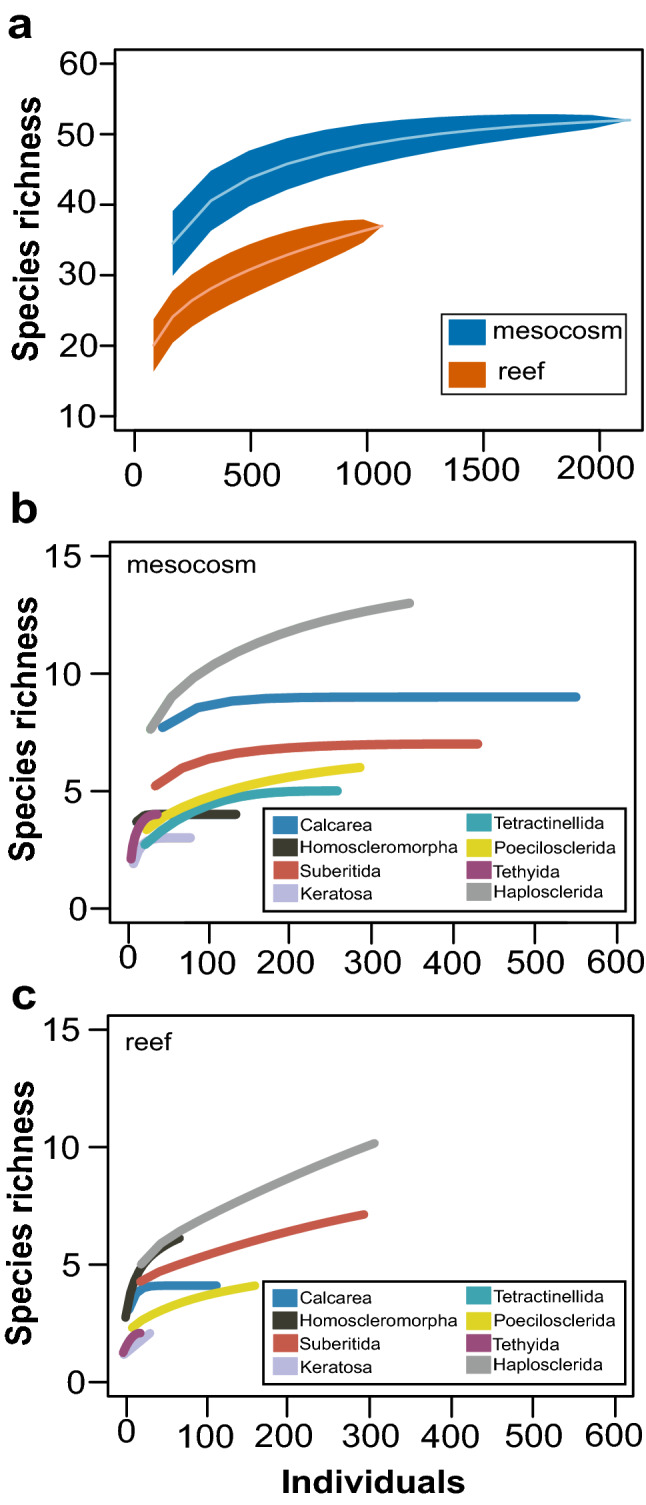
Species rarefraction curves of (a) all sponges in mesocosm and reef ARMS, and sponges separated by most abundant groups found in (b) mesocosm and (c) reef ARMS. Number of individuals refers to sponge recruits encountered at different time points based on presence/absence of sponge OTU within each side of plate from an ARMS. 95% Confidence intervals are included for rarefraction curve in (a).
Table 1.
Parametric (Welch Two Sample t-test) and nonparametric (Wilcoxon Rank Sum Test) paired t test results comparing cumulative observed diversity and abundance from different sponge groups from reef and mesocosm ARMS.
| Test | Taxa group | Classification | Mean difference | Welch two sample t test | Wilcoxon rank | ||||
|---|---|---|---|---|---|---|---|---|---|
| CI | CI | t | df | p value | Sum test p value | ||||
| Diversity | Phylum | Porifera | 3.50 | − 1.17 | 8.17 | 1.85 | 5.80 | 0.1157 | 0.2442 |
| Class | Calcarea | 3.12 | 1.91 | 4.43 | 5.84 | 7.70 | < 0.0001 | 0.0042 | |
| Homoscleromorpha | 1.16 | − 2.50 | 0.17 | − 2.00 | 8.36 | 0.0785 | 0.1113 | ||
| Subclass | Keratosa | 0.17 | − 0.96 | 0.62 | − 0.54 | 5.00 | 0.6109 | 0.5982 | |
| Order | Suberitida | 1.17 | − 2.63 | 3.50 | − 1.78 | 9.80 | 0.1054 | 0.1380 | |
| Tetractinellida | 2.17 | 1.13 | 3.20 | 5.40 | 5.00 | 0.0029 | 0.0023 | ||
| Poecilosclerida | 0.00 | − 1.28 | 1.28 | 0.00 | 6.76 | 1.0000 | 1.0000 | ||
| Tethyida | 0.33 | − 0.61 | 1.28 | 0.79 | 9.41 | 0.4487 | 0.4315 | ||
| Haplosclerida | 0.67 | − 0.51 | 1.85 | 1.26 | 9.75 | 0.2353 | 0.3396 | ||
| Abundance | Phylum | Porifera | 177.50 | 142.68 | 213.32 | 11.08 | 9.75 | < 0.0001 | 0.0022 |
| Class | Calcarea | 72.50 | 51.22 | 93.78 | 8.36 | 5.94 | < 0.0001 | 0.0040 | |
| Homoscleromorpha | 10.17 | − 8.44 | 28.88 | 1.25 | 8.29 | 0.2446 | 0.4848 | ||
| Subclass | Keratosa | 6.84 | − 7.81 | 21.48 | 1.12 | 6.46 | 0.3017 | 0.7475 | |
| Order | Suberitida | 22.34 | − 10.02 | 54.68 | 1.58 | 8.44 | 0.1513 | 0.1727 | |
| Tetractinellida | 42.83 | 50.56 | 65.11 | 4.94 | 5.00 | 0.0043 | 0.0028 | ||
| Poecilosclerida | 20.33 | − 10.31 | 50.97 | 1.59 | 6.50 | 0.1583 | 0.2403 | ||
| Tethyida | 2.53 | − 4.72 | 8.72 | 0.71 | 6.67 | 0.5014 | 0.8092 | ||
| Haplosclerida | 6.17 | − 15.99 | 28.33 | 0.63 | 8.94 | 0.5444 | 0.7483 | ||
Significant values are in bold.
Temporal distribution of sponge diversity and species abundance
The linear mixed-effects ANOVA showed significant interactive effects of time and habitat on the number of sponge OTUs (F12,120 = 3.17, p =< 0.0001) (Fig. 2a) and abundance of OTUs (F12,120 = 6.74, p =< 0.0001) that recruited onto ARMS (Fig. 2b Table 2). Diversity and abundance of sponges under mesocosm conditions peaked after 11 months during summer (15.5 ± 1.3 (SE) OTUs, 39.0 ± 1.6 OTU abundance) which exceeded recruitment of sponges on the reef by 8 OTUs ARMS−1 and exceeded abundance by 24.5 ARMS−1 (p = 0.0001) (Fig. 2) at the same time point. Following this peak, there was a decline in both diversity and abundance of OTUs in mesocosms, and by month 16, they became much more similar to values observed in the reef ARMS (11.7 ± 1.6 OTUs, 30.7 ± 2.5 OTU abundance). Tukey’s post-hoc pairwise comparisons showed that the decrease in OTU abundance (p = 0.0416), but not diversity (p > 0.05), of mesocosm ARMS between these two time points was significant (Table 2). In contrast to the mesocosms, diversity and abundance of sponge OTUs that recruited to reef ARMS showed a steady increase with time, reaching a maximum mean diversity similar to that after the mesocosm ARMS declined (11.7 ± 0.9 OTUs) but with statistically insignificant lower mean abundance of 22.7 ± 1.9 throughout the 2 years (Fig. 2).
Figure 2.

Temporal recruitment of (a) sponge OTUs and (b) abundance of OTUs settling on mesocosm and reef ARMS in Kāneʽohe Bay. The left panel shows temporal recruitment, monitored bimonthly for approximately 2 years (July 2016 through June 2018). Peak diversity and abundance were observed at 11 months (June 2017) and was lowest at 16 months (November 2017) thereafter. Significant ANOVA results of the interactive effects of time and habitat are reported. Significant differences in diversity/abundance between the two time points (right panel) were observed in mesocosm ARMS as indicated by significant p values of Tukey’s post-hoc pairwise comparisons. Significant differences were also observed between mesocosm and reef ARMS. Line graphs are presented with lower and upper pointwise confidence intervals. Boxplots show median values as bars for each habitat; boxes show the upper and lower quartile; whiskers indicate the least and greatest value, excluding outliers. Mean values are shown as black circles and red circles are outliers.
Table 2.
Results of the linear mixed effects ANOVA on number of OTUs and abundance by habitat and date.
| Linear mixed effects ANOVA | Factor | numDF | denDF | F value | p value | |
|---|---|---|---|---|---|---|
| Number of OTUs | Habitat | 1.00 | 10 | 13.76 | 0.0040 | |
| Date | 12.00 | 120 | 22.62 | < 0.0001 | ||
| Habitat*Date | 12.00 | 120 | 3.17 | < 0.0001 | ||
| Abundance | Habitat | 1.00 | 10 | 114.04 | < 0.0001 | |
| Date | 12.00 | 120 | 36.39 | < 0.0001 | ||
| Habitat*Date | 12.00 | 120 | 6.74 | < 0.0001 | ||
| Post-hoc (Tukey Test) | Pairwise comparison (Habitat * Date) | Estimate | SE | df | t.ratio | p value |
|---|---|---|---|---|---|---|
| Number of OTUs | (2017-06-07 mesocosm)—(2017-06-07 reef) | 8.00 | 1.39 | 10 | 5.75 | 0.0150 |
| Abundance | (2017–06-07 mesocosm)—(2017-06-07 reef) | 24.50 | 2.40 | 10 | 10.21 | 0.0001 |
| (2017-06-07 mesocosm)—(2017–11-21 mesocosm) | 8.33 | 2.18 | 120 | 3.83 | 0.0416 |
Community composition among Porifera at peak and minimum recruitment differed between reef and mesocosm ARMS (PERMANOVA: F1,20 = 3.44; R2 = 0.49; p = 0.0010) (Fig. 3a; Table 3). No significant differences in community composition were observed for the time point main effect or interactive effects between habitat and time point (Fig. 3). Significant differences in community composition between peak and minimum recruitment were driven by Calcareous sponges in mesocosms (PERMANOVA: F1,10 = 4.21; R2 = 0.30; p = 0.0160) (Fig. 3b, c; Table 3), and not a result of differences in within-group variability (PERMDISP: p > 0.05, Supplementary Table S6).
Figure 3.

Community composition using multidimensional scaling of Bray–Curtis distances of (a) all sponges in mesocosm (in blue) and reef ARMS (in orange) at time points showing peak recruitment at 11 months (June 2017 as triangles) and minimum recruitment at 16 months (November 2017 as circles) thereafter. Community composition of dominant sponge classes (b) Demospongiae and (c) Calcarea from mesocosm conditions were also analyzed separately. Community composition for the two time points is outlined by blue and pink convex hulls. Significant PERMANOVA results are reported for significant differences in habitat types (a) and within the sponge class Calcarea (c) in mesocosm ARMS. Vectors in (a), and (b), show OTUs responsible for significant temporal shifts (p = 0.01) within the sponge community composition.
Table 3.
Permutational analysis of variance (PERMANOVA) based on Bray–Curtis distances between mesocosm and reef ARMS on time points showing peak and minimum sponge recruitment.
| PERMANOVA | Factor | DF | SS | R2 | F value | p value | |
|---|---|---|---|---|---|---|---|
| Habitat and time points | All sponges | Time point | 1 | 0.16 | 0.02 | 1.02 | 0.3167 |
| Habitat | 1 | 3.44 | 0.49 | 21.87 | 0.0010 | ||
| Time point * habitat | 1 | 0.23 | 0.03 | 1.46 | 0.2138 | ||
| Residual | 20 | 3.15 | 0.45 | – | – | ||
| Within mesocosm | Demospongiae | Time point | 1 | 0.13 | 0.07 | 0.75 | 0.6074 |
| Residuals | 10 | 1.70 | 0.93 | – | – | ||
| Calcarea | Time point | 1 | 0.44 | 0.30 | 4.21 | 0.0160 | |
| Residuals | 10 | 1.04 | 0.70 | – | – | ||
Analysis was also performed on the most dominant sponge classes within mesocosm ARMS. Significance is based on p < 0.05.
Significant values are in bold.
Significant differences through time within the Calcarea were due to a decrease in abundance of Leucosolenida sp. 1 (OTU15), and Clathrinidae sp. 2 (OTU 8) from 11 months during summer to 16 months in early winter (Fig. 3c). The number of Calcareous OTUs and abundance at 11 months (4.8 ± 0.6 (SE) OTUs/11.7 ± 2.1 OTU abundance) significantly exceeded Calcarea at 16 months (2.3 ± 0.5 (SE) OTUs/5.5 ± 1.3 OTU abundance) (chi-square = 5.96, df = 1, p = 0.0147 (diversity); chi-square = 5.45, df = 1, p = 0.0196 (abundance) Fig. 4; Supplementary Table S7). The Order Haplosclerida also contributed to a decrease in overall sponge diversity from 11 months (3.3 ± 0.3 OTUs/6.8 ± 0.5 OTU abundance) to 16 months (2.0 ± 0.4 OTUs/3.8 ± 1.0 OTU abundance) (chi-square = 4.37, df = 1, p = 0.0365 (diversity); chi-square = 5.53, df = 1, p = 0.0187 (abundance) Supplementary Figure S6a, Supplementary Table S7). No significant differences between the two time points were observed for other common orders to both habitat types, such as Poecilosclerida (Supplementary Figure S6b), Suberitida (Supplementary Figure S6b) or Tetractinellida (Supplementary Figure S6c; Supplementary Table S7).
Figure 4.

Temporal recruitment of (a) sponge OTUs and (b) abundance of OTUs settling on mesocosm (left panel) and reef ARMS (right panel). OTUs are presented by sponge classes Calcarea (in purple), Demospongiae (in black) and Homoscleromorpha (in yellow). Line graphs are presented with lower and upper pointwise confidence intervals.
Discussion
The process and stages of ecological succession for the Hawaiian cryptic sponge community differed between ARMS in mesocosms and those on the adjacent reef. Higher recruitment resulted in mesocosm ARMS reaching carrying capacity in one year, at more than double the abundance and richness of sponge OTUs observed on the reef ARMS, which continued to increase in diversity and abundance throughout the two years. Interestingly, the calcareous, haplosclerid and tetractinellid sponges which were responsible for the higher cumulative diversity and abundance observed in mesocosms were rarely observed if not absent on reef ARMS. However, this increased diversity in the mesocosm ARMS was ephemeral; five months after reaching maximum recruitment during the summer, overall richness and abundance in early winter significantly declined due to the reduction in calcareous and haplosclerid sponges. Similar seasonal trends in individual abundance have been reported for the calcareous sponge Clathrina aurea in south-eastern Brazil58. In contrast, recruitment to the reef ARMS was slower and more consistent, steadily increasing diversity throughout the two-year monitoring period, never reaching an asymptote. Unlike mesocosm ARMS, the reef ARMS were dominated by individuals belonging to the class Homoscleromorpha and orders Poecilosclerida, Tethyida, Keratosa, and Suberitida within the class Demospongiae.
Previous studies found that it takes at least three years for cryptic communities in tropical reefs to develop27 which might explain why recruitment on reef ARMS did not climax after two years. However, community differences between time points on reef ARMS never transitioned between species as observed in mesocosm ARMS during the same period. Thus, we argue that our inability to observe maximum recruitment after a year on the reef was due to the absence of calcareous and haplosclerid sponges which were only present during pioneering stages of community development. Even though the mesocosm and reef ARMS were ~ 15 m apart, it is possible that the isolation of the mesocosm ARMS from the overall reef could have triggered a true pioneering stage of the cryptobenthic community with the settlement of fast growing but short-lived sponge species. Although mesocosms were established with corals, fish, snails, sand, and rubble to simulate the reef environment48, these components do not recreate a fully developed community within the reef matrix. In contrast, reef ARMS were deployed on a mature reef where corals have accounted for 40–60% of benthic cover in the past 20 years59. Such long stability in the ecosystems surpasses the time observed for other cryptic communities to reach a climax community. Therefore, we assume that the pioneering stage on this reef has long passed, and a climax cryptobenthic community is already established. Replacement of highly dispersive, solitary and short-lived species by more competitive slower growing and colonial species is characteristic of other systems5, including sponges on Caribbean reefs28. However, we can discount direct competition as the mechanism by which this replacement occurs because image analyses through time showed that calcareous and haplosclerid sponges were not overgrown or smothered by competitors, but simply disappeared from individual ARMS plates between sampling periods (Fig. 5; Supplementary Figure S7). In addition, the growing behavior of calcareous and haplosclerid OTUs in mesocosm ARMS exhibited solitary form, as opposed to more dominant sponges growing in situ which exhibited colonial behavior and the ability to expand laterally28 (Supplementary Figure S8). Thus, we hypothesize that being embedded within a mature reef community allowed recruitment of more competitive, slower growing sponges with colonial growth (Supplementary Figure S4) through lateral expansion to recruit onto reef ARMS.
Figure 5.

Recruitment of calcareous OTUs from a subsection of a mesocosm ARMS plate through four time points capturing a decrease in diversity and abundance of Calcarea from 2017-06-07 (11 months) through 2017-11-20 (16 months).
Without evidence for direct overgrowth of calcareous and haplosclerid sponges, some other differences in biotic or abiotic factors must drive the observed differences in cryptic sponge community succession in this system. Differences in succession between the reef and mesocosm ARMS could be related to a variety of factors that differ between them, such as 1. larval supply, 2. temperature, 3. sedimentation, 4. flow, or 5. nutrition as some of the obvious possibilities. Although our experiment was not set up to test these alternatives, we have some anecdotal evidence to address each. First, it is possible that the composition of larval supply to the mesocosms is different than on the reef, but we used unfiltered seawater pumped directly from the same reef which proved to supply hundreds of species to recruit to the mesocosms over the course of this experiment50. Second, as warming has been shown to increase growth and recruitment in some studies60,61, the average increase in temperature of 0.64 °C within the mesocosms (Supplementary Figure S1) could have augmented recruitment to the mesocosms. However, Timmers et al. (2021) found that sponge diversity was unaffected by a + 2 °C warming, making it unlikely that warmer temperatures in the mesocosms were responsible for the differences observed here. Third, sedimentation can obstruct recruitment success of sponge larvae62 but ARMS from reef and mesocosms had very little sediment accumulation between sampling periods (JV’s personal observations) and any sediment that was present on the ARMS plates in both habitats was cleared during each sampling period. Fourth, water flow has been shown to impact community composition47 recruitment63, and bleaching susceptibility45 of benthic marine organisms. Species richness of benthic invertebrates settling to experimental substrata is expected to increase proportionally to flow rate because of increased delivery of rare species64. However, flow rates ensured with water pumps in this study were designed to mimic that of the adjacent reef (~ 10 cm/s), and we see dominance of an entire group of sponges that are not observed on the reef rather than simply adding more rare species as has been observed in previous studies61,64. Fifth, the nutritional environment in the mesocosms might differ from that of the reef either because of mass transfer limiting nutrient uptake65 or differing particulate or dissolved organic matter (DOM) levels. We supplied unfiltered seawater at a rate sufficient to turn over the entire mesocosm tank volume roughly once per hour in an effort to minimize differences between the reef and mesocosm water chemistry and nutrient content, but we did not measure nutrients. However, periodic filtering of incoming mesocosm water did show that particulates and zooplankton were at the low end of natural reef densities and consistently lower than mean values on the reefs of Kāne‘ohe Bay48 suggesting that nutrients may have influenced compositional differences between mesocosm and reef ARMS. Although this list is not exhaustive, none of these factors appear to be obvious drivers of the difference in successional trajectories observed between mesocosms and reef environments.
The debate about whether recruitment limitation, predation or competition is the predominant force in structuring coral reef communities has raged on for decades (e.g.,66,67; reviewed by Hixon68. Signs of predation within cryptic coral reef communities are rare28 as cryptic habitats are known to provide physical protection for palatable sponges from spongivorous fish, cowries, and turtles69–74. ARMS provide only 1 cm spacing between plates, similarly, limiting predation from these organisms. Unfortunately, little is known about the species composition or trophic guilds of the cryptic coral reef communities which may harbor a multitude of sponge predators73–75. However, some caridean shrimp, polychaetes, and nudibranchs are known to consume sponges but none were observed in our study76,77. It is possible that high local densities of invertebrate spongivores on the natural reef consumed the calcareous and haplosclerid sponges, but such predation pressure would need to be extreme to eradicate nearly every individual before they could be sampled from our experimental reef ARMS. Even if these invertebrate predators consume small calcareous or haplosclerid sponges, predation seems an unlikely explanation for the difference between the mesocosm and reef ARMS because we observe a seasonal die-off of these small solitary sponges in the mesocosms which must be free of these predators if that were to explain why we see these sponges in only the mesocosm ARMS. Thus, we see no direct evidence of competition or predation structuring these sponge communities, and do not expect that larval supply differs fundamentally between the mesocosms and the adjacent reef from which our seawater is drawn. This leaves open the important question of which processes drive the difference in primary succession observed for cryptic sponges between reef and mesocosm ARMS as a fertile topic for further research.
Regardless of the factors underlying the observed difference between habitats, our results not only show strong evidence for stages of succession among sponge species with distinctive physiologies colonizing these uninhabited substrates but have important ecological implications for the cryptic community. Short life cycles of calcareous and haplosclerid sponge OTUs during early succession raise the hypothesis that detritus production derived from dead sponge tissue adds an important component to the budget of particulate organic matter (POM) via the sponge-loop. Detritus produced through the sponge-loop was originally reported as a result of rapid turnover of sponge cells24,78,79 that feed invertebrate detritivores like brittle stars25,80. In light of this discovery, other mechanisms of detritus production from sponges have been hypothesized to contribute to the sponge loop, such as predation of massive sponges which convert DOM into biomass22,81. Brandl and colleagues82 likewise argue that high productivity and turnover of small cryptobenthic fishes fuel ecosystem function and support the coral reef food web for larger, better known reef fish. Here we propose detritus production in cryptic communities from rapid turnover of these small-bodied solitary sponges could influence nutrient trophodynamics on young, developing Hawaiian coral reef habitats. For example, diversity and abundance between Calcarea and Haplosclerida accounted for 42% of total sponge diversity and abundance under mesocosm conditions before die-off. Death from such a dominant group of sponges in unestablished coral reef communities provide a significant source of available POM for detritovores during early stages of succession. However, POM production from sponge death is less likely to occur in developed coral reef communities where solitary sponges are unable to compete with established colonial species. But to verify this contribution, future studies should evaluate DOM uptake in these pioneering species, while simultaneously calculating their sponge biomass to determine the amount of detritus produced as a result of dead sponge tissue in relation to the entire POM pool of the reef.
Historically, cryptobenthic sponges have been thought of as a competitive phylum that appears only after pioneering stages of ecological succession in coral reef habitats27,28,83. However, previous studies have been limited by their inability to capture cryptic diversity deep within the reef matrix, monitoring succession of the reef matrix commuinty in an entirely undeveloped community isolated from coral reef conditions, and by low taxonomic resolution of sponges as a group. Using ARMS in our study and species identification of sponges as a single group subsampled on a temporal scale through barcoding and microscopy overcomes these early limitations. Although it is difficult to estimate complete diversity of sponges in our study considering that cryptic diversity could exist within samples exhibiting the same morphospecies84, our data show that the sponge community is diverse, and that this diversity contributes to different stages of ecological succession with some species being early colonists, and others being more competitive throughout community development. ARMS on the reef show trends much more similar to previous work, with some species being early colonists in undeveloped communities, and others being more competitive throughout development in more mature communities; whereas mesocosm ARMS highlight pioneering sponge species (i.e., Calcarea and Haplosclerida) during early stages of succession in undeveloped communities. These early successional sponges might play a previously unappreciated role by contributing to the particulate organic matter budget during the formation of coral reefs. Such processes are critical for maintenance of reef biodiversity throughout early reef development and understanding the contribution of individual species in this rich community is essential to manage and conserve coral reef productivity and biodiversity through space and time.
Supplementary Information
Acknowledgements
Funding was provided by an NSF Postdoctoral Research Fellowship in Biology (#1612307), NSF awards OA#1416889 & OCE# 2048457, and by the National Oceanic and Atmospheric Administration’s Ocean Acidification Program (#60046834). This is HIMB 1902 contribution number. We thank Katherine Van Artsdalen and Emma Orndahl for helping with sponge barcoding and ImageJ analysis.
Author contributions
J.V., K.D.B., C.P.J. and R.J.T. designed experiment. C.P.J. provided set-up and maintenance of the mesocosm system. J.V. and M.K.W. subsampled, barcoded, and annotated images which generated data for the analysis. J.V. analyzed data. J.V. wrote the paper with assistance from M.A.T, K.D.B. and R.J.T., J.V. and R.J.T. acquired funding.
Data availability
All samples were vouchered with the Florida Museum of Natural History at the University of Florida and at HIMB. Voucher metadata are publicly available at https://www.invertebase.org/portal/checklists/checklist.php?clid=14&pid=6. Accession numbers pertaining to either COI sequences, 28S rRNA sequences or sequences from both loci were provided for 87 vouchers (Supplementary Table S1). All sequences were deposited in GenBank under accession numbers: MW059040, MT586742, MW059078, MW059081, MW059070, MW143252, MW143254, MW059096, MW059097, MW059108, MW059101, MW059043, MW059071, MW059080, MW059082, MW144988, MW144983, MW059085, MW144984, MW059088, MW059083, MW144975, MW059084, MW059049, MW059063, MW059059, MW059107, MW059094, MW059055, MW059045, MW059053, MW016124, MW016135, MW016094, MW016241, MW016128, MW016216, MW016202, MW016148, MW016118, MW016161, MW016232, MW016229, MW016233, MW016172, MT452531, MW016374, MW016138, MW01630, MW016174, MW016178, MW016205, MW016209, MW016245, MW016123, MW016284, MW016253, MW016210, MW016218, MW016372, MW016129, MW016069, MW016146, MW016304, MW016307, MW016150, MW016211, MW016246, MW016206, MW016061, MW016251, MW016163, MW016090, MW016176, MW016344, MW016060, MW016342, MW016255, MW016331, MW016166, MW016343, MW016275, MW016153, MW016066, MW016184, MW016300, MW016288, MW016347, MW016256, MW016353, MW016257, MW016354, MW016373, MW016260, MW016261, MW016228, MW016259, MW016247, MW016289, MW016248, MW016125, MW016059, MW016324, MW016320, MW016325. Raw data showing distribution of sponge species in mesocosm and reef conditions throughout the 2-year monitoring period are provided in Supplementary Table S8.
Competing interests
The authors declare no competing interests.
Footnotes
Publisher's note
Springer Nature remains neutral with regard to jurisdictional claims in published maps and institutional affiliations.
Supplementary Information
The online version contains supplementary material available at 10.1038/s41598-022-18856-8.
References
- 1.Rapacciuolo G, Blois JL. Understanding ecological change across large spatial, temporal and taxonomic scales: Integrating data and methods in light of theory. Ecography. 2019;42:1247–1266. [Google Scholar]
- 2.Cowles HC. The ecological relations of the vegetation on the sand dunes of Lake Michigan. Part I. Geographical relations of the Dune Floras. Bot. Gaz. 1899;27:95–117. doi: 10.1086/327796. [DOI] [Google Scholar]
- 3.Gleason HA. The individualistic concept of the plant association. Bull. Torrey Bot. Club. 1926;53:7–26. doi: 10.2307/2479933. [DOI] [Google Scholar]
- 4.Denslow JS. Patterns of plant species diversity during succession under different disturbance regimes. Oecologia. 1980;46:18–21. doi: 10.1007/BF00346960. [DOI] [PubMed] [Google Scholar]
- 5.Budowski, G. Studies on Forest Succession in Costa Rica und Panama. Ph.D. Thesis, Yale University, New Haven (1961).
- 6.Opler PA, Baker HG, Frankie GW. Plant reproductive characteristics during secondary succession in neotropical lowland forest ecosystems. Biotropica. 1980;12:40–46. doi: 10.2307/2388155. [DOI] [Google Scholar]
- 7.Clements FE. Plant Succession: An Analysis of Development in Vegetation. Washington: Carnegie Institute; 1916. [Google Scholar]
- 8.Grigg RW, Maragos JE. Recolonization of hermatypic corals on submerged lava flows in Hawaii. Ecology. 1974;55:387–395. doi: 10.2307/1935226. [DOI] [Google Scholar]
- 9.Tomascik T, Van Woesik R, Mah AJ. Rapid coral colonization of a recent lava flow following a volcanic eruption, Banda Islands, Indonesia. Coral Reefs. 1996;15:169–175. doi: 10.1007/BF01145887. [DOI] [Google Scholar]
- 10.McClanahan TR. Primary succession of coral-reef algae: Differing patterns on fished versus unfished reefs. J. Exp. Mar. Biol. Ecol. 1997;218:77–102. doi: 10.1016/S0022-0981(97)00069-5. [DOI] [Google Scholar]
- 11.Reaka-Kudia ML. The global biodiversity of coral reefs: A comparison with rain forests. In: Reaka-Kudla M, Wilson D, Wilson E, editors. Biodiversity II: Understanding and Proteting our Biological Resources. Joseph Henry Press; 1997. pp. 83–108. [Google Scholar]
- 12.Ginsburg, R. N. Geological and biological roles of cavities in coral reefs. In Perspectives on Coral Reefs (ed. Barnes, D. J.) 148–153 (Australian Institute of Marine Science, Manuka, A.C.T., Australia, 1983).
- 13.Fautin D, et al. An overview of marine biodiversity in United States waters. PLoS ONE. 2010;5:e11914. doi: 10.1371/journal.pone.0011914. [DOI] [PMC free article] [PubMed] [Google Scholar]
- 14.Pearman JK, Anlauf H, Irigoien X, Carvalho S. Please mind the gap—Visual census and cryptic biodiversity assessment at central Red Sea coral reefs. Mar. Environ. Res. 2016;118:20–30. doi: 10.1016/j.marenvres.2016.04.011. [DOI] [PubMed] [Google Scholar]
- 15.Kobluk DR, Van Soest RWM. Cavity-dwelling sponges in a southern Caribbean coral reef and their paleontological implications. Bull. Mar. Sci. 1989;44:1207–1235. [Google Scholar]
- 16.Richter C, Wunsch M. Cavity-dwelling suspension feeders in coral reefs - A new link in reef trophodynamics. Mar. Ecol. Prog. Ser. 1999;188:105–116. doi: 10.3354/meps188105. [DOI] [Google Scholar]
- 17.Wunsch, M., Al-Moghrabi, S. M. & Kötter, I. Communities of coral reef Cavities in Jordan, Gulf of Aqaba (Red Sea). In Proceedings of 9th International Coral Reef Symposium, Vol. 1 (2000).
- 18.Kornder NA, et al. Implications of 2D versus 3D surveys to measure the abundance and composition of benthic coral reef communities. Coral Reefs. 2021;40:1137–1153. doi: 10.1007/s00338-021-02118-6. [DOI] [PMC free article] [PubMed] [Google Scholar]
- 19.Richter C, Wunsch M, Rasheed M, Kötter I, Badran MI. Endoscopic exploration of Red Sea coral reefs reveals dense populations of cavity-dwelling sponges. Nature. 2001;413:726–730. doi: 10.1038/35099547. [DOI] [PubMed] [Google Scholar]
- 20.De Goeij JM, Van Duyl FC. Coral cavities are sinks of dissolved organic carbon (DOC) Limnol. Oceanogr. 2007;52:2608–2617. doi: 10.4319/lo.2007.52.6.2608. [DOI] [Google Scholar]
- 21.Slattery M, Gochfeld DJ, Easson CG, O’Donahue LRK. Facilitation of coral reef biodiversity and health by cave sponge communities. Mar. Ecol. Prog. Ser. 2013;476:71–86. doi: 10.3354/meps10139. [DOI] [Google Scholar]
- 22.McMurray SE, Stubler AD, Erwin PM, Finelli CM, Pawlik JR. A test of the sponge-loop hypothesis for emergent Caribbean reef sponges. Mar. Ecol. Prog. Ser. 2018;588:1–14. doi: 10.3354/meps12466. [DOI] [Google Scholar]
- 23.De Goeij JM, Van Den Berg H, Van Oostveen MM, Epping EHG, Van Duyl FC. Major bulk dissolved organic carbon (DOC) removal by encrusting coral reef cavity sponges. Mar. Ecol. Prog. Ser. 2008;357:139–151. doi: 10.3354/meps07403. [DOI] [Google Scholar]
- 24.De Goeij JM, et al. Surviving in a marine desert: The sponge loop retains resources within coral reefs. Science (80-) 2013;342:108–110. doi: 10.1126/science.1241981. [DOI] [PubMed] [Google Scholar]
- 25.Rix L, et al. Reef sponges facilitate the transfer of coral-derived organic matter to their associated fauna via the sponge loop. Mar. Ecol. Prog. Ser. 2018;589:85–96. doi: 10.3354/meps12443. [DOI] [Google Scholar]
- 26.De Goeij, J. M., Lesser, M. P. & Pawlik, J. R. Nutrient fluxes and ecological functions of coral reef sponges in a changing ocean. In Climate Change, Ocean Acidification and Sponges: Impacts Across Multiple Levels of Organization (Springer, 2017). 10.1007/978-3-319-59008-0_8.
- 27.Choi DR. Ecological succession of reef cavity-dwellers (coelobites) in coral rubble. Bull. Mar. Sci. 1984;35:72–79. [Google Scholar]
- 28.Jackson JBC. Competition on marine hard substrata: The adaptive significance of solitary and colonial strategies. Am. Nat. 1977;111:743–767. doi: 10.1086/283203. [DOI] [Google Scholar]
- 29.Kobluk DR. Cryptic faunas in reefs: Ecology and geologic importance. Palaios. 1988;3:379–390. doi: 10.2307/3514784. [DOI] [Google Scholar]
- 30.Hooper, J. N. A. & Van Soest, R. W. M. Class Demospongiae Sollas, 1885. In Systema Porifera (2002). 10.1007/978-1-4615-0747-5_3.
- 31.Rützler K. The role of sponges in the mesoamerican barrier-reef ecosystem, Belize. Adv. Mar. Biol. 2012;61:211–271. doi: 10.1016/B978-0-12-387787-1.00002-7. [DOI] [PubMed] [Google Scholar]
- 32.Wulff J. Ecological interactions and the distribution, abundance, and diversity of sponges. Adv. Mar. Biol. 2012;61:273–344. doi: 10.1016/B978-0-12-387787-1.00003-9. [DOI] [PubMed] [Google Scholar]
- 33.Riesgo A, et al. Inferring the ancestral sexuality and reproductive condition in sponges (Porifera) Zool. Scr. 2014;43:101–117. doi: 10.1111/zsc.12031. [DOI] [Google Scholar]
- 34.Pawlik JR, Chanas B, Toonen RJ, Fenical W. Defenses of Caribbean sponges against predatory reef fish. I. Chemical deterrency. Mar. Ecol. Prog. Ser. 1995;127:183–194. doi: 10.3354/meps127183. [DOI] [Google Scholar]
- 35.Leong W, Pawlik JR. Evidence of a resource trade-off between growth and chemical defenses among Caribbean coral reef sponges. Mar. Ecol. Prog. Ser. 2010;406:71–78. doi: 10.3354/meps08541. [DOI] [Google Scholar]
- 36.Maldonado M, Bergquist PR. Phylum porifera. In: Young C, editor. Atlas of Marine Invertebrates. Academic; 2002. pp. 21–50. [Google Scholar]
- 37.Lanna E, Klautau M. Life history and reproductive dynamics of the cryptogenic calcareous sponge Sycettusa hastifera (Porifera, Calcarea) living in tropical rocky shores. J. Mar. Biol. Assoc. U. K. 2018;98:505–514. doi: 10.1017/S0025315416001466. [DOI] [Google Scholar]
- 38.Lanna, E., Monteiro, L. C. & Klautau, M. Life cycle of Paraleucilla magna Klautau, Monteiro and Borojevic, 2004 (Porifera, Calcarea). In Porifera Research: Biodiversity, Innovation and Sustainability 413–418 (2007).
- 39.Calazans VPSB, Lanna E. Influence of endogenous and exogenous factors on the reproductive output of a cryptogenic calcareous sponge. Mar. Biodivers. 2019;49:2837–2850. doi: 10.1007/s12526-019-01013-2. [DOI] [Google Scholar]
- 40.Zimmerman TL, Martin JW. Artificial reef matrix structures (ARMS): An inexpensive and effective method for collecting coral reef-associated invertebrates. Gulf Caribb. Res. 2004;16:59–64. doi: 10.18785/gcr.1601.08. [DOI] [Google Scholar]
- 41.Brainard, R. et al. Autonomous reef monitoring structures (ARMS): A tool for monitoring indices of biodiversity in the Pacific Islands. In 11th Pacific Science Inter-Congress, Papeete, Tahiti (2009).
- 42.Knowlton, N. et al. Coral reef biodiversity. In Life in the World’s Oceans: Diversity, Distribution, and Abundance 65–74 (2010). 10.1002/9781444325508.ch4.
- 43.Timmers MA, Vicente J, Webb M, Jury CP, Toonen RJ. Sponging up diversity: Evaluating metabarcoding performance for a taxonomically challenging phylum within a complex cryptobenthic community. Environ. DNA. 2020 doi: 10.1002/edn3.163. [DOI] [Google Scholar]
- 44.Vicente J, et al. Unveiling hidden sponge biodiversity within the Hawaiian reef cryptofauna. Coral Reefs. 2021 doi: 10.1007/s00338-021-02109-7. [DOI] [Google Scholar]
- 45.Grottoli AG, et al. Increasing comparability among coral bleaching experiments. Ecol. Appl. 2021;31:e02262. doi: 10.1002/eap.2262. [DOI] [PMC free article] [PubMed] [Google Scholar]
- 46.Rodgers KS, Jokiel PL, Brown EK, Hau S, Sparks R. Over a decade of change in spatial and temporal dynamics of Hawaiian coral reef communities. Pac. Sci. 2015;69:1–13. doi: 10.2984/69.1.1. [DOI] [Google Scholar]
- 47.Franklin EC, Jokiel PL, Donahue MJ. Predictive modeling of coral distribution and abundance in the Hawaiian Islands. Mar. Ecol. Prog. Ser. 2013;481:121–132. doi: 10.3354/meps10252. [DOI] [Google Scholar]
- 48.Jury, C. et al. Experimental reef communities persist under future ocean acidification and warming. Res. Sq. (2021).
- 49.Gorospe KD, et al. Local biomass baselines and the recovery potential for Hawaiian coral reef fish communities. Front. Mar. Sci. 2018;5:162. doi: 10.3389/fmars.2018.00162. [DOI] [Google Scholar]
- 50.Timmers, M. A. et al. Biodiversity of coral reef cryptobiota shuffles but does not decline under the combined stressors of ocean warming and acidification. Proc. Natl. Acad. Sci.118(39), e2103275118 (2021). [DOI] [PMC free article] [PubMed]
- 51.Wörheide G, Erpenbeck D. DNA taxonomy of sponges—Progress and perspectives. J. Mar. Biol. Assoc. U. K. 2007;87:1629–1633. doi: 10.1017/S0025315407058274. [DOI] [Google Scholar]
- 52.R Core Team. R: A language and environment for statistical computing. R Foundation for Statistical Computing (2020). 10.1017/CBO9781107415324.004.
- 53.Oksanen, J. et al. Package vegan. Community Ecology Packaging version 2, 1-295 (2013).
- 54.Pinheiro, J., Bates, D., DebRoy, S., Sarkar, D. & Team, R. C. nlme: Linear and nonlinear mixed effects models (2020).
- 55.Zuur AF, Ieno EN, Elphick CS. A protocol for data exploration to avoid common statistical problems. Methods Ecol. Evol. 2010;1:3–14. doi: 10.1111/j.2041-210X.2009.00001.x. [DOI] [Google Scholar]
- 56.Lenth RV. Least-squares means: The R package. J. Stat. Softw. 2016;69:1–33. doi: 10.18637/jss.v069.i01. [DOI] [Google Scholar]
- 57.Wickham H. ggplot2: Elegant Graphics for Data Analysis. Springer; 2016. [Google Scholar]
- 58.Ribeiro B, Padua A, Paiva PC, Custódio MR, Klautau M. Exploitation of micro refuges and epibiosis: Survival strategies of a calcareous sponge. J. Mar. Biol. Assoc. U. K. 2018;98:495–503. doi: 10.1017/S002531541600151X. [DOI] [Google Scholar]
- 59.Bahr KD, Jokiel PL, Toonen RJ. The unnatural history of Kāne’ohe bay: Coral reef resilience in the face of centuries of anthropogenic impacts. PeerJ. 2015;3:e950. doi: 10.7717/peerj.950. [DOI] [PMC free article] [PubMed] [Google Scholar]
- 60.Byrne M. Impact of ocean warming and ocean acidification on marine invertebrate life history stages: Vulnerabilities and potential for persistence in a changing ocean. Oceanogr. Mar. Biol. Annu. Rev. 2011;49:1–42. [Google Scholar]
- 61.Barnes DKA, Ashton GV, Morley SA, Peck LS. 1 °C warming increases spatial competition frequency and complexity in Antarctic marine macrofauna. Commun. Biol. 2021;4:1–7. doi: 10.1038/s42003-021-01742-w. [DOI] [PMC free article] [PubMed] [Google Scholar]
- 62.Maldonado M, Giraud K, Carmona C. Effects of sediment on the survival of asexually produced sponge recruits. Mar. Biol. 2008;154:631–641. doi: 10.1007/s00227-008-0956-5. [DOI] [Google Scholar]
- 63.Eckman JE. Hydrodynamic processes affecting benthic recruitment. Limnol. Oceanogr. 1983;28:241–257. doi: 10.4319/lo.1983.28.2.0241. [DOI] [Google Scholar]
- 64.Palardy JE, Witman JD. Water flow drives biodiversity by mediating rarity in marine benthic communities. Ecol. Lett. 2011;14:63–68. doi: 10.1111/j.1461-0248.2010.01555.x. [DOI] [PubMed] [Google Scholar]
- 65.Falter JL, Atkinson MJ, Merrifield MA. Mass-transfer limitation of nutrient uptake by a wave-dominated reef flat community. Limnol. Oceanogr. 2004;49:1820–1831. doi: 10.4319/lo.2004.49.5.1820. [DOI] [Google Scholar]
- 66.Sale PF. Coexistence of coral reef fishes—A lottery for living space. Environ. Biol. Fish. 1978;3:85–102. doi: 10.1007/BF00006310. [DOI] [Google Scholar]
- 67.Karlson RH, Jackson JBC. Competitive networks and community structure: A simulation study. Ecology. 1981;62:670–678. doi: 10.2307/1937735. [DOI] [Google Scholar]
- 68.Hixon, M. A. Predation as a process structuring coral reef fish communities. In The Ecology of Fishes on Coral Reefs (1991). 10.1016/b978-0-08-092551-6.50022-2.
- 69.Hobson ES. Feeding patterns among tropical reef fishes. Am. Sci. 1975;63:382–392. [Google Scholar]
- 70.Bailey-Brock JH. Fouling community development on an artificial reef in Hawaiian waters. Bull. Mar. Sci. 1989;44:580–591. [Google Scholar]
- 71.Vicente J, Toonen RJ, Bowen BW. Hawaiian green turtles graze on bioeroding sponges at Maunalua Bay, O‘ahu, Hawai‘i, Galaxea. J. Coral Reef Stud. 2019;21:3–4. doi: 10.3755/galaxea.21.1_3. [DOI] [Google Scholar]
- 72.Vicente J, Osberg A, Marty MJ, Rice K, Toonen RJ. Influence of sponge palatability on the feeding preferences of the endemic Hawaiian tiger cowrie for indigenous and introduced sponges. Mar. Ecol. Prog. Ser. 2020;647:109–122. doi: 10.3354/meps13418. [DOI] [Google Scholar]
- 73.Klumpp D, McKinnon A, Mundy C. Motile cryptofauna of a coral reef: Abundance, distribution and trophic potential. Mar. Ecol. Prog. Ser. 1988;45:95–108. doi: 10.3354/meps045095. [DOI] [Google Scholar]
- 74.Carpenter, R. C. Invertebrate predators and grazers. In Life and Death of Coral Reefs (1997). 10.1007/978-1-4615-5995-5_9.
- 75.Glynn, P. W. & Enochs, I. C. Invertebrates and their roles in coral reef ecosystems. In Coral Reefs: An Ecosystem in Transition (2011). 10.1007/978-94-007-0114-4_18.
- 76.Ďuriš Z, Horká I, Juračka PJ, Petrusek A, Sandford F. These squatters are not innocent: The evidence of parasitism in Sponge-Inhabiting shrimps. PLoS ONE. 2011;6:e21987. doi: 10.1371/journal.pone.0021987. [DOI] [PMC free article] [PubMed] [Google Scholar]
- 77.Pawlik JR. A sponge-eating worm from Bermuda: Branchiosyllis oculata (Polychaeta, Syllidae) Mar. Ecol. 1983;4:65–79. doi: 10.1111/j.1439-0485.1983.tb00288.x. [DOI] [Google Scholar]
- 78.Degoeij JM, et al. Cell kinetics of the marine sponge Halisarca caerulea reveal rapid cell turnover and shedding. J. Exp. Biol. 2009;212:3892–3900. doi: 10.1242/jeb.034561. [DOI] [PubMed] [Google Scholar]
- 79.Alexander BE, et al. Cell turnover and detritus production in marine sponges from tropical and temperate benthic ecosystems. PLoS ONE. 2014;9:e109486. doi: 10.1371/journal.pone.0109486. [DOI] [PMC free article] [PubMed] [Google Scholar]
- 80.Bart MC, Hudspith M, Rapp HT, Verdonschot PFM, de Goeij JM. A deep-sea sponge loop? Sponges transfer dissolved and particulate organic carbon and nitrogen to associated fauna. Front. Mar. Sci. 2021;8:604879. doi: 10.3389/fmars.2021.604879. [DOI] [Google Scholar]
- 81.Pawlik JR, McMurray SE. The emerging ecological and biogeochemical importance of sponges on coral reefs. Annu. Rev. Mar. Sci. 2020;12:315–337. doi: 10.1146/annurev-marine-010419-010807. [DOI] [PubMed] [Google Scholar]
- 82.Brandl SJ, et al. Demographic dynamics of the smallest marine vertebrates fuel coral reef ecosystem functioning. Science (80-). 2019;364:1189–1192. doi: 10.1126/science.aav3384. [DOI] [PubMed] [Google Scholar]
- 83.Buss LW, Jackson JBC. Competitive networks: Nontransitive competitive relationships in cryptic coral reef environments. Am. Nat. 1979;113:223–234. doi: 10.1086/283381. [DOI] [Google Scholar]
- 84.Vicente J, Ríos JA, Zea S, Toonen RJ. Molecular and morphological congruence of three new cryptic Neopetrosia spp in the Caribbean. PeerJ. 2019;7:e6371–e6381. doi: 10.7717/peerj.6371. [DOI] [PMC free article] [PubMed] [Google Scholar]
Associated Data
This section collects any data citations, data availability statements, or supplementary materials included in this article.
Supplementary Materials
Data Availability Statement
All samples were vouchered with the Florida Museum of Natural History at the University of Florida and at HIMB. Voucher metadata are publicly available at https://www.invertebase.org/portal/checklists/checklist.php?clid=14&pid=6. Accession numbers pertaining to either COI sequences, 28S rRNA sequences or sequences from both loci were provided for 87 vouchers (Supplementary Table S1). All sequences were deposited in GenBank under accession numbers: MW059040, MT586742, MW059078, MW059081, MW059070, MW143252, MW143254, MW059096, MW059097, MW059108, MW059101, MW059043, MW059071, MW059080, MW059082, MW144988, MW144983, MW059085, MW144984, MW059088, MW059083, MW144975, MW059084, MW059049, MW059063, MW059059, MW059107, MW059094, MW059055, MW059045, MW059053, MW016124, MW016135, MW016094, MW016241, MW016128, MW016216, MW016202, MW016148, MW016118, MW016161, MW016232, MW016229, MW016233, MW016172, MT452531, MW016374, MW016138, MW01630, MW016174, MW016178, MW016205, MW016209, MW016245, MW016123, MW016284, MW016253, MW016210, MW016218, MW016372, MW016129, MW016069, MW016146, MW016304, MW016307, MW016150, MW016211, MW016246, MW016206, MW016061, MW016251, MW016163, MW016090, MW016176, MW016344, MW016060, MW016342, MW016255, MW016331, MW016166, MW016343, MW016275, MW016153, MW016066, MW016184, MW016300, MW016288, MW016347, MW016256, MW016353, MW016257, MW016354, MW016373, MW016260, MW016261, MW016228, MW016259, MW016247, MW016289, MW016248, MW016125, MW016059, MW016324, MW016320, MW016325. Raw data showing distribution of sponge species in mesocosm and reef conditions throughout the 2-year monitoring period are provided in Supplementary Table S8.