

Abstract
Background:
Measurement accuracy has been assessed for many different blood glucose monitoring systems (BGMS) over the years by different study groups. However, the choice of the comparison measurement procedure may impact the apparent level of accuracy found in such studies.
Materials and Methods:
Measurement accuracy of 18 different BGMS was assessed in a setting based on ISO 15197 using two different comparison methods in parallel: a glucose oxidase (GOD)-based and a hexokinase (HK)-based method. Accuracy limits of ISO 15197 were applied, and additional analyses were performed, including bias, linear regression, and mean absolute relative difference (MARD) to assess the impact of possible differences between comparison methods on the apparent level of accuracy.
Results:
While ≈80% of BGMS met the accuracy criteria of ISO 15197 when compared with the respective manufacturers’ reference measurement procedure, only two-thirds did so against both comparison methods. The mean relative bias ranged from −6.6% to +5.7% for the analysis against the GOD-based method and from −11.1% to +1.3% for the analysis against the HK-based method, whereas MARD results ranged from 3.7% to 9.8% and from 2.3% to 10.5%, respectively. Results of regression analysis showed slopes between 0.85 and 1.08 (GOD-based method) and between 0.81 and 1.01 (HK-based method).
Conclusions:
The results of this study indicate that there are systematic differences between the reference measurement procedures used for BGMS calibration as well as for system accuracy assessment. Because of the potential impact on therapy of patients with diabetes resulting from these differences, further steps toward harmonization of the measurement procedures’ results are important.
Keywords: bias, blood glucose monitoring system, ISO 15197, linear regression, MARD, system accuracy
Background
Insulin-treated patients with diabetes mellitus often rely on self-monitoring of blood glucose (SMBG) for sustaining glycemic control.1 -4 Blood glucose monitoring systems (BGMS) are widely accepted as essential tools in the therapy of patients with diabetes.5-8 BGMS have to provide accurate and reproducible results to ensure adequate therapeutic decisions in order to prevent late complications.8-11 As they enable insulin adjustment, BGMS are of therapeutic benefit especially in patients with multiple daily insulin injections or with insulin pumps.5,8,12-15 Inaccurate blood glucose (BG) measurement results can represent a severe threat for people with diabetes leading to inappropriate insulin dosing and/or to a delay in the detection of hypoglycemia or hyperglycemia. Furthermore, high-quality calibration of continuous glucose monitoring (CGM) systems with results obtained from BGMS is important to maintain the accuracy of CGM sensors. 16
There is a broad variety of BGMS with different technological stages currently available on the market. However, as mentioned above, their clinical value is linked to measurement accuracy. The standard ISO 15197 published by the International Organization for Standardization (ISO), which was first released in 2003 17 and revised with more stringent study prerequisites and criteria in 2013 18 (harmonized with European regulations as EN ISO 15197:2015 19 ), defines accuracy requirements for BGMS. ISO 15197, which is primarily addressed at manufacturers and regulatory bodies, stipulates the establishment of a reference measurement procedure that is traceable according to ISO 17511 requirements. 20 Most manufacturers use either a glucose-oxidase (GOD)-based or a hexokinase (HK)-based reference measurement procedure to calibrate their BGMS during production. Measurement procedures are referred to as “traceable” if their results can be related to a reference of highest order through an unbroken chain of calibrations, each contributing to the measurement uncertainty. 20 Thus, a measurement procedure may in fact be traceable but may, on the other hand, have a large measurement uncertainty. To what extent the reference measurement procedures used for calibration are indeed traceable is usually not made public. ISO 15197 does not stipulate additional requirements for the comparison method apart from traceability, for example, acceptance criteria for bias and imprecision. Therefore, reference measurement procedures from different manufacturers, as well as, for example, comparison measurement procedures used in independent postmarket evaluations may provide systematically different results, 21 or procedures might be used that exhibit variations between devices, reagent system, or calibrator batches.22-24
The aim of this study was to investigate the influence of the comparison measurement procedure on system accuracy outcome for the investigated reagent system lot of 18 different, current-generation BGMS available on the European market. Test procedures based on ISO 15197 were applied, and two established comparison measurement procedures, based on GOD and HK, were used.
Materials and Methods
This postmarket surveillance study of 18 CE-marked current-generation BGMS was conducted in November and December 2018 at the Institut für Diabetes-Technologie Forschungs- und Entwicklungsgesellschaft mbH an der Universität Ulm (IDT), Ulm, Germany, in compliance with the German Medical Devices Act, the Guideline for Good Clinical Practice and under consideration of the Declaration of Helsinki (revised edition, Fortaleza 2013). The study protocol was approved by the responsible Ethics Committee and exempted from approval by the German Federal Institute for Drugs and Medical Devices (BfArM). The study was registered at ClinicalTrials.gov (registry number NCT03737188). Prior to study start, all participants signed informed consent forms. Experimental procedures were performed by trained study personnel based on the requirements described in detail in ISO 15197, clause 6.3. Deviations from these requirements are described below. A more detailed description of study methods was recently published by Pleus et al. 25 The study was financially supported by unrestricted grants from six different BGMS manufacturers/distributors, who did not have an impact on study procedures and BGMS acquisition. The additional analysis presented here was initiated and planned by IDT.
Study Participants
In total, 126 different subjects (males and females, aged ≥18 years) were included to obtain 100 evaluable data sets for each BGMS as required by ISO 15197. Additional information about subject demographics as well as inclusion and exclusion criteria were recently published. 25
Blood Glucose Monitoring Systems
In this study, 18 different CE-marked BGMS were procured by IDT and evaluated with one reagent system lot each (Table 1). The systems were adjusted, stored, and used in compliance with the respective manufacturers’ labeling. The proper functioning of each system was ensured at least once a day prior to the test procedures by performing control measurements according to the manufacturer’s instructions. BGMS-specific control solutions were unavailable for eBsensor and Pic Gluco Test, and therefore, Meter Trax control solutions (Bio-Rad Laboratories, Irvine, CA, USA) were used for these BGMSs to verify stable performance over the study period. The BGMS CareSens Dual, GluNEO, and WaveSense JAZZ Wireless provided blood glucose results in mmol/L that were converted to mg/dL by using the following formula: 1 mmol/L = 18.02 mg/dL. All other systems displayed glucose results in mg/dL.
Table 1.
BGMS Characteristics According to the Respective Manufacturer’s Labeling.
| # | System | Reagent system | Manufacturer’s reference measurement procedure | Test strip enzyme | Manufacturer b | |
|---|---|---|---|---|---|---|
| Lots | Expiry date | |||||
| 1 | ABRA | MPD123C006 | 2020/03 | GOD | GOD | Diagnosis S.A., Poland |
| 2 | Accu-Chek Guide | 100551 | 2019/10 | HK | GDH | Roche Diabetes Care GmbH, Germany |
| 3 | AURUM | TD16G115-BEE | 2019/01 | GOD | GDH | TaiDoc Technology Corp., Taiwan |
| 4 | CareSens Dual | QM20HBB2B | 2020/04 | GOD | GDH | i-SENS, Inc., Korea |
| 5 | CERA-CHEK 1CODE | G48D071711 | 2020/04 | GOD | GDH | Green Cross Medis Corp., Korea |
| 6 | Contour Next One | DP8APEG14B | 2020/01 | GOD | GDH | Ascensia Diabetes Care Holdings AG, Switzerland |
| 7 | eBsensor | I2A0B1H05 | 2020/02 | GOD | GOD | Visgeneer Inc., Taiwan |
| 8 | FreeStyle Freedom Lite | 1041095 | 2020/02 | GOD | GDH | Abbott Diabetes Care Ltd., UK |
| 9 | GL50 evo | D07/1 | 2020/02 | GOD | GDH | Beurer GmbH, Germany |
| 10 | GlucoCheck GOLD | WG18A103-BEE | 2020/01 | GOD | GDH | aktivmed GmbH, Germany |
| 11 | GlucoMen areo 2K | HS180320 | 2020/03 | GOD | GOD | A. Menarini Diagnostics S.r.l., Italy |
| 12 | GluNEO | X18C17-5B2 | 2020/03 | HK a | GDH | Infopia Co., Ltd., Korea |
| 13 | MyStar DoseCoach | PM15WD96L | 2019/01 | GOD | GOD | AgaMatrix Inc., USA Distributor c : Sanofi-Aventis France, France |
| 14 | OneTouch Verio Flex | 4341526 | 2019/08 | GOD | GDH | LifeScan Europe, Division of Cilag GmbH International, Switzerland |
| 15 | Pic Gluco Test | 1018050006 | 2020/05 | GOD | GOD | SD BioSensor, Inc., Korea |
| 16 | Rightest GM700S | 2117A1201 | 2019/09 | GOD | GDH | Bionime Corp., Taiwan |
| 17 | TRUEyou | HLU1243INT | 2020/10 | GOD | GDH | Trividia Health, Inc., USA |
| 18 | WaveSense JAZZ Wireless | QA03WY28L | 2020/02 | GOD | GOD | AgaMatrix Inc., USA |
BGMS, Blood Glucose Monitoring System; GDH, glucose dehydrogenase; GOD, glucose oxidase; HK, hexokinase.
No information about the manufacturer’s reference measurement procedure was available at the time of manuscript submission. Based on the literature research 26 and the investigator’s experience regarding reliability of measurement results, the HK-based method was assigned as primary reference measurement procedure for system accuracy evaluation.
Manufacturer names are given according to the imprints on the systems.
Data from the market research institute indicated Sanofi as manufacturer of the reagent system used with BGMS 13, as opposed to the labels on the BGMS components that indicate AgaMatrix as manufacturer. This discrepancy was only realized after all materials had been procured; therefore this BGMS was not replaced.
Comparison Measurement Procedures
For each BGMS, comparison measurements were performed with a GOD-based method (YSI 2300 STAT Plus glucose analyzer; YSI Incorporated, Yellow Springs, OH, USA) and an HK-based method (Cobas Integra 400 plus; Roche Instrument Center, Rotkreuz, Switzerland). Both devices provided BG values in mg/dL. ISO 15197 requires measurement procedures to be traceable according to ISO 17511.17,20 Conformity to traceability requirements of ISO 17511 of both methods was assured by the respective analyzer’s manufacturer. As required by Rili-BÄK, 27 the Guideline of the German Medical Association on Quality Assurance in Medical Laboratory, verification of trueness and precision of both reference measurement procedures were performed during the experimental phase by regular internal and external quality control measures. In addition, daily quality control measurements following internal standard operating procedures were performed using higher-order control materials (NIST SRM 965b, [National Institute of Standards and Technology, Gaithersburg, MD, USA]). In these measurements at four different glucose concentrations, imprecision (expressed as coefficient of variation) was ≤1.9% and bias was ≤2.2% for the GOD method, whereas imprecision was ≤1.3% and bias was ≤1.7% for the HK method. All reference measurements were performed in duplicate with both methods on capillary plasma samples (see section “Samples and test procedure”).
For the whole blood-calibrated system eBsensor, results from both reference measurement procedures were converted from plasma BG values to whole blood-equivalent BG values using the following formula: whole blood BG value (in mg/dL) = plasma BG value (in mg/dL) × (1–(0.0024 × hematocrit value (in %)). 28 The respective manufacturer’s reference measurement procedure for accuracy evaluation as specified in the manufacturer’s labeling is shown in Table 1.
Samples and Test Procedure
BG concentrations of the 100 different blood samples included in the analyses were distributed according to ISO 15197 requirements. 18 Regarding each reference measurement procedure, blood samples were distributed into the different concentration categories based on the mean reference values of the respective method. To ensure sample stability and to exclude drift, the difference between mean values of consecutive duplicate reference measurements must not have exceeded ±4 mg/dL at BG concentrations <100 mg/dL or ±4% at BG concentrations ≥100 mg/dL.
Subjects were asked to wash their hands with soap and water and dry them before any samples were collected. Subsequently, the BG measurements were performed in a laboratory setting with controlled room temperature (21.0°C-24.1°C, mean ± SD: 22.0°C ± 0.5°C) and controlled relative humidity (32.4%-50.9%, mean ± SD: 42.4% ± 2.5%) in compliance with the manufacturers’ specifications of the tested devices and ISO 15197. The experimental procedures were performed by study personnel trained to the limitations of the BGMS, the manufacturers’ labeling, the safety practices, and the test protocol.
Measurements were performed in duplicate on an individual sample with two different meters of each BGMS using test strips from the same package or vial. Test strips were taken from at least 10 different packages or vials which were changed after approximately 10 subjects.
For BG concentrations >50 to ≤400 mg/dL, only unaltered samples were used. The measurement procedure for these samples was as follows: study personnel collected fresh capillary blood samples in lithium heparin tubes from the participants’ fingertips by skin puncture for duplicate reference measurements. BG concentration was then measured with BG meters 1 and 2 of the respective BGMS directly from the puncture site. After that, a second sample for duplicate reference measurements was collected. The order in which measurements with different BGMS were performed was rotated between subjects.
Samples collected for reference measurements were centrifuged within 10 min of collection to obtain plasma. Before the measurements with each BG meter and before each aliquot collection for reference measurements, a fresh blood drop was generated (residual blood was wiped off the finger or the syringe beforehand).
Data Analysis
For each BGMS, 200 data points from at least 100 capillary samples from different subjects were analyzed. Data were excluded from analysis for the following reasons: (1) procedural error; (2) device deficiency; (3) BGMS provided no valid measurement result; (4) incomplete data set; (5) partial pressure of oxygen of adjusted samples >85 mmHg (>11.3 kPa) for GOD-based BGMS; (6) hemolysis in plasma samples for reference measurements; (7) quality control measurement results obtained with the reference measurement procedures before measuring blood samples were outside predefined limits; (8) difference between the mean values of first and second duplicate reference measurements exceeded the acceptance criteria for sample stability (as defined above); (9) mean reference measurement result outside the test system’s measurement range; and (10) required number of samples in a BG concentration range already reached.
In this study, the following different measures of accuracy were applied. Based on ISO 15197, the percentage of results within ±15 mg/dL for BG concentrations <100 mg/dL and the percentage of results within ±15% for BG concentrations ≥100 mg/dL were calculated. At least 95% of a system’s measurement results shall be found within ±15 mg/dL or 15% (system accuracy criterion A), and at least 99% of the results shall fall within the clinically acceptable zones A and B of the consensus error grid (CEG) (system accuracy criterion B). The number and the percentage of results within the clinically acceptable zones A and B of the CEG analyses were calculated for the evaluated reagent system lot. ISO 15197 intends the application of this analysis to three reagent system lots combined. 18 More stringent criteria of ±10 mg/dL and ±10%, as well as ±5 mg/dL and ±5%, respectively, which ISO 15197:2015 recommends to report, were applied as well. The minimal deviation from the respective comparison measurement procedure’s results within which ≥95% of the results of the BGMS were found was calculated.
In addition, the relative bias (%) of the measurement results was calculated according to Bland and Altman 29 by using the following formula:
in which BG is a single measurement result, comparison is the mean result of the comparison measurements (obtained on samples collected before and after the measurements with the system), and n is the number of all BG measurement results. The relative bias is shown with 95% limits of agreement (approximately ±1.96 × standard deviation [SD]).
Linear regression analysis was performed according to Passing and Bablok. 30 The regression equation (y = a × x + b) reveals proportional (the regression line’s slope a) and constant (the regression line’s intercept b) measurement differences between a BGMS and the mean result of the comparison method.
Mean absolute relative differences (MARD) were calculated for each BGMS based on absolute relative differences across the whole glycemic range.
Results
Statistical results of the analysis against the two comparison measurement procedures are shown in comprehensive tables (Tables 2 and 3), including percentage of results within ISO 15197 accuracy limits, minimal deviation from the comparison method’s results containing at least 95% of values, bias and 95% limits of agreement according to Bland and Altman, 29 linear regression according to Passing and Bablok, 30 and MARD. In addition, differences between the result of the analysis versus GOD values and the result of the analysis versus HK values are shown.
Table 2.
Results for the GOD-Based Comparison Method, The HK-Based Comparison Method and the Difference in Results (GOD Result − HK Result): Percentage of Results Within EN ISO 15197:2015 Accuracy Criteria and Minimal Deviation from the Comparison Method’s Results Containing At Least 95% of Values.
| Percentage of BGMS results within . . . of the comparison method result | Minimal deviation within which 95% of results were found (mg/dL or %) | |||||||||||
|---|---|---|---|---|---|---|---|---|---|---|---|---|
| ±15 mg/dL/±15% | ±10 mg/dL/±10% | ±5 mg/dL/±5% | ||||||||||
| System # | GOD | HK | Diff. | GOD | HK | Diff. | GOD | HK | Diff. | GOD | HK | Diff. |
| 1 | 91 | 82.5 | 8.5 | 71 | 51 | 20.0 | 36.5 | 28 | 8.5 | ±16.8 | ±20.1 | −3.3 |
| 2 | 100 | 100 | 0.0 | 99.5 | 97.5 | 2.0 | 72 | 82 | −10.0 | ±8.3 | ±8.4 | −0.1 |
| 3 | 97.5 | 99.5 | −2.0 | 88 | 92 | −4.0 | 55.5 | 66 | −10.5 | ±13.5 | ±10.9 | 2.6 |
| 4 | 96.5 | 96 | 0.5 | 84.5 | 72 | 12.5 | 48 | 31.5 | 16.5 | ±13.8 | ±14.5 | −0.7 |
| 5 | 94.5 | 86.5 | 8.0 | 82 | 72 | 10.0 | 51 | 34.5 | 16.5 | ±15.2 | ±18.7 | −3.5 |
| 6 | 100 | 100 | 0.0 | 99.5 | 99.5 | 0.0 | 77 | 93.5 | −16.5 | ±7.7 | ±5.3 | 2.4 |
| 7 | 89 | 86.5 | 2.5 | 73 | 73.5 | −0.5 | 45.5 | 34.5 | 11.0 | ±19.7 | ±18.6 | 1.1 |
| 8 | 99.5 | 92.5 | 7.0 | 91.5 | 62.5 | 29.0 | 46.5 | 10 | 36.5 | ±11.1 | ±15.8 | −4.7 |
| 9 | 97.5 | 97 | 0.5 | 86.5 | 84.5 | 2.0 | 59.5 | 50 | 9.5 | ±13.4 | ±13.4 | 0.0 |
| 10 | 100 | 96.5 | 3.5 | 92 | 69 | 23.0 | 54.5 | 26.5 | 28.0 | ±11.2 | ±14.0 | −2.8 |
| 11 | 98 | 100 | −2.0 | 86 | 91.5 | −5.5 | 49 | 67 | −18.0 | ±13.3 | ±11.2 | 2.1 |
| 12 | 93 | 93 | 0.0 | 69 | 77.5 | −8.5 | 32.5 | 35 | −2.5 | ±17.3 | ±16.2 | 1.1 |
| 13 | 95 | 100 | −5.0 | 85 | 96 | −11.0 | 56 | 69 | −13.0 | ±14.4 | ±9.3 | 5.1 |
| 14 | 99 | 99.5 | −0.5 | 93.5 | 96.5 | −3.0 | 58.5 | 79.5 | −21.0 | ±11.9 | ±9.2 | 2.7 |
| 15 | 98 | 100 | −2.0 | 87.5 | 90.5 | −3.0 | 54.5 | 58.5 | −4.0 | ±12.2 | ±11.6 | 0.6 |
| 16 | 99.5 | 100 | −0.5 | 96 | 91 | 5.0 | 67 | 59 | 8.0 | ±9.4 | ±10.8 | −1.4 |
| 17 | 99 | 94.5 | 4.5 | 85.5 | 77 | 8.5 | 56 | 45 | 11.0 | ±13.6 | ±15.3 | −1.7 |
| 18 | 95 | 99 | −4.0 | 84 | 92 | −8.0 | 55 | 65 | −10.0 | ±14.4 | ±11.0 | 3.4 |
GOD, glucose oxidase; HK, hexokinase.
Table 3.
Results for the GOD-Based Comparison Method, the HK-Based Comparison Method and the Difference in Results (GOD Result − HK Result): Bias And 95% Limits of Agreement (±1.96 × Standard Deviation) According to Bland and Altman, 29 Linear Regression According to Passing and Bablok 30 , and MARD.
| System # | Bland-Altman | Passing-Bablok | MARD | |||||||||
|---|---|---|---|---|---|---|---|---|---|---|---|---|
| Rel. Bias (%) | 95% limits of agreement (%) | Slope | Mean (%) | |||||||||
| GOD | HK | Diff. | GOD | HK | Diff. | GOD | HK | Diff. | GOD | HK | Diff. | |
| 1 | −2.9 | −7.3 | 4.3 | ±20.7 | ±21.4 | −0.8 | 0.85 | 0.81 | 0.04 | 8.6 | 10.5 | −1.9 |
| 2 | 2.8 | −1.6 | 4.4 | ±7.8 | ±8.1 | −0.4 | 1.01 | 0.96 | 0.05 | 4.1 | 3.4 | 0.7 |
| 3 | 2.6 | −1.7 | 4.4 | ±13.3 | ±12.7 | 0.6 | 1.06 | 1.00 | 0.06 | 5.9 | 5.0 | 0.9 |
| 4 | 0.8 | −3.5 | 4.4 | ±16.8 | ±17.5 | −0.7 | 0.94 | 0.89 | 0.05 | 7.0 | 8.0 | −1.1 |
| 5 | −1.3 | −5.6 | 4.3 | ±17.1 | ±18.1 | −1.0 | 0.86 | 0.81 | 0.05 | 6.9 | 8.5 | −1.6 |
| 6 | 3.3 | −1.1 | 4.4 | ±5.4 | ±5.5 | −0.2 | 1.03 | 0.98 | 0.05 | 3.7 | 2.3 | 1.3 |
| 7 | 3.9 | 0.3 | 3.7 | ±24.6 | ±25.3 | −0.7 | 0.91 | 0.87 | 0.04 | 9.8 | 10.1 | −0.3 |
| 8 | −6.6 | −11.1 | 4.5 | ±8.7 | ±7.9 | 0.8 | 0.95 | 0.90 | 0.05 | 6.6 | 10.4 | −3.9 |
| 9 | 1.7 | −2.7 | 4.4 | ±13.6 | ±14.2 | −0.6 | 1.01 | 0.96 | 0.05 | 5.8 | 6.2 | −0.4 |
| 10 | −4.5 | −8.9 | 4.4 | ±12.0 | ±11.1 | 0.9 | 1.00 | 0.95 | 0.05 | 5.9 | 8.7 | −2.8 |
| 11 | 5.7 | 1.3 | 4.4 | ±13.7 | ±14.7 | −1.0 | 1.01 | 0.95 | 0.06 | 7.1 | 5.5 | 1.6 |
| 12 | 3.9 | −0.6 | 4.4 | ±21.6 | ±22.5 | −0.8 | 0.93 | 0.88 | 0.05 | 9.6 | 8.8 | 0.8 |
| 13 | 4.3 | −0.1 | 4.5 | ±10.8 | ±10.5 | 0.3 | 1.08 | 1.01 | 0.07 | 5.8 | 4.3 | 1.5 |
| 14 | 4.2 | −0.3 | 4.5 | ±9.2 | ±9.2 | 0.0 | 1.04 | 0.99 | 0.05 | 5.3 | 3.5 | 1.8 |
| 15 | 3.3 | −1.1 | 4.5 | ±13.8 | ±13.9 | 0.0 | 1.00 | 0.94 | 0.06 | 6.2 | 5.6 | 0.6 |
| 16 | 2.1 | −2.3 | 4.5 | ±11.1 | ±11.7 | −0.6 | 0.96 | 0.90 | 0.06 | 5.0 | 5.2 | −0.3 |
| 17 | 0.9 | −3.6 | 4.5 | ±17.1 | ±17.5 | −0.4 | 0.97 | 0.92 | 0.05 | 6.5 | 7.3 | −0.8 |
| 18 | 4.2 | −0.2 | 4.5 | ±12.1 | ±12.2 | 0.0 | 1.06 | 1.00 | 0.06 | 6.3 | 4.9 | 1.4 |
GOD, glucose oxidase; HK, hexokinase; MARD, mean absolute relative difference.
The minimal deviation ranged from ±7.7 mg/dL or ±7.7% to ±19.7 mg/dL or ±19.7% in the analysis versus GOD values and ±5.3 mg/dL or ±5.3% to ±20.1 mg/dL or ±20.1% in the analysis versus HK values. When analyzed against the GOD method, 14 out of the 18 investigated reagent system lots (one lot per BGMS) fulfilled the system accuracy criterion A. In the evaluation against the HK method, the tested reagent system lots of 12 BGMS fulfilled the minimum accuracy requirements. Therefore, at least two-thirds of the current BGMS each utilized with one reagent system lot in this study, pass the accuracy criteria of ISO 15197, independent of the applied comparison method. CEG analysis for the investigated reagent system lots showed 100% of results within the clinically acceptable zones A and B also independent of the applied comparison method. At least 99% of results obtained with three different reagent system lots are required to fulfill system accuracy criterion B.
Figures 1 and 2 show Bland-Altman bias plots, in which the relative difference between an individual BGMS result and the corresponding comparison method result was plotted against the average of these two results. The mean relative bias for all BGMS ranged from −6.6% to +5.7% for the analysis versus GOD values and from −11.1% to +1.3% for the analysis versus HK values, respectively (Figures 1 and 2). In this analysis, 95% limits of agreement ranged from ±5.4% to ±24.6% for the GOD-based and from ±5.5% to ±25.3% for the HK-based analysis (Table 3).
Figure 1.
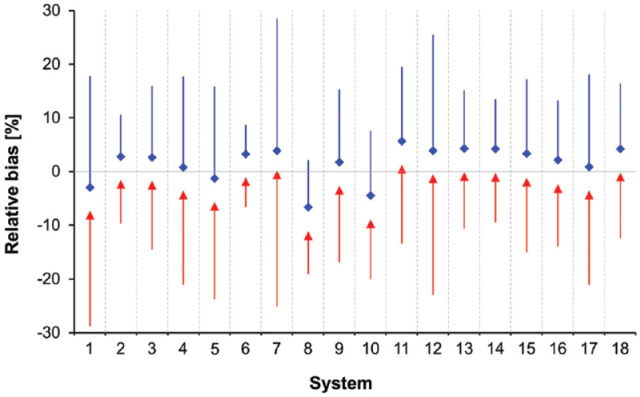
Relative bias according to Bland and Altman 29 for each test strip lot. The relative bias evaluated by using the glucose oxidase (GOD) method is shown in blue diamonds with the upper 95% limits of agreement; the bias evaluated by using the hexokinase (HK) method is shown in red triangles with the lower 95% limit of agreement.
Figure 2.

Bland-Altman plots of 18 blood glucose monitoring system (BGMS) (system 1-system 18). The relative differences in percentages between an individual result of a BGMS and the corresponding result of the comparison method, glucose oxidase (GOD), or hexokinase (HK), were plotted against the average of the result of the BGMS and the corresponding result of the comparison method. The solid line at 0% difference is the line of identity; the dashed gray line is the relative bias; and the solid grey lines are the upper and lower 95% limits of agreement, respectively. Data points evaluated by using the GOD method are shown in blue diamonds; data points evaluated by using the HK method are shown in red triangles.
Regression analysis according to Passing and Bablok 30 showed that slopes between the BGMS and the GOD method ranged from 0.85 to 1.08 and from 0.81 to 1.01 when compared with the HK method. MARD results of the 18 evaluated BGMS ranged from 3.7% to 9.8% when compared with GOD values (Table 2) and from 2.3% to 10.5% when compared with HK values (Table 3).
Discussion
This study aimed to investigate the anticipated influence of the comparison measurement procedure on the apparent level of system accuracy. To characterize this influence, the accuracy of 18 currently available CE-labeled BGMS (each with one reagent system lot) was evaluated versus two established comparison measurement procedures, the GOD-based YSI 2300 STAT Plus glucose analyzer and the HK-based Cobas Integra 400 plus. For two BGMS (approximately 10% of BGMS), the selection of a comparison measurement procedure influenced whether the accuracy criteria of ISO 15197 were met or not. All numerical parameters that were analyzed, that is, bias and 95% limits of agreement according to Bland and Altman, linear regression according to Passing and Bablok, and MARD were affected by the selected measurement procedure method. Bias, which indicates the systematic difference between the test system and comparison measurement procedure, differed by 4.3%-4.5% (except for system 7, which displayed whole blood-equivalent values), reflecting the systematic difference between the HK-based and the GOD-based measurement procedure, with the HK-based procedure providing higher results than the GOD-based procedure. In the absence of a measurement procedure of higher metrological order (ie, isotope dilution-gas-chromatography-mass spectrometry), it cannot clearly be determined whether the systematic difference is due to the HK-based measurement procedure, the GOD-based measurement procedure, or both. Slopes of the linear regression equation showed up to 7% relative change, and MARD results were up to 3.9% different. These results suggest that there are also qualitative differences in the imprecision of the two comparison measurement procedures.
Inferring from the results, differences in the systematic error (bias) of BGMS can also appear when manufacturers use other reference measurement procedures (or devices) during the production of their systems than those used as a comparison measurement procedure in independent postmarket evaluation studies. According to ISO 15197, which is primarily addressed at manufacturers of BGMS, the comparison measurement procedure has to be traceable according to requirements of ISO 17511. Although both comparison measurement procedures used in this study comply with this requirement, considerable systematic differences were found. Yet, only a few studies investigated possible systematic differences between different comparison methods (GOD or HK) or measurement procedures up to now, whereas a bias of up to 8% between the different comparison measurement procedures has been reported.21,31-35
Because ISO 15197 is primarily addressed at manufacturers, it might be advisable to assess BGMS accuracy with a comparison measurement procedure that is expected to provide results similar to the manufacturer’s reference measurement procedure, for example, using the same enzymatic (GOD or HK) reaction.
Differences like those found in this study should also be kept in mind when accuracy studies of BGMS are interpreted so that the match between manufacturer’s reference measurement procedure and the studies’ comparison measurement procedure(s) can be verified.36-40 Such differences might be exacerbated by other influencing factors, like using venous samples for which not all BGMS might be indicated. 39 Accordingly, two BGMS, one being calibrated using a GOD-based, the other using an HK-based reference measurement procedure, and both showing a high level of accuracy according to ISO 15197 against the manufacturers’ reference measurement procedure, could possibly show, at the same time, systematically different results when being independently evaluated using the same comparison measurement procedure.33-35 If patients in such cases switched from one BGMS to another, for example, because their previous BGMS is discontinued, the quality of their diabetes therapy may be affected by such a bias without them noticing. For example, although systems 2 and 8 showed 100% and 99.5% of measurement results within ISO 15197 accuracy limits (criterion A) when compared with results obtained with the respective manufacturer’s reference measurement procedure, the systematic measurement difference between these two systems was approximately 9%. If a patient with diabetes with a target value of 100 mg/dL and a correction factor of 1 unit per 30 mg/dL were used to values from system 2 and switched to system 8, values of 165 mg/dL (system 8) would correspond to values of approximately 180 mg/dL (system 2). This difference of 15 mg/dL would lead to approximately 0.5 fewer units to be administered. Over time, the resulting continuous under-dosage of insulin could negatively impact the therapeutic outcome. Also in the context of the ISO 15197 accuracy criterion that describes a range of ±15% at glucose concentrations ≥100 mg/dL, a bias of approximately 4%-5% like it was found in this study may have a considerable impact on the fulfillment of this criterion.
The current requirement of traceability according to ISO 17511 as stated by ISO 15197, without specifying further requirements or performance goals, might be insufficient in light of the considerable systematic differences between measurement procedures observed in this and other studies.21,33 Therefore, further efforts toward harmonization of comparison measurement results, for example, introducing performance goals for measurement procedures when using manufacturer-independent quality control materials, or standardizing requirements for calibration to higher-order reference materials and methods, could be helpful. Another approach is used, for example, by the Clinical and Laboratory Standards Institute’s (CLSI) guideline CLSI POCT12-A3, which stipulates that the comparison method should demonstrate “analytical imprecision ≤2.9%, bias ≤2.2%, and total error ≤6.9%” during an operator performance evaluation using certified reference material or trueness control material that is commutable to human serum or plasma. 41 Commutability relates to the ability of the analyzer to provide measurement results using such quality control materials that, in a method comparison, show the same relationship as, for example, using standard samples (eg, human blood panels). This is not always the case, as recently published by Bukve et al, 42 so that the POCT12-A3 recommendation to assess the commutability of such material should be acknowledged.
Conclusion
In summary, the results of this study indicate that the comparison measurement procedure may have an appreciable impact on the apparent level of measurement accuracy obtained for a BGMS in accuracy studies. Because of systematic differences between the reference measurement procedures used for BGMS calibration and for system accuracy assessment and their potential impact on therapy for patients with diabetes, further steps toward harmonization of these measurement procedures’ results are important.
Footnotes
Declaration of Conflicting Interests: The author(s) declared the following potential conflicts of interest with respect to the research, authorship, and/or publication of this article: GF is general manager of the IDT (Institut für Diabetes-Technologie Forschungs-und Entwicklungsgesellschaft mbH an der Universität Ulm, Ulm, Germany), which carries out clinical studies on the evaluation of BG meters and medical devices for diabetes therapy on its own initiative and on behalf of various companies. GF/IDT have received speakers’ honoraria or consulting fees from Abbott, Ascensia, Dexcom, i-SENS, LifeScan, Menarini Diagnostics, Metronom Health, Novo Nordisk, PharmaSense, Roche, Sanofi, Sensile and Ypsomed. The other authors are employees of IDT.
Funding: The author(s) disclosed receipt of the following financial support for the research, authorship, and/or publication of this article: This study was funded by Institut für Diabetes-Technologie Forschungs-und Entwicklungsgesellschaft mbH an der Universität Ulm, Germany; LifeScan Scotland Limited, United Kingdom; Ascensia Diabetes Care Deutschland GmbH, Germany; Roche Diabetes Care GmbH, Germany; i-SENS GmbH, Germany; Beurer GmbH, Germany; AgaMatrix Europe Limited, United Kingdom.
ORCID iDs: Guido Freckmann  https://orcid.org/0000-0002-0406-9529.
Annette Baumstark
https://orcid.org/0000-0002-3439-7400.
Sebastian Schauer
https://orcid.org/0000-0002-9873-0989.
Stefan Pleus
https://orcid.org/0000-0003-4629-7754.
References
- 1. American Diabetes Association. Standards of medical care in diabetes - 2019. Diabetes Care. 2019;42(suppl 1):S46-S60. [DOI] [PubMed] [Google Scholar]
- 2. Österreichische Diabetes Gesellschaft. Diabetes mellitus - Anleitungen für die Praxis. Wien Klin Wochenschr. 2012;124 (suppl 2):1-128. [Google Scholar]
- 3. Scottish Intercollegiate Guidelines Network. Management of diabetes - a national clinical guideline. Scottish Intercollegiate Guidelines Network, 2010. https://www.sign.ac.uk/assets/sign116.pdf. Accessed September 8, 2015. [Google Scholar]
- 4. Hirsch IB, Bode BW, Childs BP, et al. Self-monitoring of blood glucose (SMBG) in insulin- and non-insulin-using adults with diabetes: consensus recommendations for improving SMBG accuracy, utilization, and research. Diabetes Technol Ther. 2008;10(6):419-439. [DOI] [PubMed] [Google Scholar]
- 5. Blonde L, Karter AJ. Current evidence regarding the value of self-monitored blood glucose testing. Am J Med. 2005;118(suppl 9A):20S-26S. [DOI] [PubMed] [Google Scholar]
- 6. IDF Clinical Guidelines Task Force. Global Guideline for type 2 diabetes: recommendations for standard, comprehensive, and minimal care. Diabet Med. 2006;23(6):579-593. [DOI] [PubMed] [Google Scholar]
- 7. Rodbard HW, Blonde L, Braithwaite SS, et al. American association of clinical endocrinologists medical guidelines for clinical practice for the management of diabetes mellitus. Endocr Pract. 2007;13(suppl 1):1-68. [DOI] [PubMed] [Google Scholar]
- 8. Diabetes Control Complications Trial Research Group, Nathan DM, Genuth S, et al. The effect of intensive treatment of diabetes on the development and progression of long-term complications in insulin-dependent diabetes mellitus. N Engl J Med. 1993;329(14):977-986. [DOI] [PubMed] [Google Scholar]
- 9. Budiman ES, Samant N, Resch A. Clinical implications and economic impact of accuracy differences among commercially available blood glucose monitoring systems. J Diabetes Sci Technol. 2013;7(2):365-380. [DOI] [PMC free article] [PubMed] [Google Scholar]
- 10. Hellman R. Glucose meter inaccuracy and the impact on the care of patients. Diabetes Metab Res Rev. 2012;28(3):207-209. [DOI] [PubMed] [Google Scholar]
- 11. Lagarde WH, Barrows FP, Davenport ML, Kang M, Guess HA, Calikoglu AS. Continuous subcutaneous glucose monitoring in children with type 1 diabetes mellitus: a single-blind, randomized, controlled trial. Pediatr Diabetes. 2006;7(3):159-164. [DOI] [PubMed] [Google Scholar]
- 12. Bergenstal RM, Gavin JR, III, Global Consensus Conference on Glucose Monitoring Panel. The role of self-monitoring of blood glucose in the care of people with diabetes: report of a global consensus conference. Am J Med. 2005;118(suppl 9A):1S-6S. [DOI] [PubMed] [Google Scholar]
- 13. Kempf K, Kruse J, Martin S. ROSSO-in-praxi: a self-monitoring of blood glucose-structured 12-week lifestyle intervention significantly improves glucometabolic control of patients with type 2 diabetes mellitus. Diabetes Technol Ther. 2010;12(7):547-553. [DOI] [PubMed] [Google Scholar]
- 14. Martin S, Schneider B, Heinemann L, et al. Self-monitoring of blood glucose in type 2 diabetes and long-term outcome: an epidemiological cohort study. Diabetologia. 2006;49(2):271-278. [DOI] [PubMed] [Google Scholar]
- 15. Polonsky WH, Fisher L, Schikman CH, et al. Structured self-monitoring of blood glucose significantly reduces A1C levels in poorly controlled, noninsulin-treated type 2 diabetes: results from the structured testing program study. Diabetes Care. 2011;34(2):262-267. [DOI] [PMC free article] [PubMed] [Google Scholar]
- 16. Schrangl P, Reiterer F, Heinemann L, Freckmann G, Del Re L. Limits to the evaluation of the accuracy of continuous glucose monitoring systems by clinical trials. Biosensors (Basel). 2018;8(2):50. [DOI] [PMC free article] [PubMed] [Google Scholar]
- 17. DIN Deutsches Institut für Normung. Testsysteme für die In-vitro-Diagnostik - Anforderungen an Blutzuckermesssysteme zur Eigenanwendung beim Diabetes melllitus (ISO 15197:2003); Deutsche Fassung EN ISO 15197:2003 (DIN EN ISO 15197:2003). 2003. [Google Scholar]
- 18. International Organization for Standardization. In Vitro Diagnostic Test Systems - Requirements for Blood-Glucose Monitoring Systems for Self-Testing in Managing Diabetes Mellitus. ISO 15197:2013. 2013. [Google Scholar]
- 19. International Organization for Standardization: In Vitro Diagnostic Test Systems - Requirements for Blood-Glucose Monitoring Systems for Self-Testing in Managing Diabetes Mellitus. ISO 15197:2013. 2015. [Google Scholar]
- 20. International Organization for Standardization. In Vitro Diagnostic Medical Devices – Measurement of Quantities in Biological Samples – Metrological Traceability of Values Assigned to Calibrators and Control Materials. EN ISO 17511:2003. 2003. [Google Scholar]
- 21. Twomey PJ. Plasma glucose measurement with the Yellow Springs Glucose 2300 STAT and the Olympus AU640. J Clin Pathol. 2004;57(7):752-754. [DOI] [PMC free article] [PubMed] [Google Scholar]
- 22. Thorpe GH. Assessing the quality of publications evaluating the accuracy of blood glucose monitoring systems. Diabetes Technol Ther. 2013;15(3):253-259. [DOI] [PMC free article] [PubMed] [Google Scholar]
- 23. Freckmann G, Baumstark A, Pleus S. Do the new FDA guidance documents help improving performance of blood glucose monitoring systems compared with ISO 15197? J Diabetes Sci Technol. 2017;11(6):1240-1246. [DOI] [PMC free article] [PubMed] [Google Scholar]
- 24. Bailey TS, Klaff LJ, Wallace JF, et al. Fundamental importance of reference glucose analyzer accuracy for evaluating the performance of blood glucose monitoring systems (BGMSs). J Diabetes Sci Technol. 2016;10(4):872-875. [DOI] [PMC free article] [PubMed] [Google Scholar]
- 25. Pleus S, Baumstark A, Jendrike N, et al. System accuracy evaluation of 18 CE-marked current-generation blood glucose monitoring systems based on EN ISO 15197:2015. BMJ Open Diabetes Res Care. 2020;8(1):e001067. [DOI] [PMC free article] [PubMed] [Google Scholar]
- 26. Jeanny G, Hope P. Surveillance of the system accuracy of two systems for self-monitoring of blood glucose after market approval. J Diabetes Sci Technol. 2015;10(1):240-241. [DOI] [PMC free article] [PubMed] [Google Scholar]
- 27. Bundesärztekammer. Richtlinie der Bundesärztekammer zur Qualitätssicherung laboratoriumsmedizinischer Untersuchungen. Deutsches Ärzteblatt. 2014;111:1583-1618. [Google Scholar]
- 28. Astles JR, Sedor FA, Toffaletti JG. Evaluation of the YSI 2300 glucose analyzer: algorithm-corrected results are accurate and specific. Clin Biochem. 1996;29(1):27-31. [DOI] [PubMed] [Google Scholar]
- 29. Bland JM, Altman DG. Statistical methods for assessing agreement between two methods of clinical measurement. Lancet. 1986;1(8476):307-310. [PubMed] [Google Scholar]
- 30. Passing H, Bablok W. A new biometrical procedure for testing the equality of measurements from two different analytical methods. Application of linear regression procedures for method comparison studies in clinical chemistry, Part I. J Clin Chem Clin Biochem. 1983;21(11):709-720. [DOI] [PubMed] [Google Scholar]
- 31. Genter PM, Ipp E. Accuracy of plasma glucose measurements in the hypoglycemic range. Diabetes Care. 1994;17(6):595-598. [DOI] [PubMed] [Google Scholar]
- 32. Freckmann G, Link M, Baumstark A, et al. System accuracy evaluation of 10 SMBG systems with 3 lots each following ISO 15197:2013 against 2 different comparison methods. 50th EASD Annual Meeting 15-19 September 2014. Vienna, Austria; 2014. [Google Scholar]
- 33. Freckmann G, Link M, Schmid C, Pleus S, Baumstark A, Haug C. System accuracy evaluation of different blood glucose monitoring systems following ISO 15197:2013 by using two different comparison methods. Diabetes Technol Ther. 2015;17(9):635-648. [DOI] [PubMed] [Google Scholar]
- 34. Link M, Schmid C, Pleus S, et al. System accuracy evaluation of four systems for self-monitoring of blood glucose following ISO 15197 using a glucose oxidase and a hexokinase-based comparison method. J Diabetes Sci Technol. 2015;9(5):1041-1050. [DOI] [PMC free article] [PubMed] [Google Scholar]
- 35. Baumstark A, Jendrike N, Pleus S, Haug C, Freckmann G. Evaluation of accuracy of six blood glucose monitoring systems and modeling of possibly related insulin dosing errors. Diabetes Technol Ther. 2017;19(10):580-588. [DOI] [PubMed] [Google Scholar]
- 36. Freckmann G, Schmid C, Baumstark A, Pleus S, Link M, Haug C. System accuracy evaluation of 43 blood glucose monitoring systems for self-monitoring of blood glucose according to DIN EN ISO 15197. J Diabetes Sci Technol. 2012;6(5):1060-1075. [DOI] [PMC free article] [PubMed] [Google Scholar]
- 37. Pfützner A, Mitri M, Musholt PB, et al. Clinical assessment of the accuracy of blood glucose measurement devices. Curr Med Res Opin. 2012;28(4):525-531. [DOI] [PubMed] [Google Scholar]
- 38. Hasslacher C, Kulozik F, Platten I. Accuracy of self monitoring blood glucose systems in a clinical setting: application of new planned ISO- standards. Clin Lab. 2013;59(7-8):727-733. [DOI] [PubMed] [Google Scholar]
- 39. Ekhlaspour L, Mondesir D, Lautsch N, et al. Comparative accuracy of 17 point-of-care glucose meters. J Diabetes Sci Technol. 2017;11(3):558-566. [DOI] [PMC free article] [PubMed] [Google Scholar]
- 40. Klonoff DC, Parkes JL, Kovatchev BP, et al. Investigation of the accuracy of 18 marketed blood glucose monitors. Diabetes Care. 2018;41(8):1681-1688. [DOI] [PubMed] [Google Scholar]
- 41. Clinical and Laboratory Standards Institute. POCT12-A3 - Point-of-Care Blood Glucose Testing in Acute and Chronic Care Facilities. 3rd ed. Wayne, PA: Clinical and Laboratory Standards Institute; 2013. [Google Scholar]
- 42. Bukve T, Sandberg S, Vie WS, Sølvik U, Christensen NG, Stavelin A. Commutability of a whole-blood external quality assessment material for point-of-care C-reactive protein, glucose, and hemoglobin testing. Clin Chem. 2019;65(6):791-797. [DOI] [PubMed] [Google Scholar]