Abstract
3D spatial data has been generated at an extreme scale from many emerging applications, such as high definition maps for autonomous driving and 3D Human BioMolecular Atlas. In particular, 3D digital pathology provides a revolutionary approach to map human tissues in 3D, which is highly promising for advancing computer-aided diagnosis and understanding diseases through spatial queries and analysis. However, the exponential increase of data at 3D leads to significant I/O, communication, and computational challenges for 3D spatial queries. The complex structures of 3D objects such as bifurcated vessels make it difficult to effectively support 3D spatial queries with traditional methods. In this article, we present our work on building an efficient and scalable spatial query system, iSPEED, for large-scale 3D data with complex structures. iSPEED adopts effective progressive compression for each 3D object with successive levels of detail. Further, iSPEED exploits structural indexing for complex structured objects in distance-based queries. By querying with data represented in successive levels of details and structural indexes, iSPEED provides an option for users to balance between query efficiency and query accuracy. iSPEED builds in-memory indexes and decompresses data on-demand, which has a minimal memory footprint. iSPEED provides a 3D spatial query engine that can be invoked on-demand to run many instances in parallel implemented with, but not limited to, MapReduce. We evaluate iSPEED with three representative queries: 3D spatial joins, 3D nearest neighbor query, and 3D spatial proximity estimation. The extensive experiments demonstrate that iSPEED significantly improves the performance of existing spatial query systems.
Keywords: Spatial data management, 3D, in-memory computing, digital pathology
1. INTRODUCTION
3D spatial data has been used in numerous industrial applications, such as CAD, urban planning, terrain modeling, mineral exploration, environmental assessments, 3D mapping, 3D navigation, and recent HD maps for autonomous driving [2, 3, 5, 8–10]. Managing and analyzing large amount of 3D spatial data to derive values and guide decision making have become essential to business success and scientific discoveries [12, 13]. Beyond industrial applications, 3D spatial data emerge in various biomedical applications, such as Human Protein Atlas [14] and spatial epigenomics [15]. In the past few years, the NIH (National Institute of Health) launched two major initiatives, the Human BioMolecular Atlas Program [29], which aims to create an open and global platform to map healthy cells in the human body at cellular and subcelluar level, and the Human Tumor Atlas Network [55] initiative, which constructs three-dimensional atlases of the dynamic cellular, morphological, and molecular features of human cancers. In the past decade, digital pathology has emerged as a powerful approach to assist disease diagnosis and advance biomedical research, which has been recently approved by the FDA [7]. With 2D digital pathology, human tissues embedded in glass slides can be scanned into high-resolution 2D images with rich information on microanatomic objects such as nuclei, cells, vessels, ducts, among others, which carries essential morphological and spatial patterns for understanding diseases. As 2D projected appearances of 3D pathologic objects highly depend on the locations and angles of the cutting planes randomly selected during tissue slide preparation process, 3D spatial relationships could be misrepresented after such projection. Recently, 3D digital pathology imaging is made possible through slicing tissue block into serial sections (Figure 1). The information-lossless 3D tissue space represented by pathology imaging volumes holds significant potential to enhance studies of both normal and disease processes.
Fig. 1.

The workflow of 3D pathology imaging with spatial queries.
The first step for 3D pathology imaging is to derive 3D micro-anatomic objects, together with their associated features using 3D registration, segmentation, and reconstruction [40–42]. After converting pixel and voxel data into 3D structured data, the next step is to explore spatial relationships among a massive number of such 3D objects, to discover spatial patterns and their correlations with diseases. For example, in brain tumor studies, we would like to measure the distances from cells to their nearest neighboring tumor vessels. As another example, we would like to use a containment query to identify only cells of interest contained in a blood vessel or within certain distance from the vessel. In this article, we assume the 3D spatial objects are already derived through 3D image analysis methods. To explore massive 3D spatial biological objects, we have to address following major challenges:
Explosion of 3D Data.
Digital scanners can produce microscopy images at an extremely high resolution. A typical 2D microscopy image may contain 100,000 × 100,000 pixels, with a million micro-anatomic objects per image. A typical 3D tissue volume may generate hundreds of slices and contain tens of millions of 3D biological objects per volume, with each object represented with hundreds to thousands of mesh facets. A typical study may involve hundreds of patients and contain hundreds of tissue volumes. Such unprecedented scale of 3D objects poses significant challenges on data processing, leading to tremendous I/O, communication, and computational cost.
Complex 3D Structures.
3D spatial objects may come with complex structures. For example, blood vessels can be reconstructed to capture the 3D structural variations such as bifurcations where one main vessel grows into two small branches (Figure 4). While minimal bounding boxes (MBBs) have been successfully used in traditional spatial indexing techniques for spatial query processing, MBBs are not effective to represent such complex 3D objects to support distance-based spatial queries such as nearest neighbor search. This demands different indexing structures for querying such complex structured objects.
Fig. 4.
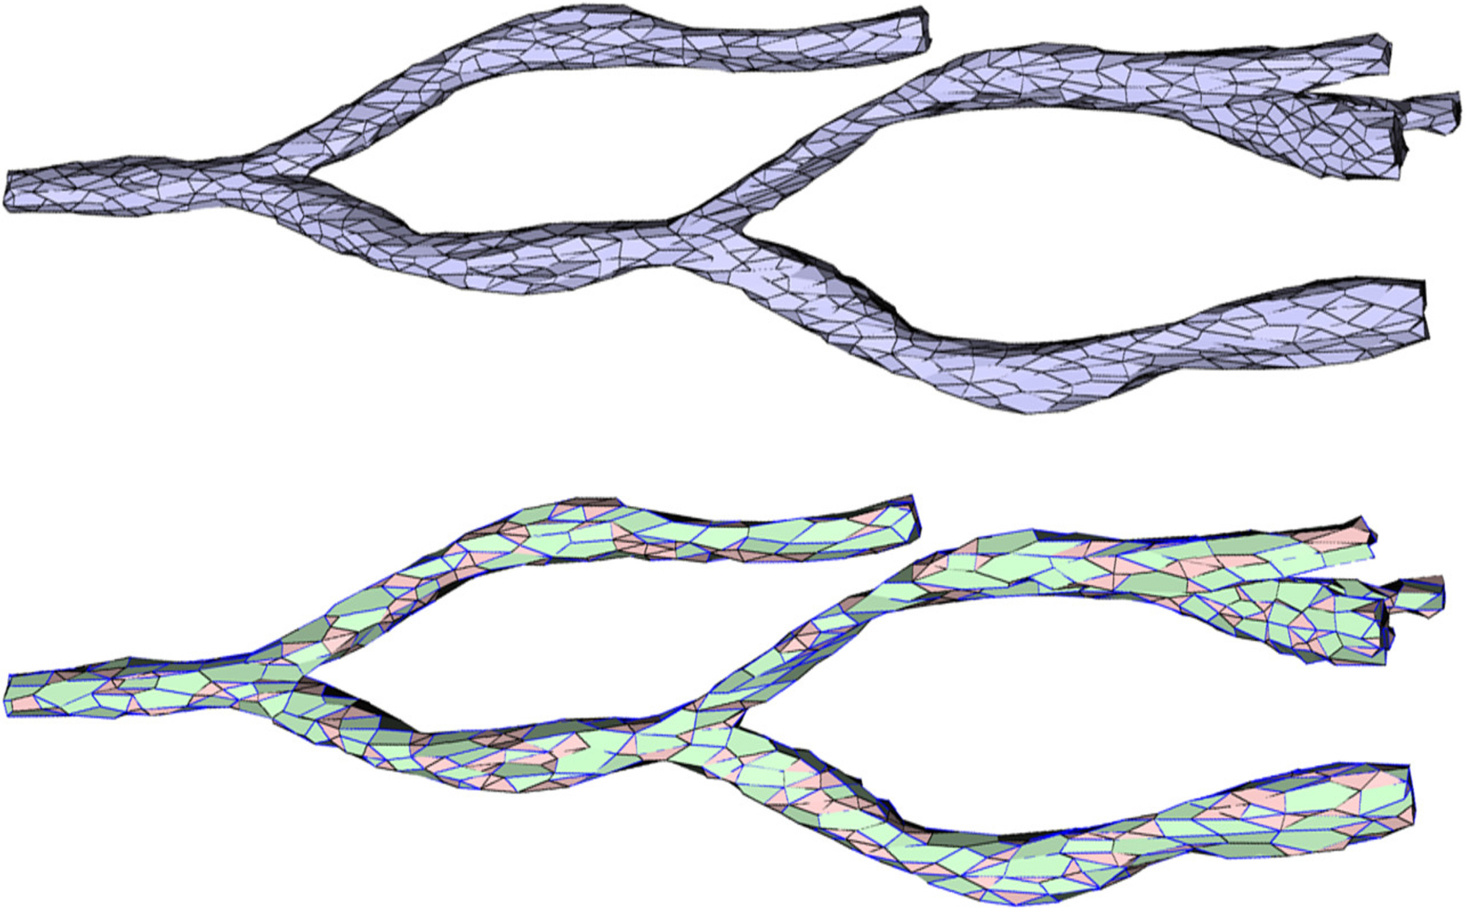
Decimation of an intermediate level of detail of the 3D blood vessel model. Top: the Li level of detail. Bottom: the Li−1 level of detail with inserted edges depicted in blue, faces with a removed vertex in green, and faces without a removed vertex in red.
High Computation Complexity.
3D spatial queries involve computationally intensive geometric operations for quantitative measurements and identifications of topology relationships. For spatial joins of large datasets, while MBBs can be used to quickly filter 3D object pairs that do not intersect, spatial refinement could be a heavy duty operation to check if intersection truly exists for polyhedron pairs. For queries that require quantitative spatial measurements such as computation of intersected volumes of objects, geometric computation could dominate the query cost [17]. Thus, the design of an efficient 3D spatial querying system needs not only to optimize I/O, but also needs to provide high scalability by using large-scale distributed computing resources.
The unique challenges of large-scale complex 3D spatial queries demand a highly efficient and scalable 3D querying system that can mitigate potential high I/O and communication cost from extreme data sizes, exploit indexing techniques suitable for complex objects, ease computational cost, and provide high scalability. Recently, several systems have been proposed to support large-scale 2D spatial queries with distributed computing, which, however, lack critical components for 3D support [17, 31, 69, 71]. Commercial systems such as Oracle Spatial only supports simple 3D objects such as cuboid or frustum or its variations, thus is not applicable to support complex structured 3D objects.
In this article, we propose iSPEED, an efficient and scalable spatial query processing system for large-scale 3D data. To achieve low latency, iSPEED stores data in a highly compressed form using an effective progressive compression approach that compresses each 3D object individually with successive levels of detail. To minimize search space and computation cost, iSPEED provides global spatial indexing in memory through partitioning at subspace level and partitioned cuboid level. iSPEED provides an in-memory 3D spatial query engine INTENSE, which can be invoked on-demand for running many instances in parallel. The parallelization of queries is implemented in, but not limited to, MapReduce. At runtime, iSPEED dynamically decompresses only needed 3D objects at the specified level of detail and creates necessary spatial indexes in-memory to accelerate query processing, such as on-demand object-level indexing and structural indexing on complex structured objects. iSPEED supports multiple spatial queries, including spatial joins, nearest neighbor, and can be easily extended to others. iSPEED makes it possible to balance between query efficiency and accuracy based on users’ preferences. Our main contributions are summarized as follows:
The 3D data compression approach makes it possible to significantly reduce the data size, which leads to much reduced I/O and communication cost for distributed query processing.
We propose to model 3D objects with multiple levels of detail for spatial queries, which provides options for users to decide their goals for faster queries or higher accuracy to meet application-specific requirements.
We provide multi-level in-memory spatial indexing to reduce search space and accelerate queries. In particular, we propose unique structural indexing for searching with complex structured objects, which significantly improves query performance compared to traditional MBB-based indexing.
We develop an on-demand in-memory-based 3D spatial query engine that fully takes advantage of multi-level indexing and data decompression for processing multiple types of spatial queries, which can be implemented with MapReduce or other distributed computing paradigms.
Our experiments demonstrate that iSPEED achieves significant benefits on efficiency and scalability of spatial queries over existing spatial query systems.
This article is a substantial extension from our work previously published at SIGSPATIAL’17 [39]. Besides, a poster published at SIGSPATIAL’16 introduces the concept of a system Hadoop-GIS 3D [38], an extension of Hadoop-GIS [17] from 2D to 3D, with very limited details and preliminary results. A GUI to demonstrate how the system works and the methodology is introduced in a demo paper published at VLDB’18 [64]. Significant new contributions in this article include:
We proposed methods to quantitatively measure the geometric loss of 3D data compression and studied how this will impact the final 3D query results. Our evaluation results reveal that the effect of minor information loss in the compressed data is negligible in practice.
We studied the 3D Nearest Neighbor (NN) Query with skeleton-based structural indexing and integrated its workflow into our system.
We presented the algorithm details of each 3D spatial query in our 3D spatial query engine [39].
We conducted new experiments to evaluate the effects of 3D data compression to the 3D spatial query results and extended existing experiments by investigating the performance of the new added skeleton-based 3D NN query in the system.
The article is organized as follows: We first provide an overview of our approach (Section 2) and present 3D data compression and in-memory data management (Section 3). Next, we discuss spatial data partitioning and global indexing (Section 4) and the on-demand in-memory 3D spatial query engine (Section 5). We present the query pipelines and the parallelization in Section 6. We evaluate the system in Section 7, followed by Related Work and Conclusion.
2. OVERVIEW
2.1. 3D Objects from Digital Pathology
3D image analysis of pathology image volumes produces large amount of quantification such as 3D spatial objects and features [40]. In a typical 3D analytical pathology imaging pipeline, selected tissues are sectioned into thin slices, and special staining is performed on each slice to highlight certain types of structures, and each slice is mounted onto a physical glass. These slides are then scanned into 2D digital images to form 3D image volumes. With the image volume, micro-anatomic objects of interest such as blood vessels and nuclei are segmented and reconstructed into 3D models, as shown in Figure 1. Finally, the 3D objects as well as their extracted features are managed and queried by a spatial data management system, which is the focus of our article.
Common biological objects extracted from pathology images include nuclei or cells, fats, blood vessels, ducts, and many others. While nuclei have relatively simple shapes, blood vessels and ducts could have complex structures such as bifurcations with multiple branches. The spatial relationships and distribution patterns among these objects play a critical role for understanding of tumor microenvironment and investigations of disease progression [27].
There exist multiple models for 3D object representation [1], and we use a common mesh-based approach with polyhedral modeling [46]. The mesh-based model specifies both the geometry (shapes, sizes, and absolute positions) and topology (relationships among elements).
2.2. Common 3D Queries
Spatial data exploration involves both feature queries and spatial queries, and we will focus on spatial queries in our article. In particular, we explore two representative data- and compute- intensive 3D spatial queries: spatial joins/cross-matching and nearest neighbor query. Besides, a real-world spatial proximity estimation query that relies on nearest neighbor query will be evaluated in the experimental evaluation section.
3D Spatial Join or Cross-matching.
3D spatial overlay/cross-matching problem involves identifying and comparing 3D objects from different observations or analyses [65, 66]. In 3D pathology imaging, spatial cross-matching is often used to compare and evaluate 3D image segmentation or reconstruction results, iteratively develop high-quality image analysis algorithms and consolidate multiple analysis results from different approaches to generate more confident results. Spatial cross-matching can also be used to explore temporal changes of 3D topographic maps between historical snapshots.
3D Nearest Neighbor Query.
Nearest neighbor query (NN) is a well-studied problem that arises in numerous fields of applications. For each target object, a nearest neighbor query retrieves the object in a given set of objects whose distance, Euclidean distance, for example, from the target object is minimum. In 3D pathology image analysis, for instance, pathologists are interested in objects with spatial patterns, as they present biologically meaningful correlations and prognostic values [68]. In clinics, tumor areas often form groups of cells close to blood vessels for more nutrition and oxygen. Thus, one example query of interest to pathologists is for each cell to find the nearest 3D blood vessel and return the distance. 3D nearest neighbor query can also support to find the closest post office in a 3D map navigation or discover the top k nearby targets in 3D gaming by k-nearest neighbor search.
Spatial Proximity Estimation.
Spatial proximity estimation aims to explore inter-objects distribution in 3D space based on distances between neighboring objects. In 3D digital pathology, spatial proximity estimation provides the quantitative expression of vascular spatial patterns for disease progression assessment [58]. For example, for a liver pathologist, a common question to ask is, for each cell in liver tissue, find the shortest path to its neighboring artery vessel and the shortest path to its neighboring vein vessel, and then compute the average and standard deviation (dispersion) of the full path that adds the two paths (Figure 2). The query is defined as follows: Suppose we have a set of basic objects oi and multiple types (a to m) of target objects ta, tb, . . ., tm. For each basic object oi (e.g., a cell) and each type of target objects tj (e.g., artery or vein), compute the corresponding shortest distance and return the sum of the shortest path . Then for all objects, the mean and standard deviation of are computed as the spatial proximity measurement among target objects tj. In summary, spatial proximity estimation is a special query that relies on extensive nearest neighbor search on massive number of objects for aggregation and statistical analysis.
Fig. 2.
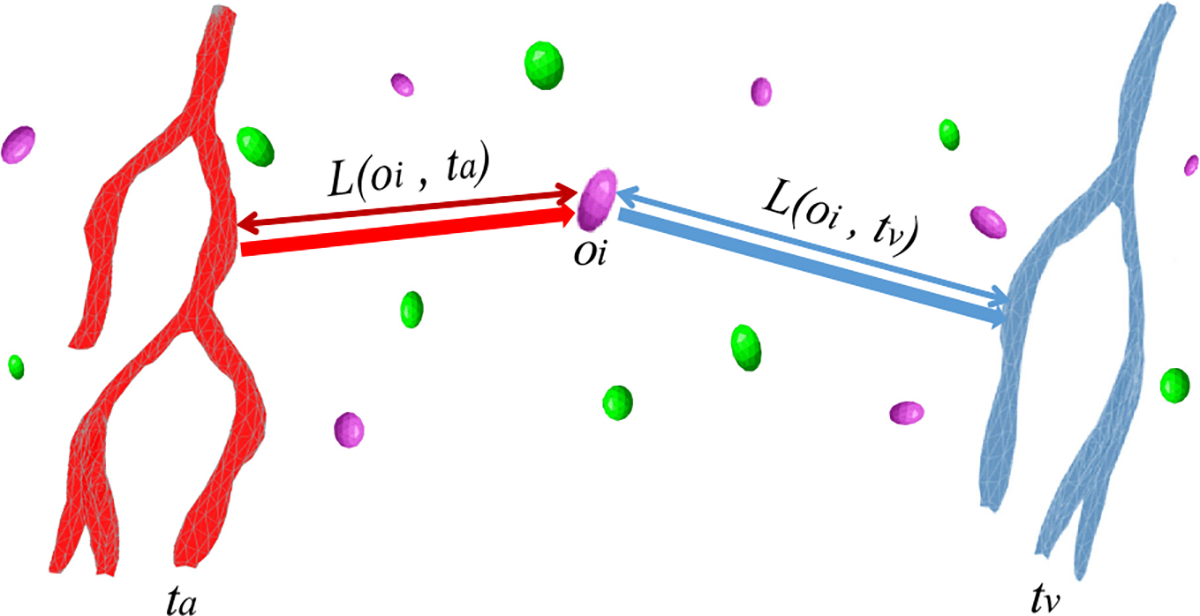
An example of 3D spatial proximity estimation of artery (red) and vein (blue).
2.3. System Overview
One major goal of iSPEED (efficient spatial query system for three dimensional spatial data) is to mitigate potential high I/O and communication cost, exploit indexing techniques for complex objects to accelerate queries, and provide high scalability to run on large computer clusters or computing clouds. The architecture overview of iSPEED is shown in Figure 3. Initial 3D data is first staged in a distributed file system such as HDFS and pre-processed for compression and indexing. Pre-processing will also provide spatial data partitioning to generate partitioned cuboids that form the unit of parallel query tasks. Partitioning creates two-level global spatial indexes: partitioned cuboid index to represent the MBB of all cuboids and subspace index to group neighboring cuboids into large subspaces to form a higher level spatial index (Figure 6). As only MBBs are used, these indexes are small enough to be stored in memory.
Fig. 3.
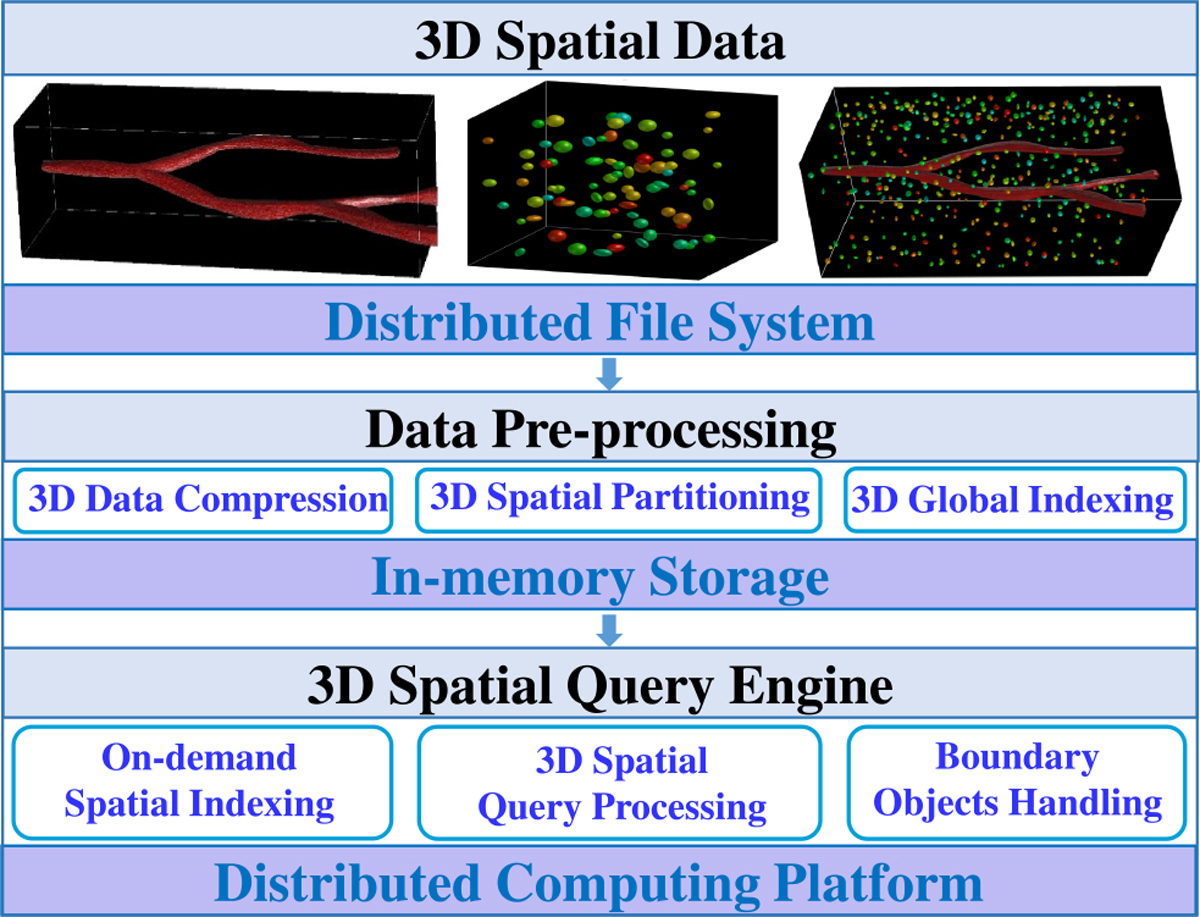
Architecture overview of iSPEED.
Fig. 6.
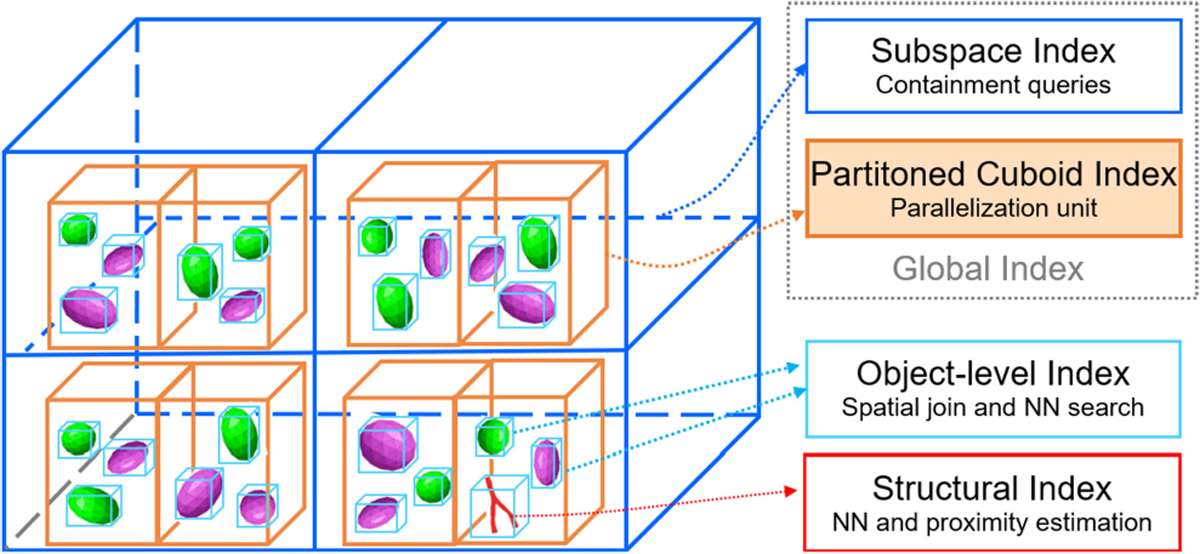
Hierarchical view of multi-level indexing in iSPEED.
In addition, iSPEED creates on-demand spatial indexes in memory during query processing to accelerate the queries. On-demand spatial indexing includes object-level index, which is based on the MBBs of all objects within a single partition (cuboid), and structural index for individual complex structured objects such as blood vessels. Multi-level spatial indexing will be discussed in Sections 4 and 5.
iSPEED provides an on-demand in-memory three dimen-sional spatial query engine INTENSE to run query tasks. INTENSE can be invoked on-demand to run many instances in parallel. For each query task, the 3D objects are partitioned into proper cuboids with the master object index, and for each cuboid, INTENSE will create an in-memory index such as R*-tree for query processing with the 3D objects assigned to it. As such index only contains MBBs, thus its size is very small and can be maintained in memory comfortably. A typical spatial query such as spatial join normally starts with MBB index (object-level spatial index)-based filtering to identify potential object pairs with the specified spatial relationship. Only at the refinement or spatial measurement step, the original geometries will be needed for geometric computations such as computing if two polyhedrons intersect or intersecting volume. INTENSE will decompress the objects based on specified level of detail to feed them to the query engine. Note that a typical query task runs on a single core and has a sequential processing pipeline, and only a very small number of objects are decompressed at a time, which takes little memory.
iSPEED provides parallel querying pipelines for multiple spatial query types, with partitioned datasets as the basis for parallelization. Query parallelization can be implemented through distributed computing paradigms, and we take Hadoop for our implementation. Note that data partitioning has to handle objects crossing boundaries of partitions. Each query pipeline will provide additional results normalization job to amend the results if needed.
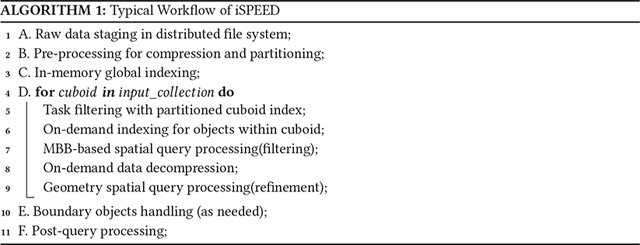
A typical workflow of iSPEED is presented in Algorithm 1. In step A, the 3D spatial objects are staged in a distributed file system. Then data compression and spatial partitioning are performed as pre-processing in Step B. Step C builds the global indexes on all nodes for partitioning. Step D executes partitioned cuboid-based spatial query processing in parallel by first identifying 3D objects within one cuboid with partitioned cuboid index, building object-level index on-demand on each cuboid, and executing queries with filtering and refinement steps. Step E is for boundary objects handling if needed, and step F provides post-query processing such as final results aggregation.
3. 3D SPATIAL DATA COMPRESSION
3D spatial data is often represented with high precision models, leading to complex meshes and large sizes. We use an effective progressive compression approach to compress each 3D object individually. At the same time, we extract the MBB of each object to facilitate queries with indexing.
3.1. 3D Mesh Compression
3D mesh compression has been studied in a range of applications, such as simulation, CAD, and imaging [34, 45, 51], to reduce data sizes and alleviate the burden of network communication. iSPEED adapts a progressive polyhedron mesh compression algorithm [45] and compresses individual 3D objects. The compression generates successive levels of detail (LOD) for a 3D mesh to meet different accuracy requirements. Higher LOD contains more vertices and faces, which brings better description of the object surface. The ith level of detail is denoted as Li in this article.
The compression process consists of three steps: (i) Decimation: The decimation step aims to simplify a mesh LOD Li as much as possible to generate Li−1 by progressively removing vertices and adding new edges to the mesh (Figure 4); (ii) Patch and Edge Encoding: This step encodes the decimated meshes by producing three symbol lists to record the connectivity and geometry of the new mesh. For the LOD Li, symbol list Fi indicates if a face has a removed vertex or not, Ri records the residuals of a patch with a removed vertex, and Ei encodes which edges have or have not been inserted; (iii) Entropy Coding: The coding step further compresses the three symbol lists by the range coder. Two methods are used to improve the rate-distortion performance by a wavelet decomposition and an adaptive quantization technique [45]. During data compression, the new mesh LOD Li−1 contains about 30% less vertices compared the LOD Li, and the base mesh L0 is the lowest LOD. Figure 5 shows the compressed file structure with a compressed nucleus illustrating different LODs.
Fig. 5.
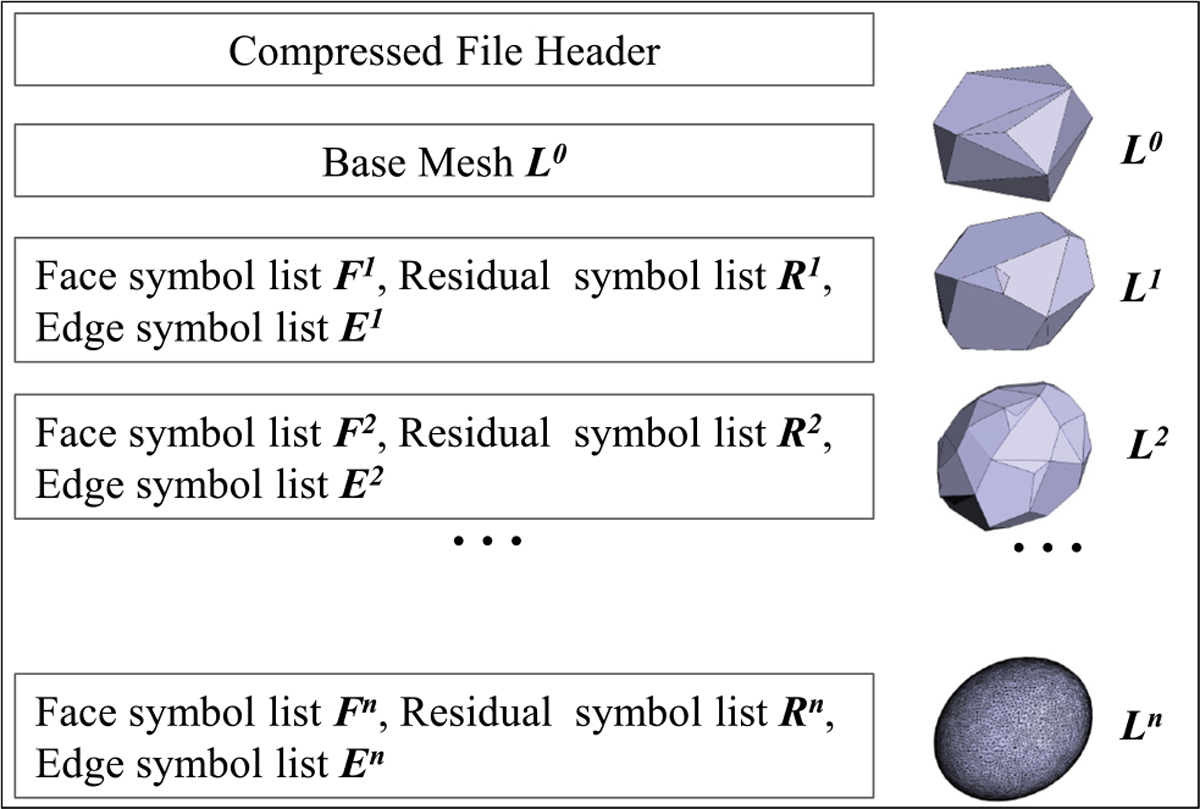
The compressed file structure with a compressed nucleus illustrating different LODs.
Highly effective compression significantly reduces the overall data size, and the compression ratio depends on the structure complexity of the mesh object. Our experiments indicate that the size of the base mesh L0 is less than 1% of the total file size of the raw data, and the size of the whole compressed file with multiple LODs (10 levels in our setup) is only about 3% of the raw file size. The significant reduction of the storage size comes from two aspects. On one hand, removing one vertex and the faces it connects could reduce the complexity of maintaining the connection information. For instance, when a vertex that connects four triangle faces is removed, those four triangle faces are replaced with a single quadrangle face. Those four triangles can be restored in the decompressing process with the quadrangle face and the removed vertex, but the entire storage space is saved. On the other hand, the entropy coding step further shrinks the overall file size. For a typical 3D volume in digital pathology of 1 TB in size, the final size after compression will be about 30 GB, which could well fit into the memory of a cluster of compute nodes after distribution.
3.2. Quantitative Measurement of Information Loss in Spatial Compression
Note that as the data compression algorithm is not lossless, high compression rate could incur potential structure distortion. To quantitatively measure the actual geometric difference between the original and the compressed 3D meshes, an approximate distance-based metric is taken as our evaluation approach [28]. Suppose p = (x, y, z) is a 3D point and S′ is a surface, then the distance between p and S′, denoted as d (p, S′), is defined as the Euclidean distance between point p and the point on S′ that is closest to p. Given sets of sampled points P on surface S and P′ on surface S′, we denote the mean distance Dm between two surfaces as the average of the sampled points to the other surface:
In our evaluation, we take the original 3D mesh as surface S, and the compressed mesh as S′. All the vertices of the original mesh and compressed mesh are used as the sampled points P and P′, respectively. So for each point sampled from the original mesh and compressed mesh, we search for its closest point on the other mesh and sum up the distances. The mean and RMSE (root-mean-squared error) are taken as the metric of geometric distance.
Besides geometric difference, we also propose another evaluation metric based on spatial query results. Take spatial join as an representative query, we perform join on both the compressed data and the raw data and compare query results with Jaccard coefficient:
where A and B are two spatial objects such as 3D cells, and Avol and Bvol are their volumes, respectively. To evaluate how the compressed mesh affect the final query results, we compare the Jaccard coefficient of spatial objects with the original mesh to the results on the compressed mesh with various LODs (Section 7.5). For the nearest neighbor queries, the portion of the object whose nearest neighbor is not correctly retrieved is used to evaluated the error rate of the queries with various LODs. As spatial data is generated from image analysis algorithms that themselves come with errors [65], and spatial queries involve massive number of 3D objects for statistical purposes, a certain level of precision loss can be acceptable in these cases.
4. SPATIAL PARTITIONING AND GLOBAL INDEXING
In practice, fast response is an essential requirement of spatial queries in various applications, such as exploratory studies on massive amounts of spatial data with a large set of parameters and algorithms and decision making in healthcare applications. Spatial partitioning and indexing are two fundamental techniques to support scalable and efficient spatial queries in most distributed database systems [48, 49].
4.1. Spatial Partitioning
To achieve scalability, we provide spatial partition-level parallelism that could be mapped into various parallel computing paradigms including MapReduce. We have performed extensive studies on spatial partitioning for 2D space [63]. Similarly, for 3D space, by partitioning the input data into partitioned cuboids, we can take the data contained in each cuboid as the processing unit to increase the level of parallelism henceforth improve overall throughput. After cuboids are generated, processing tasks on them do not need to depend on others for exchanging information [17], which significantly reduces idle CPU time. With a proper data partitioning mechanism, I/O cost can be notably decreased by only scanning partitions containing relevant data to the query. Various partitioning methods are available and can be selected based on data characteristics such as data skew and query types [63]. For digital pathology, the distributions of biological objects such as cells are relatively homogeneous compared to geo-spatial data. We take a fixed-grid-based partitioning approach that is most suitable for such distributions based on experiences.
4.2. Global Spatial Indexing
Global spatial indexing is based on partitions. The partitions can be used to form two levels of global spatial indexes: partitioned cuboid indexing based on the partitioned cuboids and subspace indexing based on aggregation of neighboring cuboids (Figure 6).
Partitioned cuboid indexing.
This index is to manage the containment relationships between each partitioned cuboid and its containing objects. A “cuboid_id” is generated for each cuboid at spatial partitioning phase based on its corresponding MBB. As objects in a partitioned cuboid forms the unit of parallelization tasks, “cuboid_id” can be used as a key to group 3D objects contained in this cuboid, which serves as effective task-level computational filtering.
Subspace indexing.
This index is built on subspaces, where a subspace is a higher level 3D box on top of partitioned cuboids. It is a coarse partitioning that groups multiple neighboring cuboids into a subspace, as shown in Figure 6. Thus, a subspace spatial index is created to maintain relationships between subspaces and the containing partitioned cuboids based on MBBs. Subspace indexing can be used to effectively support window-based queries by filtering irrelevant subspaces not involved in the query. It is essential to have another level of partition to organize the cuboids when the number of them is large.
In iSPEED, we use R*-tree for the two-level global spatial indexing [23]. As data is read-only with no further update, we optimize indexing process by bulk-loading techniques [24] and set the page utilization ratio as 100% to minimize the number of pages. Figure 6 shows a hierarchical view of the indexes in iSPEED. Besides the partitioned cuboid and subspace indexes, object-level spatial index is created for objects contained in each cuboid, and structural index is created for individual complex objects, which are discussed in Section 5. All these spatial indexes have limited sizes and are stored in memory either at pre-processing (partitioned cuboid and subspace indexes) or on-demand (object-level and structural indexes).
5. STANDALONE SPATIAL QUERY ENGINE
INTENSE is the standalone in-memory-based 3D spatial query engine for iSPEED and is generic to be extended and customized to support multiple spatial queries. It creates on-demand object-level indexing and structured indexing to accelerate spatial queries. INTENSE can be parallelized with decoupled spatial query processing on individual partitions to support multiple querying pipelines with optimal access methods and provides result normalization to handle boundary objects. In particular, INTENSE performs on-demand in-memory indexing for object-level indexing (many objects contained in a partitioned cuboid) and structured indexing (individual complex object such as a blood vessel).
5.1. Object-level Indexing
Object-level spatial indexing will index all objects in each partitioned cuboid to support index-based spatial queries. For example, joining objects from two cuboids can be supported through R-Tree-based indexing [26]. While traditional SDBMSs pre-create indexes, such indexes are fixed and take lots of space. Instead, we take an on-demand-based indexing approach by creating suitable indexes for the current query at runtime. This provides much flexibility and reduces storage with very small overhead. Our extensive profiling shows that, for data and computation intensive spatial queries such as spatial join, the overhead for index building on modern hardware is very small (Section 7.3).
5.2. Structured Indexing
For distance-based spatial queries such as nearest neighbor and spatial proximity estimation, traditional approaches always represent spatial objects with points for computation efficiency. This simplification is suitable for 3D objects with regular shape or simple structures, and approximate query results are needed. However, for complex structured objects such as blood vessels with bifurcations and branches, point simplification would result in intolerable erroneous query results with distance computation. In such queries, calculation of accurate distance needs to traverse every component of the 3D objects. As one 3D object may contain thousands of primitives such as vertices or facets, a naive brute-force traversal approach would be extremely expensive. In iSPEED, two novel structured indexing approaches are proposed to accelerate distance-based spatial queries: topological skeleton-based indexing and hierarchical Axis-Aligned Bounding Box (AABB) tree-based indexing, as shown in Figure 7. Those two structured indexing approaches can be utilized interchangeably for different scenarios.
Fig. 7.
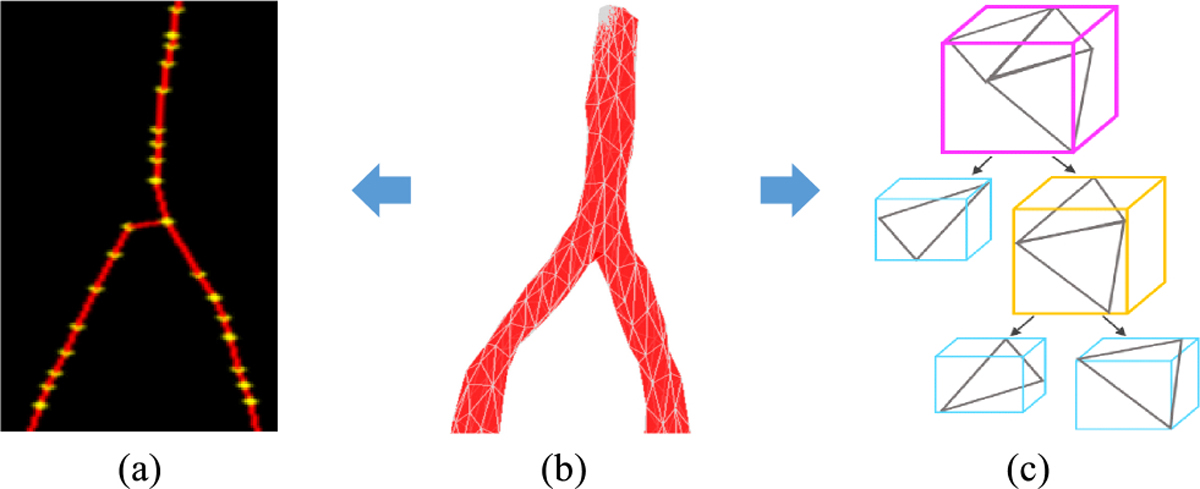
Structured index. (a) Vessel skeleton. The yellow dots are skeleton points. (b) A vessel structure. (c) Illustration of AABB tree on a subset of vessel facets. Tree is constructed via a bottom-up approach.
Skeleton-based indexing.
Skeletons are effective shape abstractions to capture the essential topology of complex structures. As shown in Figure 7, skeletons of bifurcated objects are extracted with Mean Curvature Skeleton (MCS) algorithm [57], and each bifurcated object can be roughly represented by its skeleton points. Figure 7(a) shows the extracted skeleton for the vessel structure in Figure 7(b), and the 3D yellow dots are skeleton points. The skeletons capture the inherent 3D structure topology and thus provide more meaningful query results in supporting approximating queries compared to single point simplification.
AABB-tree-based indexing.
Spatialproximity estimation requires accurate distance calculation between objects. For instance, to estimate the spatial proximity of blood vessels, precise distance between each cell and its nearest blood vessel needs to be computed. To minimize the search space of a complex structured object traversal, iSPEED builds a hierarchy on the AABBs of its primitives (facets), as shown in Figure 7(c). With AABB tree, an internal KD-tree can be optionally constructed to further accelerate the distance queries [61].
5.3. Boundary Objects
In iSPEED, partitioned cuboid is the basic parallelization unit for spatial queries. However, in cuboid-based partitioning, some spatial objects may lie on cuboid boundaries. We define such objects as boundary objects. In general, the fraction of boundary objects is inversely proportional to the size of the cuboid. As cuboid size gets smaller, the percentage of boundary objects increases. In iSPEED, two types of boundary objects are identified: the normal boundary objects in spatial join query (Figure 8) and the buffered boundary objects in distance-based query (Figure 9).
Fig. 8.

Illustration of boundary objects. The green nucleus O is a boundary object, and it is duplicated to cuboids C1 and C2 as O1 and O2.
Fig. 9.

Illustration of buffered boundary objects. The light blue area is the added buffer for the vessel V in cuboid C1. With the buffer, V is a boundary object and duplicated to cuboids C1 and C2 as V1 and V2.
Normal boundary objects.
The normal boundary object is some spatial object of which spatial extent crosses multiple cuboid boundaries, such as the nucleus O in Figure 8. In practice, the normal boundary objects may affect the query results in spatial join and need an appropriate approach to process it. In iSPEED, normal boundary objects are remedied by a “multiple assignment, single join” approach. To return a complete query result, iSPEED first duplicates the boundary objects and assigns them to multiple intersecting cuboids (Figure 8, right). Then each cuboid is processed independently during query execution and generates results with potential duplicates. Finally, iSPEED performs normalization on the query results by a filtering process to eliminate duplicate records.
Buffered boundary objects.
Buffered boundary object is defined as an object with complex structures and crossing the cuboid boundaries with a buffer, as the blood vessel V shown in Figure 9. Buffered boundary objects are generated in distance-based queries such as nearest neighbor search or proximity estimation where accurate distance is required for correct query results. As shown in Figure 9, the nearest blood vessel for nuclei p and q is V in cuboid C1, rather than vessel W even though they are in the same cuboid C2. If we perform cuboid-based query without considering V as a buffered boundary object, then the query result would be erroneous. So, for each complex structured object (blood vessels in our use case) in partitioned cuboids, we add a bounding box buffer to its MBB (the light blue area around vessel V in Figure 9) and then check if it crosses some cuboids’ boundaries. If it becomes a boundary object with the buffer (vessel V in Figure 9), then we take it as the normal boundary object and also take “multiple assignment” approach during query processing by duplicating vessel V to multiple cuboids (Figure 9, right). Then the same process of distance-based query processing follows as if there are no boundary objects. Note that normalization step is not necessary for buffered boundary objects remedy, as there is no duplicate in the query results given each nucleus is uniquely identified as a 3D point within cuboids in distance-based queries. The buffer size can be set as the maximum allowable distance of two nearest neighbors.
6. 3D SPATIAL QUERY PROCESSING
iSPEED provides INTENSE as the core engine to support multiple types of spatial queries, including spatial join, nearest neighbor search, and spatial proximity estimation, and can be easily extended to others such as containment query. INTENSE fully takes advantage of multi-level spatial indexes, including subspace indexing (pre-generated), partitioned cuboid indexing, object-level indexing, and structural indexing (on demand created). Furthermore, INTENSE handles normal and buffered boundary objects across partitions gracefully through multiple assignment approach to generate accurate query results. INTENSE decompresses original 3D objects only when necessary and is highly memory-efficient. iSPEED provides query task parallelization based on MapReduce and can be adapted to other distributed computing paradigms.
6.1. Data Pre-processing
iSPEED provides a one-time data pre-processing step for data compression, spatial partitioning, and global indexes creation. Data compression is performed in parallel in iSPEED. The original data is read from distributed file system such as HDFS, compressed, and stored back to the distributed file system. The compressed data is then processed with the MapReduce paradigm. The compression can be implemented as a Map-only job in MapReduce for efficiency, where each original 3D geometry object is a record for processing. The data compression process is able to progressively generate successive levels of detail for each 3D object. Thus, during spatial query processing, iSPEED is able to dynamically decompress the 3D data at specified level of detail for geometry computation extraction. However, as the spatial compression significantly reduces the data size, a large amount of disk I/O and network cost is saved.
During compression, the MBB of each object is extracted and stored together with the compressed data for query processing. Furthermore, iSPEED performs spatial partitioning based on those MBBs to generate a set of partitioned cuboids, which become the processing unit for cuboid-based query tasks. Each partitioned cuboid is assigned with a unique “cuboid_id,” and the partitioned cuboid index is created on the cuboid MBBs. Global subspace indexing is also created by grouping partitioned cuboids into large subspace to support windows-based query. Next, we discuss how queries are conducted with those indexes and the compressed data.
6.2. 3D Spatial Join
Spatial join is one of the most commonly used spatial queries, and several spatial join algorithms have been proposed in the past for various applications [26, 35, 73]. For digital pathology use case, spatial queries could be used to find relationships of different types of biological objects such as containment relationship. One particular query type is spatial cross-matching, to compare or consolidate results of segmented and reconstructed 3D objects from different algorithms. The query will identify all intersecting polyhedron pairs between two 3D result sets from an image volume by two different algorithms, extract intersecting volumes, and compute their overlap ratios (intersection-to-union ratios) [66].
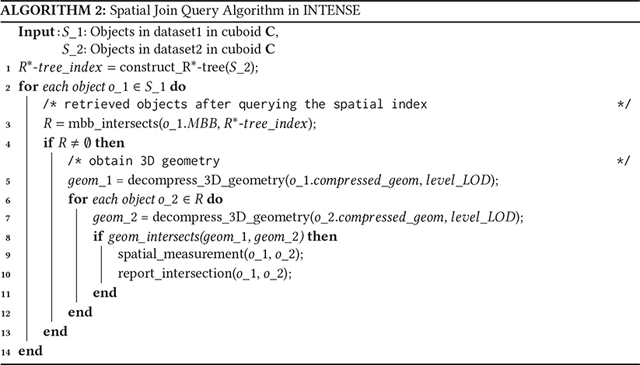
We illustrate the general workflow of two-way spatial join in Figure 10. Here, we take a filter-and-refine strategy to reduce the computational cost of spatial predicate on 3D geometries. After identifying the objects with the same “cuboid_id” from two datasets in the Map phase, in the Reduce phase, iSPEED builds a spatial index in bulk on one dataset (here, dataset2) in that cuboid to generate an object-level index like 3D R*-tree [20]. Hilbert R-tree can also be used when the objects are in regular shapes and homogeneously distributed [36]. The R*-tree index is built on object MBBs and is small in size to be stored in memory. To perform spatial join query, for each 3D object in dataset1, we first query its MBB on the R*-tree as a rough filtering step to eliminate objects pairs with no MBB intersection. For those candidates with MBB intersection, we perform geometry decompression at specified level of detail to obtain polyhedrons. Then, we perform spatial refinement step on the polyhedron pairs through 3D geometric operations. Much like predicate pushdown in traditional database query optimization, spatial measurement step is also performed on intersected polyhedron pairs to calculate quantitative spatial results required such as intersection volumes and overlap ratios. Other spatial operators such as overlaps, contains, and touches, among others, can also be processed similarly. The detailed algorithm is shown in Algorithm 2.
Fig. 10.

An example of a two-way 3D spatial join workflow in INTENSE.
Memory usage is efficient in spatial join queries. As the workflow shows, the filtering step works on object MBBs, and only the refinement step needs to decompress the actual geometry, which takes a significantly larger amount of memory space. For a single task running on a single CPU core, the refinement step is executed sequentially, and one pair of geometries is decompressed at a time. Even with multiple parallel tasks on a single node, iSPEED keeps a small memory footprint during query processing. Our experiments indicate for spatial join query on the dataset with 460 GB size, the memory usage is about 14 GB on each node in a typical cluster environment.
6.3. 3D Nearest Neighbor Query
Nearest Neighbor (NN) spatial query has broad applications in various domains [25, 32, 60]. In 3D analytical pathology imaging, pathologists are interested in spatial queries such as “for each 3D cell, return its nearest 3D blood vessel and the distance.” These queries are essential for researchers and clinicians to better understand the correlations between spatial patterns and cell characteristics and can be answered by NN search algorithm. iSPEED supports two types of object-level structural indexing to facilitate Nearest Neighbor queries over complex 3D objects such as nuclei and blood vessels.
6.3.1. 3D Nearest Neighbor Query with Skeleton-based Method.
Traditional spatial database systems may have different NN query approaches, but most of them only deal with point data. Such method significantly simplifies the problems of managing and querying spatial data with complex structures and is only applicable for certain queries where approximate results are allowed. However, this type of approach is not suitable for NN query in use cases such as 3D pathology, where we are interested in 3D objects with complex structures such as 3D blood vessels. In practice, 3D blood vessels with bifurcations and branches are reconstructed to better characterize their spatial properties. Thus, a simple point approximation of the 3D blood vessel structure would result in critical loss of 3D spatial and structural information and may produce results to such NN search with unacceptable error rate. To decrease the error rate, we use skeleton-based structural indexing to approximate each object with complex structure (see Figure 7(a)).
To support efficient spatial NN query, a large suit of algorithms for spatial access methods have been developed [21, 54, 67]. Specifically, Voronoi diagram has been studied for nearest neighbor queries in various research domains. Given a set of input sites, typically 3D points in space for 3D case, Voronoi diagram partitions the space into disjoint polyhedrons based on distance to the query sites. Each given site has a corresponding polyhedron consisting of all 3D points closer to that site than to any other. Assume is a set of given n sites. Its 3D Voronoi diagram is represented as consisting of n polyhedron cells Vi formulated as follows:
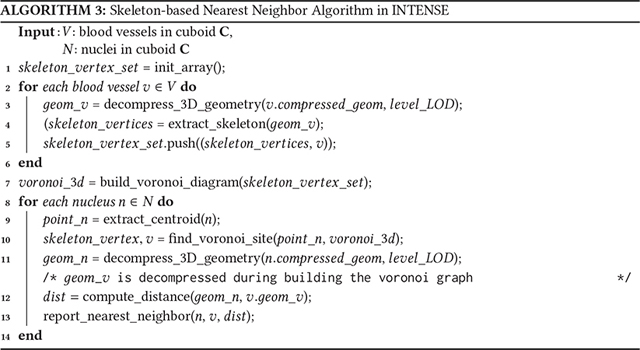
We present the workflow of Voronoi-based 3D NN query in Figure 11. For each 3D blood vessel within the partitioned cuboid C, we decompress its geometry into memory from compressed data for skeleton extraction. Each vessel is then represented with its skeleton points, which approximate the actual vessel structure. The skeleton points are extracted with the Mean Curvature Skeletons method (MCS) [57]. We then take the skeleton points as the input sites to construct the Voronoi diagram. With the 3D Voronoi diagram, we perform NN search for every nucleus within the same partitioned cuboid. Here, we simplify each 3D nucleus as a 3D point, as it is small in size and regular in shape compared to a vessel structure [43]. The NN query results return the nearest blood vessel for each nucleus as well as the distance (Algorithm 3).
Fig. 11.

Workflow of 3D nearest neighbor search with skeleton-based approach.
Note that as the MCS skeleton extraction algorithm used in NN query mainly relies on the shape and topology of 3D objects rather than the mesh details, it is not necessary to specify the highest LOD during geometry compression. Thus, we set the LOD as 60% in our implementation to improve the efficiency of geometry decompression and skeleton extraction for NN query acceleration. As skeleton extraction only needs geometry with lower LOD and one Voronoi diagram is constructed for one partitioned cuboid, the usage of memory in NN query is small and the building of skeleton-based structural indexing is fast.
6.3.2. 3D Nearest Neighbor Query with AABB-tree-based Method.
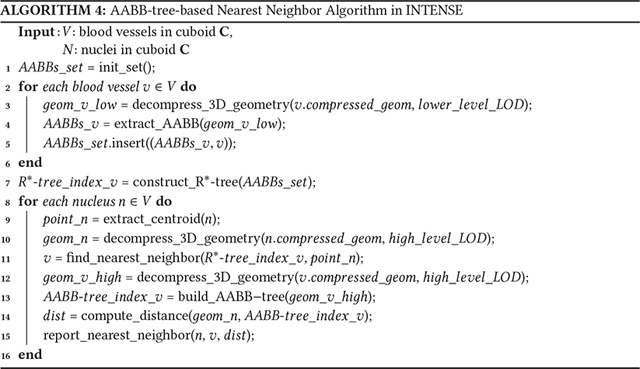
The workflow of 3D nearest neighbor query with AABB-tree-based method is shown in Figure 12. After the nuclei and vessels within one partitioned cuboid are identified, the first step is to decompress the geometry of vessels in low LOD and compute Axis-Aligned Bounding Box (AABB) on the mesh facets of vessels. Next, R*-tree is built on the extracted AABBs of vessels in the cuboid. For each nucleus, its nearest neighbor (AABB) is found by R*-tree traversal, and the vessel with the closest AABB is taken as its nearest blood vessel. Last, the identified nearest vessel is decompressed to high LOD, and a structural AABB-tree index is built on the decompressed geometry for accurate distances computation. As the first step involves AABB-tree-based structural indexing for all vessels with very small sizes (low LOD), and the last step involves only nearest vessel objects with high resolution. Thus, the use of memory is efficient and the amount of geometric computation is reduced. The detailed steps are shown in Algorithm 4. Note that different from the skeleton-based method, which supports only NN query, kNN query can be supported by AABB-tree-based method when multiple candidates are retrieved with the inter-object level index and low LOD representations.
Fig. 12.

Workflow of 3D nearest neighbor search with AABB-tree-based approach.
6.4. Query Task Parallelization
iSPEED provides parallel querying pipelines for the discussed query workflows for efficiency and scalability. With partitioned cuboids, iSPEED can run multiple query tasks through distributed computing paradigms such as Hadoop or Spark on commodity clusters.
As shown in Figure 13, the partitioned cuboid-based query processing is parallelized via MapReduce programming model with three main steps: (i) Map phase. In the Map phase, each Map task scans a chunk of data and performs R*-tree search on the partitioned cuboid index and emits each record, with the MBB and the compressed data, as output value and its cuboid_id as the key; (ii) Shuffle phase. All records with the same cuboid_id are sorted and prepared for reducer operations. Spatial objects from different datasets that belong to the same cuboid end up in the same partition to be processed by the same reducer; (iii) Reduce phase. Each reducer performs the cuboid-based spatial queries by executing the corresponding query workflow. If boundary objects need to be corrected for spatial join query, then an additional result normalization job will be invoked for duplicates removal.
Fig. 13.
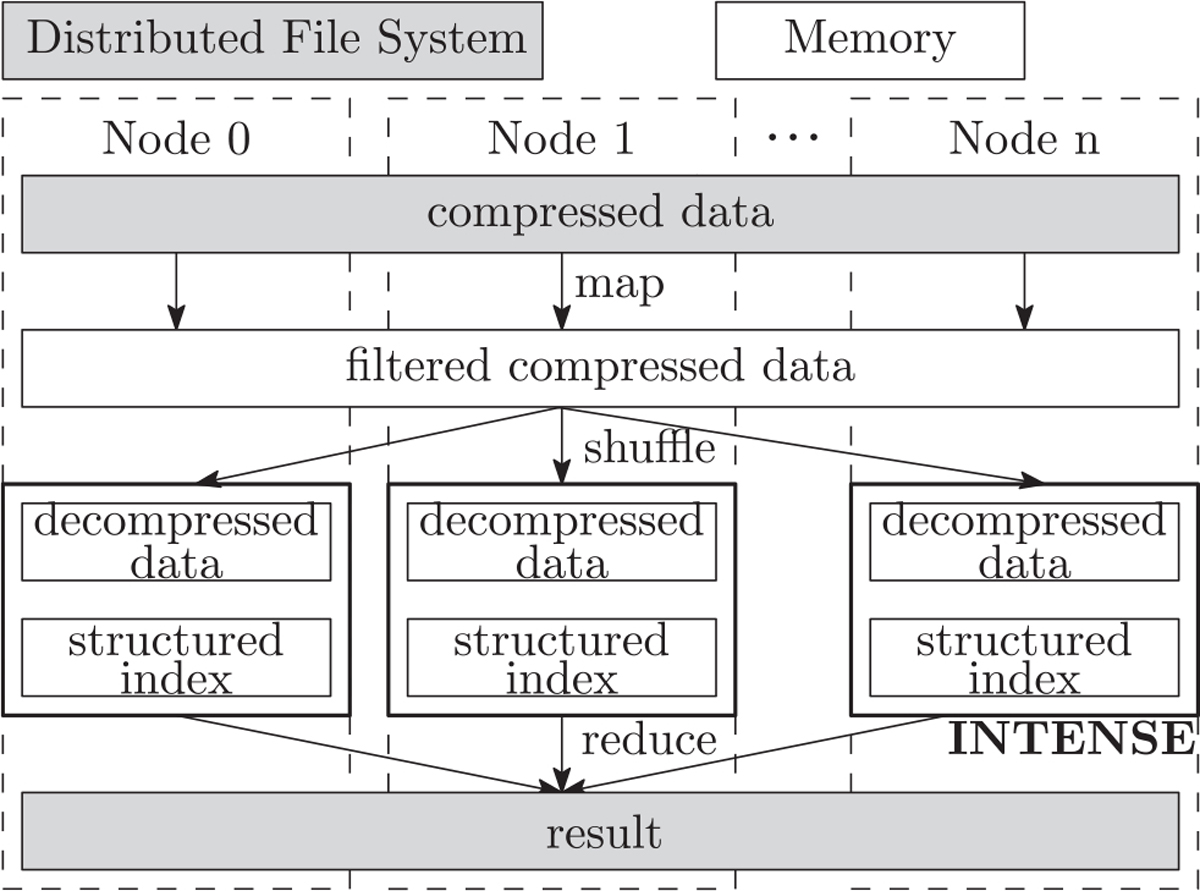
The distributed data processing with INTENSE engine in iSPEED.
7. EXPERIMENTAL EVALUATION
7.1. Experiment Setup
Three datasets from analytical pathology imaging are used for system performance evaluation. The 3D objects including nuclei (cells) and blood vessels are derived from 3D image volumes with different number of slides and have been validated and represented in OFF format [11]. We have dataset sizes at 1×, 3×, and 5×, as shown in Table 1.
Table 1.
3D Dataset for Performance Study
| Dataset | 1× | 3× | 5× |
|---|---|---|---|
|
| |||
| Number of slides | 56 | 168 | 280 |
| Number of 3D nuclei | 1.4 × 10⁶ | 4.1 × 10⁶ | 6.8 × 10⁶ |
| Number of 3D vessels | 5,200 | 14,100 | 22,320 |
| Dataset size | 90 GB | 272 GB | 460 GB |
The performance of iSPEED is tested on a cluster environment. The cluster has five nodes with 124 cores (Intel(R) Xeon(R) CPU E5–2650 v3 at 2.30 GHz). Each node comes with 5 TB hard drive at 7,200 rmp and 128 GB memory. Cluster nodes are connected via a 1 Gb network and the OS for each node is CentOS 6.7 (64 bit). We use Apache Hadoop 2.7.1 as MapReduce platform for distributed parallel computing and adopt Boost 1.57.0 and CGAL 4.8 [4] libraries for 3D structural indexing, geometric computation, and spatial measurement. We also extend the SpatialIndex library 1.8.1 [16] for 3D R*-tree index creation. The original 3D datasets are uploaded in HDFS, and the replication factor is set as 3 for each datanode. We compare the performance of iSPEED with a state-of-the-art distributed 3D spatial data processing platform Hadoop-GIS 3D [38]. Hadoop-GIS 3D inherits the processing framework of Hadoop-GIS [17] with an extending support for 3D spatial data.
7.2. Effect of Data Compression
To evaluate the loss of 3D data compression, we use Hausdorff distance to quantitatively compute the geometric difference between the original and the compressed 3D meshes. For the 3D objects in the three datasets, we randomly choose one partitioned cuboid with about 2,500 nuclei and 200 vessels for validation with Hausdorff distance metric. As shown in Table 2, compared with the size of the objects that could be hundreds in each dimension, the Hausdorff distances for vessels and cells are small enough to be negligible in practice [65].
Table 2.
Evaluation Results with Hausdorff Distance Metric
| 3D Object | dataset | Hausdorff distance |
|---|---|---|
|
| ||
| 3D Vessel | 1× | 0.079 ± 0.91% |
| 3× | 0.085 ± 0.88% | |
| 5× | 0.091 ± 0.83% | |
|
| ||
| 3D Cell | 1× | 0.152 ± 0.52% |
| 3× | 0.131 ± 0.61% | |
| 5× | 0.157 ± 0.57% | |
To evaluate the effect of data compression on spatial queries, we take spatial join as an representative benchmark query and use Jaccard coefficient as the validation metric. We randomly choose one partitioned cuboid from each of the three nuclei test datasets (about 2,500 nuclei) and compute the Jaccard coefficient of spatial joins on the original mesh (Jo) and the compressed mesh Jc. The mean and standard deviation of their difference (|Jo − Jc |) are 0.035 ± 0.43%, 0.057 ± 0.27%, and 0.047 ± 0.33% for 1×, 3×, and 5× datasets, respectively. The results of Jaccard coefficient also reveal a minor loss of the compressed data in spatial queries.
7.3. Performance of Standalone INTENSE Engine on a Single Node
To evaluate the spatial query engine INTENSE, we take spatial join as a representative benchmark query to test its standalone performance and validate the effect of structural indexing by nearest neighbor search and spatial proximity estimation. For the performance test, we run INTENSE on a cluster node as a single thread application. The test data is from two 3D result sets (2,476 vs. 2,503 nuclei) within one partitioned cuboid, with 202 blood vessels in the same cuboid. Figure 14 presents the query execution time versus multiple LODs of the dataset.
Fig. 14.
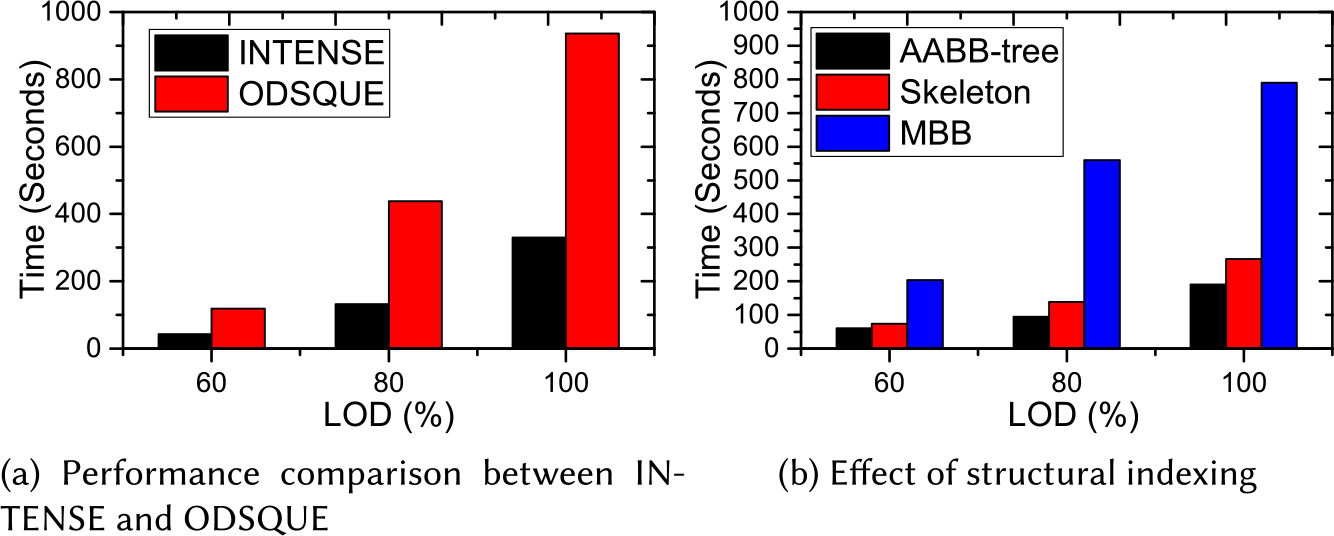
Performance of INTENSE engine.
Standalone Performance.
We run INTENSE in a single thread on the test dataset and compare its execution time with that of ODSQUE, the standalone query engine of Hadoop-GIS 3D. Figure 14(a) shows the spatial join performance comparison for the two engines. INTENSE performs significantly better than ODSQUE at all LODs. Specifically, for the original data with 100% LOD, INTENSE takes 5 minutes 30 seconds, while ODSQUE uses 15 minutes 32 seconds, about three times slower.
When profiling INTENSE for the data and computation intensive spatial join for cross-matching, we observe that the cost of reading and parsing MBB data from memory is 0.61%, R*-tree construction cost is 0.02%, MBB filtering cost is 0.33%, on-demand data decompression is 2.03%, and spatial refinement and measurement cost is 97.01%. With fast development of CPU speed, spatial index construction takes very little time during the query process, which motivates us to develop the index-on-demand approach to support spatial queries. We can also see that 3D geometric computation dominates the cost, which can be accelerated through parallel computation on a cluster.
Effect of Structural Indexing.
As shown in Figure 14(b), structural indexing significantly boosts distance-based spatial queries for complex structures. We test the effect of structural indexing by running skeleton and AABB-tree-based nearest neighbor search on the test dataset with 3D blood vessels. An MBB-based indexing without any structural indexing is used for comparison. As the MBB approach computes the distance between nuclei and vessels by checking all the face pairs in a brute-force nested loop manner, it takes much longer time across all LODs compared to the two structural indexing approaches. For the dataset with 60% LOD, the time for AABB-tree indexing and skeleton indexing is less than 100 seconds, while MBB indexing takes about 200 seconds. For the datasets with 80% and 100% LOD, the two structural indexings are about 4 to 5 times faster than the traditional MBB indexing. Note that AABB-tree indexing performs slightly better than skeleton-based indexing on all LODs, as in our experiment the cost of tree creation and traversal is less than that of skeleton extraction and Voronoi diagram construction for complex objects. However, as the skeleton points extracted from representations of the same objects in different LODs are more or less the same, it is unnecessary to perform queries with high LODs when skeleton-based approach is taken.
7.4. Performance of iSPEED versus Hadoop-GIS 3D
For the purpose of comparison, we run three spatial queries on both iSPEED and Hadoop-GIS 3D on the dataset at the 3× 3D image volume with 168 slides. Spatial proximity estimation query is based on nearest neighbor search and demands accurate distance computation for global spatial pattern discovery. We facilitate the proximity estimation queries with AABB-tree-based structural indexing. The pipeline is applied to all types of target objects within the same partitioned cuboid for nearest distances computation. Then an aggregation step to collect the sums of nearest distances is performed over the whole 3D volume, and the mean and standard deviation of the distance sums are computed for spatial proximity estimation.
For fairness, both Hadoop-GIS 3D and iSPEED are tested against the data with the same level of details (LODs). As shown in Figure 15, the results illustrate the query execution time versus the number of parallel processing units (PPUs). With the MapReduce implementation, the number of PPU corresponds to the number of mapper and reducer tasks in our system. Both systems exhibit good scalability for the three types of spatial queries. iSPEED outperforms Hadoop-GIS 3D significantly with a speedup of from 2.31 to 3.02 for spatial join query across different number of PPUs. As iSPEED compresses the spatial data with spatial compression method, it significantly reduces data scanning from HDFS and minimizes data shuffling between cluster nodes. Even 3D objects are stored in a compressed form in iSPEED; with multi-level spatial index-based filtering and on-demand decompression, the extra cost for compression is small and the overall gained efficiency is significant. Further, the do-demand individual object-level structural indexing also contributes to the efficiency of iSPEED.
Fig. 15.
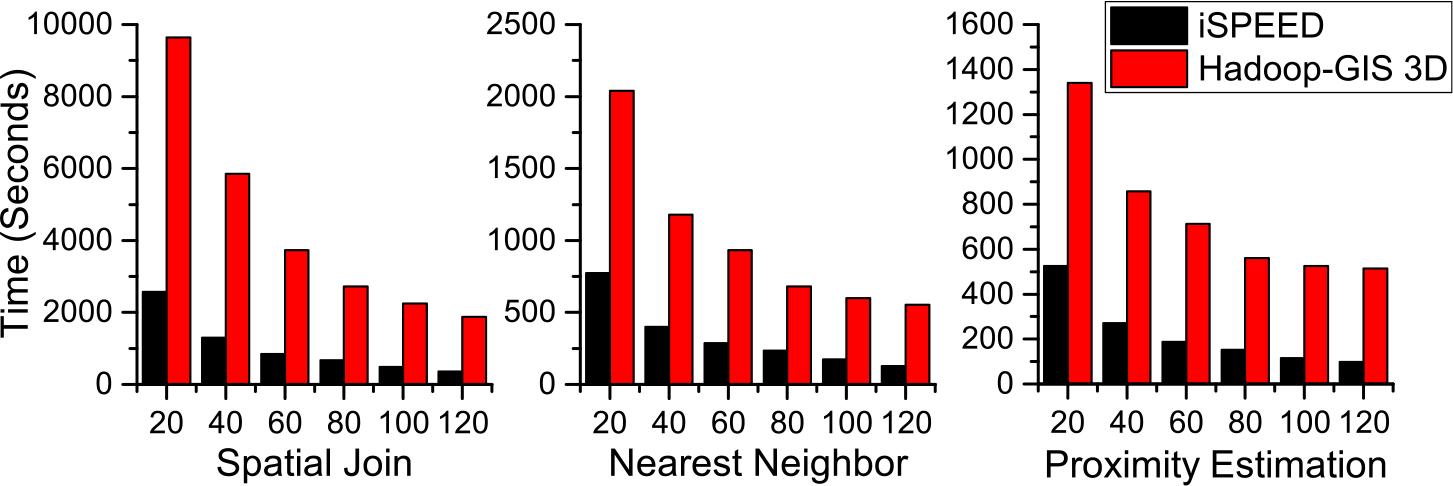
iSPEED vs. Hadoop-GIS 3D in spatial join, nearest neighbor search, and proximity estimation as the number of parallel processing units (PPUs) increases.
7.5. Query Performance versus Level of Detail
As 3D objects are represented with multiple levels of detail in iSPEED, we test the effect of different LOD representations on spatial query performance. We take the spatial join as a representative benchmark query and evaluate the execution time and error rate for quantitative spatial measurement of intersection volumes, as shown in Figure 16. We run spatial join on one small partitioned cuboid containing 871 objects with seven levels of detail ranging from 40% to 100%. In the test of join query processing, for each pair of objects, we first perform MBB filtering. Then, for the candidate pairs with MBB intersection, we decompress their geometries with specified LOD, perform geometry intersection testing, and compute the intersection volume individually for each pair.
Fig. 16.
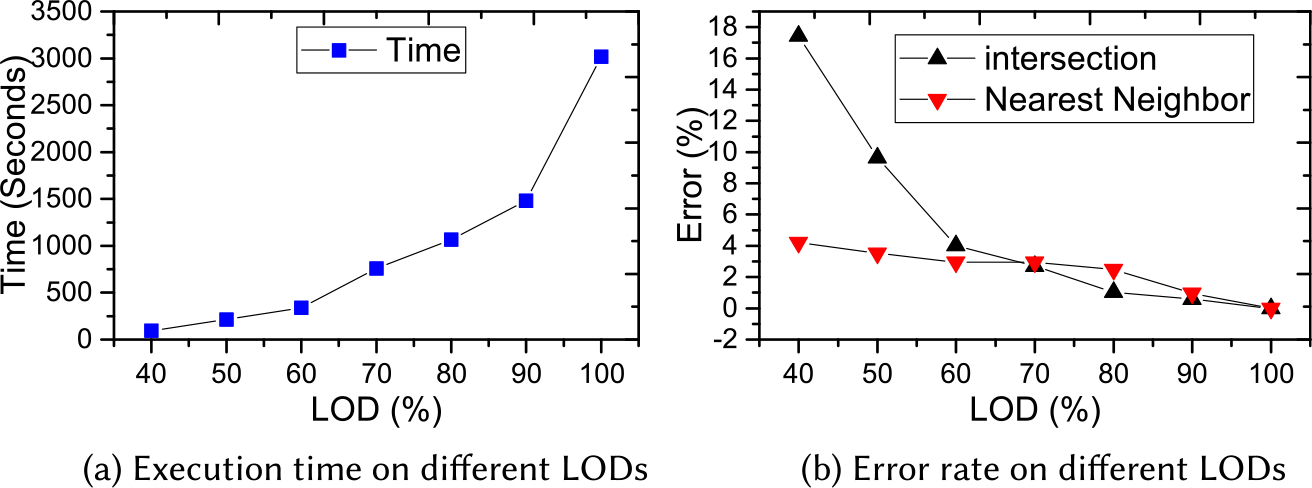
Varying level of details.
As Figure 16(a) shows, the execution time increases dramatically with increasing LODs. For LOD with 50%, it only takes 213 seconds. However, it increases to 3,026 seconds for 100% LOD—14 times increase in time. The reason of such significant increase of execution time is that objects with larger LOD have more complex geometries, and 3D geometry computation dominates the cost of spatial join query.
The geometry simplification of objects will lead to precision loss in the query results. We present the error rates of resulted intersection volume across different LODs in Figure 16(b). Compared to the 100% LOD, the error rate for 50% LOD is 9.64%. For LOD with 70%, the error rate is only 2.72% with query time of 750 seconds, a quarter of the time from 100% LOD. Error rate for 90% LOD is 0.54%, but the query runs twice faster (1,484 seconds) than 100% LOD. For the nearest neighbor query, less than 4% of the queries return the false result even for the test with the lowest LOD. Thus, there will be a tradeoff between query time and error rate for queries on objects with different LODs. In iSPEED, users can specify the LOD for spatial queries to balance query efficiency and result precision based on the application requirement.
7.6. Scalability of iSPEED
We demonstrate the scalability of the system with the discussed three types of spatial queries in Figure 17. Datasets used include 1×, 3×, and 5× datasets on 100% LOD geometry, with varying number of PPUs. We can see a continuous decline of query time by increasing the number of reducers. It achieves a nearly linear speedup in spatial join query, e.g., the time is reduced by half when the number of reducers is increased from 10 to 20. The system also has a nice scale-up. For example, with 40 processing units, the time for spatial join query on the 5× dataset is about five times of that for spatial join query on the 1× dataset.
Fig. 17.
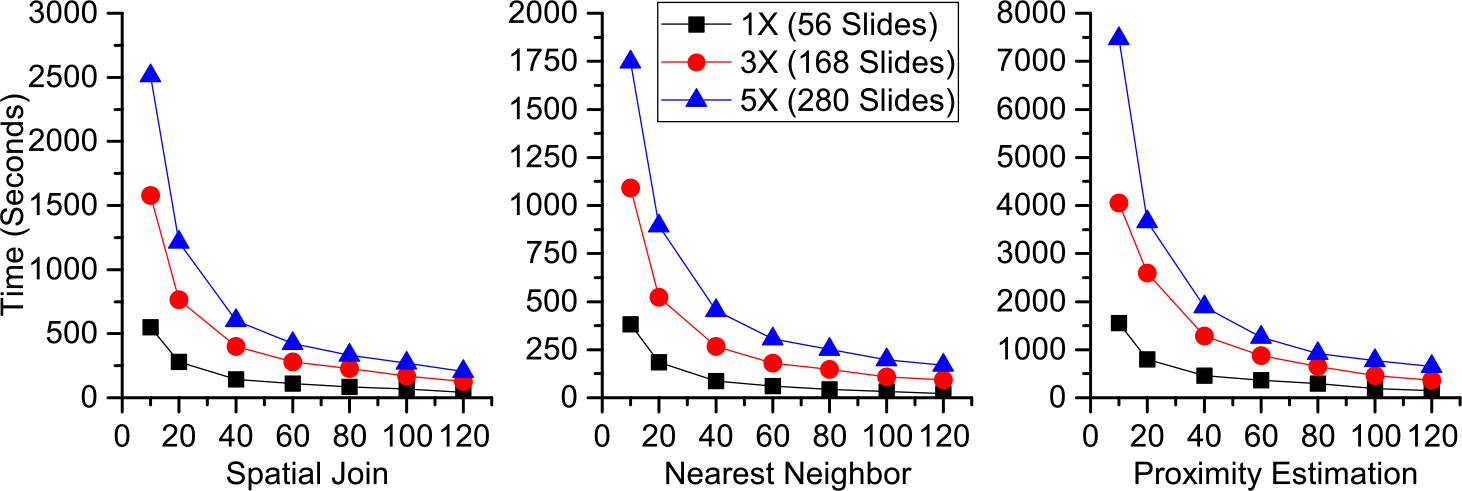
Scalability of iSPEED on spatial join, nearest neighbor search, and proximity estimation.
8. RELATED WORK
3D spatial data management: Spatial Database Management Systems (SDBMSs) have been developed for managing and querying 3D spatial data in industrial applications, such as OracleSpatial, MapInfo Discover 3D from pitneybowes [13], and ESRI 3D GIS [6]. Most of the commercial SDBMSs are developed based on enterprise-class RDBMS and aim to perform spatial analysis in various domains of 3D mapping, 3D city modelling and urban planning, and 3D geoscience data analysis. However, They mainly support simple 3D spatial objects such as landmarks and buildings with 3D geometry types of point, line, polygon, and solid, without efficient supporting of 3D objects with complex structures [47]. Data loading is also a major bottleneck for SDBMS-based solution, especially for large-scale datasets. Moreover, traditional spatial indexing and querying methods have limited support to analytical spatial queries on 3D complex structured objects. Besides polyhedron-based representations, a 3D object can also be represented by cloud points that are widely used in HD map [8] and automatic driving [72]. Reference [53] uses GPU to improve the 3D spatial data processing efficiency. An OCTree-based in-memory 3D cloud points index is proposed in Reference [33]. Cloud points base representations has its advantages in representing 3D objects in certain scenarios but is out of the scope of this article.
3D spatial data compression:
Spatial data compression is well studied in the research fields of computational geometry, multimedia, and computer science. In progressive compression [34], lower resolution spatial objects can be obtained by collapsing faces, edges, and vertex pairs or removing vertices [37, 44]. Researches are conducted to achieve better compression which has higher compression rate and lower distortion rate. PPMC takes a lifting schema to improve the distortion rate [45]. A feature-oriented generic progressive lossless mesh coder is proposed in Reference [50] to achieve a better presentation of geometric features. An OCTree-based method is proposed in Reference [52] to improve the efficiency of encoding meshes with arbitrary topological structures. Another Incremental Parametric Refinement-based approach is proposed to improve the quality of compression with a novel refinement scheme [62]. Besides those progressive compression methods, wavelet is another multiple resolution representation of 3D object [56]. The details of an object come in batches to achieve progressive rendering and querying. A motion-aware approach is proposed to dynamically retrieve objects in proper resolutions considering the movement of the observing object [18, 19]. Both the progressive compression and wavelets-based multiple resolution 3D objects representation is compatible with iSPEED, as spatial compression is facilitated to reduce network bandwidth cost and achieve multi-precision spatial queries.
Distributed spatial data processing:
Recently, several systems have been proposed to support large-scale spatial queries with distributed computing resources over a cluster of commodity machines [17, 22, 31, 69–71]. They mainly focus on 2D spatial data queries and analysis and lack critical components for 3D support, such as modeling, compression, indexing (in particular, for complex 3D objects) and 3D geometry computations. Hadoop and Spark are widely used for scalable and cost-effective big data analysis [17, 59, 71]. Hadoop relies on MapReduce programming model for distributed processing of large datasets stored in HDFS, and Spark is an in-memory computing framework that caches data in memory for iterative processing. Spark does not provide 3D geometry compression to reduce data to fit into memory, and it will suffer from major shuffling cost from I/O for massive datasets [30]. Spark also lacks 3D spatial indexing and query methods. iSPEED is implemented with its own data compression and in-memory data and index structures. It uses Hadoop for parallelization and job scheduling but has very low I/O or shuffling cost due to the in-memory storage across all the nodes.
9. CONCLUSION
Massive 3D data with complex structures generated from biomedical applications provides a significant research challenge on spatial data management. In this article, we present iSPEED, an efficient and scalable system to support high-performance 3D spatial queries on large-scale complex structured datasets and demonstrate its efficiency and scalability on supporting multiple spatial query types. iSPEED achieves the goals through data compression, multi-level in-memory spatial indexing, parallel query processing, and graceful boundary and buffered objects handling. Our experiments on the 3D pathology imaging use case demonstrate that iSPEED provides an effective and scalable solution for spatial queries over large-scale 3D complex structured datasets, with low memory footprint. Our system is generic and provides a novel framework for building highly effective 3D querying systems.
Acknowledgments
This research is supported in part by grants from National Science Foundation ACI 1443054 and IIS 1350885, and National Institute of Health K25CA181503 and U01CA242936.
Contributor Information
DEJUN TENG, Stony Brook University, USA.
YANHUI LIANG, Waymo LLC, USA.
HOANG VO, Stony Brook University, USA.
JUN KONG, Georgia State University, USA.
FUSHENG WANG, Stony Brook University, USA.
REFERENCES
- [1].Wikipedia. 3D Modelling. Retrieved from https://en.wikipedia.org/wiki/3D_modeling.
- [2].CARMERA. Retrieved from https://www.carmera.com/.
- [3].Civil Maps. Retrieved from https://civilmaps.com/.
- [4].The Computational Geometry Algorithms Library (CGAL). Retrieved from http://www.cgal.org/.
- [5].Nvidia. Deepmap. Retrieved from https://www.deepmap.ai/.
- [6].ESRI. ESRI 3D GIS. Retrieved from http://www.esri.com/products/arcgis-capabilities/3d-gis.
- [7].U. S. Food and Drug. FDAWSI. Retrieved from https://www.fda.gov/newsevents/newsroom/ucm552742.htm. [Google Scholar]
- [8].Nanalyze. HD Map. Retrieved from https://www.nanalyze.com/2018/11/hd-mapping-autonomous-vehicles. [Google Scholar]
- [9].Mapbox.ai. Retrieved from https://www.mapbox.com/.
- [10].Mapper. Retrieved from https://mapper.ai/.
- [11].Wikipedia. OFF Format Retrieved from https://en.wikipedia.org/wiki/OFF_(file_format).
- [12].OpenTopography. Retrieved from http://www.opentopography.org/.
- [13].Pitney Bowes Inc. pbEncom. Retrieved from http://www.pitneybowes.com/pbencom/homepage.html.
- [14].The Human Protein Atlas project. Proteinatlas. Retrieved from https://www.proteinatlas.org/.
- [15].National Library of Medicine. Spatial Epigenome. Retrieved from https://www.ncbi.nlm.nih.gov/pubmed/31127980.
- [16].Hadjieleftheriou Marios. Spatial Index Library. Retrieved from http://libspatialindex.github.com. [Google Scholar]
- [17].Aji Ablimit, Wang Fusheng, Vo Hoang, Lee Rubao, Liu Qiaoling, Zhang Xiaodong, and Saltz Joel. 2013. Hadoop GIS: A high performance spatial data warehousing system over MapReduce. Proc. VLDB Endow. 6, 11 (2013), 1009–1020. [PMC free article] [PubMed] [Google Scholar]
- [18].Mohammed Eunus Ali Egemen Tanin, Zhang Rui, and Kulik Lars. 2010. A motion-aware approach for efficient evaluation of continuous queries on 3D object databases. VLDB J. 19, 5 (2010), 603–632. [Google Scholar]
- [19].Mohammed Eunus Ali Rui Zhang, Tanin Egemen, and Kulik Lars. 2008. A motion-aware approach to continuous retrieval of 3D objects. In IEEE 24th International Conference on Data Engineering. IEEE, 843–852. [Google Scholar]
- [20].Arge Lars, Procopiuc Octavian, Ramaswamy Sridhar, Suel Torsten, Vahrenhold Jan, and Vitter Jeffrey Scott. 2000. A unified approach for indexed and non-indexed spatial joins. In International Conference on Extending Database Technology. Springer, 413–429. [Google Scholar]
- [21].Aurenhammer Franz, Klein Rolf, Lee Der-Tsai, and Klein Rolf. 2013. Voronoi Diagrams and Delaunay Triangulations, Vol. 8. World Scientific. [Google Scholar]
- [22].Baig Furqan, Vo Hoang, Kurc Tahsin, Saltz Joel, and Wang Fusheng. 2017. SparkGIS: Resource aware efficient in-memory spatial query processing. In 25th ACM SIGSPATIAL International Conference on Advances in Geographic Information Systems. 1–10. [PMC free article] [PubMed] [Google Scholar]
- [23].Beckmann Norbert, Kriegel Hans-Peter, Schneider Ralf, and Seeger Bernhard. 1990. The R*-tree: An efficient and robust access method for points and rectangles. In SIGMOD. 322–331. [Google Scholar]
- [24].Bercken J and Seeger Bernhard. 2001. An evaluation of generic bulk loading techniques. In Proc. of VLDB. 461–470. [Google Scholar]
- [25].Beyer Kevin, Goldstein Jonathan, Ramakrishnan Raghu, and Shaft Uri. 1999. When is “nearest neighbor” meaningful? In Database Theory - ICDT 99. Springer, 217–235. [Google Scholar]
- [26].Brinkhoff Thomas, Kriegel Hans-Peter, and Seeger Bernhard. 1996. Parallel processing of spatial joins using R-trees. In 12th International Conference on Data Engineering. IEEE, 258–265. [Google Scholar]
- [27].Charles Nikki A., Holland Eric C., Gilbertson Richard, Glass Rainer, and Kettenmann Helmut. 2012. The brain tumor microenvironment. Glia 60, 3 (2012), 502–514. DOI: 10.1002/glia.21264 [DOI] [PubMed] [Google Scholar]
- [28].Cignoni Paolo, Rocchini Claudio, and Scopigno Roberto. 1998. Metro: Measuring error on simplified surfaces. In Computer Graphics Forum, Vol. 17. Wiley Online Library, 167–174. [Google Scholar]
- [29].Consortium HuBMAP et al. 2019. The human body at cellular resolution: The NIH human BioMolecular Atlas Program. Nature 574, 7777 (2019), 187. [DOI] [PMC free article] [PubMed] [Google Scholar]
- [30].Davidson A and Or A. 2013. Optimizing Shuffle Performance in Spark. Technique Report. UC Berkeley. [Google Scholar]
- [31].Eldawy Ahmed and Mokbel Mohamed F.. 2015. SpatialHadoop: A MapReduce framework for spatial data. In IEEE 31st International Conference on Data Engineering. IEEE, 1352–1363. [Google Scholar]
- [32].Ester Martin, Kriegel Hans-Peter, Sander Jörg, and Xu Xiaowei. 1996. A density-based algorithm for discovering clusters in large spatial databases with noise. In 2nd International Conference on Knowledge Discovery and Data Mining. 226–231. [Google Scholar]
- [33].Han Soohee. 2013. Design of memory-efficient octree to query large 3D point cloud. J. Kor. Societ. Survey., Geodes., Photogram. Cartog 31, 1 (2013), 41–48. [Google Scholar]
- [34].Hoppe Hugues. 1996. Progressive meshes. In 23rd Annual Conference on Computer Graphics and Interactive Techniques. ACM, 99–108. [Google Scholar]
- [35].Jacox Edwin H. and Samet Hanan. 2007. Spatial join techniques. ACM Trans. Datab. Syst. 32, 1 (2007), 7. [Google Scholar]
- [36].Kamel Ibrahim and Faloutsos Christos. 1993. Hilbert R-tree: An Improved R-tree Using Fractals. Technical Report. [Google Scholar]
- [37].Khodakovsky Andrei, Schröder Peter, and Sweldens Wim. 2000. Progressive geometry compression. In 27th Annual Conference on Computer Graphics and Interactive Techniques. 271–278. [Google Scholar]
- [38].Liang Yanhui, Vo Hoang, Aji Ablimit, Kong Jun, and Wang Fusheng. 2016. Scalable 3D spatial queries for analytical pathology imaging with MapReduce. In 24th ACM SIGSPATIAL International Conference on Advances in Geographic Information Systems. 1–4. [DOI] [PMC free article] [PubMed] [Google Scholar]
- [39].Liang Yanhui, Vo Hoang, Kong Jun, and Wang Fusheng. 2017. iSPEED: An efficient in-memory-based spatial query system for large-scale 3D data with complex structures. In 25th ACM SIGSPATIAL International Conference on Advances in Geographic Information Systems. ACM, 17. [DOI] [PMC free article] [PubMed] [Google Scholar]
- [40].Liang Yanhui, Wang Fusheng, Treanor Darren, Magee Derek, Teodoro George, Zhu Yangyang, and Kong Jun. 2015. A 3D primary vessel reconstruction framework with serial microscopy images. In Medical Image Computing and Computer-assisted Intervention–MICCAI 2015. Springer, 251–259. [DOI] [PMC free article] [PubMed] [Google Scholar]
- [41].Liang Yanhui, Wang Fusheng, Treanor Darren, Magee Derek, Teodoro George, Zhu Yangyang, and Kong Jun. 2015. Liver whole slide image analysis for 3D vessel reconstruction. In IEEE 12th International Symposium on Biomedical Imaging (ISBI). IEEE, 182–185. [DOI] [PMC free article] [PubMed] [Google Scholar]
- [42].Liang Yanhui, Wang Fusheng, Zhang Pengyue, Saltz Joel H., Brat Daniel J., and Kong Jun. 2017. Development of a framework for large-scale three-dimensional pathology and biomarker imaging and spatial analytics. AMIA Summ. Translat. Sci. Proc. 2017 (2017), 75. [PMC free article] [PubMed] [Google Scholar]
- [43].Lodish Harvey, Berk Arnold, Zipursky S. Lawrence, Matsudaira Paul, Baltimore David, and Darnell James. 2000. Viruses: structure, function, and uses. In Molecular Cell Biology. 4th edition. WH Freeman. [Google Scholar]
- [44].Luebke David, Reddy Martin, Cohen Jonathan D., Varshney Amitabh, Watson Benjamin, and Huebner Robert. 2003. Level of Detail for 3D Graphics. Morgan Kaufmann. [Google Scholar]
- [45].Maglo Adrien, Courbet Clment, Alliez Pierre, and Hudelot Céline. 2012. Progressive compression of manifold polygon meshes. Comput. Graph. 36, 5 (2012), 349–359. [Google Scholar]
- [46].McHenry Kenton and Bajcsy Peter. 2008. An Overview of 3D Data Content, File Formats and Viewers. Retrieved from https://isda.ncsa.illinois.edu/drupal/sites/default/files/NCSA-ISDA-2008-002.pdf.
- [47].Oracle. Oracle 3D. Retrieved from https://docs.oracle.com/database/121/SPATL/three-dimensional-spatial-objects.htm#SPATL468.
- [48].Tamer Özsu M and Valduriez Patrick. 2011. Principles of Distributed Database Systems. Springer Science & Business Media. [Google Scholar]
- [49].Patel Jignesh, Yu JieBing, Kabra Navin, Tufte Kristin, Nag Biswadeep, Burger Josef, Hall Nancy, Ramasamy Karthikeyan, Lueder Roger, Ellmann Curt, et al. 1997. Building a scaleable geo-spatial DBMS: Technology, implementation, and evaluation. In ACM SIGMOD Record, Vol. 26. ACM, 336–347. [Google Scholar]
- [50].Peng Jingliang, Huang Yan, Kuo C.-C. Jay, Eckstein Ilya, and Gopi M. 2010. Feature oriented progressive lossless mesh coding. In Computer Graphics Forum, Vol. 29. Wiley Online Library, 2029–2038. [Google Scholar]
- [51].Peng Jingliang, Kim Chang-Su, and Kuo C.-C. Jay. 2005. Technologies for 3D mesh compression: A survey. J. Vis. Commun. Image Repres 16, 6 (2005), 688–733. [Google Scholar]
- [52].Peng Jingliang and Kuo C.-C. Jay. 2005. Geometry-guided progressive lossless 3D mesh coding with octree (OT) decomposition. In ACM Transactions on Graphics (TOG), Vol. 24. ACM, 609–616. [Google Scholar]
- [53].Real Lucas C. Villa, Silva Bruno, Meliksetian Dikran S., and Sacchi Kaique. 2019. Large-scale 3D geospatial processing made possible. In 27th ACM SIGSPATIAL International Conference on Advances in Geographic Information Systems. ACM, 199–208. [Google Scholar]
- [54].Roussopoulos Nick, Kelley Stephen, and Vincent Frédéric. 1995. Nearest neighbor queries. In ACM SIGMOD Record, Vol. 24. ACM, 71–79. [Google Scholar]
- [55].Rozenblatt-Rosen Orit, Regev Aviv, Oberdoerffer Philipp, Nawy Tal, Hupalowska Anna, Rood Jennifer E., Ashenberg Orr, Cerami Ethan, Coffey Robert J., Demir Emek, et al. 2020. The Human Tumor Atlas Network: Charting tumor transitions across space and time at single-cell resolution. Cell 181, 2 (2020), 236–249. [DOI] [PMC free article] [PubMed] [Google Scholar]
- [56].Stollnitz Eric J., DeRose Tony D., DeRose Anthony D., and Salesin David H.. 1996. Wavelets for Computer Graphics: Theory and Applications. Morgan Kaufmann. [Google Scholar]
- [57].Tagliasacchi Andrea, Alhashim Ibraheem, Olson Matt, and Zhang Hao. 2012. Mean curvature skeletons. In Computer Graphics Forum. Wiley Online Library, 1735–1744. [Google Scholar]
- [58].Takahashi Tohru. 2011. Pathology of Organ Structure by Analysis and Interpretation of Images (2nd ed.). SciPress, Tokyo. [Google Scholar]
- [59].Tang Mingjie, Yu Yongyang, Malluhi Qutaibah M., Ouzzani Mourad, and Aref Walid G.. 2016. LocationSpark: A distributed in-memory data management system for big spatial data. Proc. VLDB Endowm. 9, 13 (2016), 1565–1568. [Google Scholar]
- [60].Taniar David and Rahayu Wenny. 2013. A taxonomy for nearest neighbour queries in spatial databases. J. Comput. Syst. Sci. 79, 7 (2013), 1017–1039. [Google Scholar]
- [61].Terdiman Pierre. [n.d.]. OPCODE 3D Collision Detection Library, 2005. http://www.codercorner.com/Opcode.htm. [Google Scholar]
- [62].Valette Sébastien, Chaine Raphaëlle, and Prost Rémy. 2009. Progressive lossless mesh compression via incremental parametric refinement. In Computer Graphics Forum, Vol. 28. Wiley Online Library, 1301–1310. [Google Scholar]
- [63].Vo Hoang, Aji Ablimit, and Wang Fusheng. 2014. SATO: A spatial data partitioning framework for scalable query processing. In 22nd ACM SIGSPATIAL International Conference on Advances in Geographic Information Systems. ACM, 545–548. [Google Scholar]
- [64].Vo Hoang, Liang Yanhui, Kong Jun, and Wang Fusheng. 2018. iSPEED: A scalable and distributed in-memory-based spatial query system for large and structurally complex 3D data. Proc. VLDB Endow. 11, 12 (2018), 2078–2081. [DOI] [PMC free article] [PubMed] [Google Scholar]
- [65].Wang Fusheng, Kong Jun, Gao Jingjing, Cooper Lee A. D., Kurc Tahsin, Zhou Zhengwen, Adler David, Cristobal Vergara-Niedermayr Bryan Katigbak, Brat Daniel J., et al. 2013. A high-performance spatial database-based approach for pathology imaging algorithm evaluation. J. Pathol. Inform. 4, 1 (2013), 5. [DOI] [PMC free article] [PubMed] [Google Scholar]
- [66].Wang Kaibo, Huai Yin, Lee Rubao, Wang Fusheng, Zhang Xiaodong, and Saltz Joel H.. 2012. Accelerating pathology image data cross-comparison on CPU-GPU hybrid systems. Proc. VLDB Endow. 5, 11 (July 2012), 1543–1554. DOI: 10.14778/2350229.2350268 [DOI] [PMC free article] [PubMed] [Google Scholar]
- [67].Wang Mei-Tzu. 2016. Nearest neighbor query processing using the network voronoi diagram. Data Knowl. Eng. 103 (2016), 19–43. [Google Scholar]
- [68].Wang Xunxian, Lindsay Susan, and Baldock Richard. 2010. From spatial-data to 3D models of the developing human brain. Methods 50, 2 (2010), 96–104. [DOI] [PubMed] [Google Scholar]
- [69].Xie Dong, Li Feifei, Yao Bin, Li Gefei, Zhou Liang, and Guo Minyi. 2016. Simba: Efficient in-memory spatial analytics. In International Conference on Management of Data. ACM, 1071–1085. [Google Scholar]
- [70].You Simin, Zhang Jianting, and Gruenwald Le. 2015. Large-scale spatial join query processing in cloud. In 31st IEEE International Conference on Data Engineering Workshops. IEEE, 34–41. [Google Scholar]
- [71].Yu Jia, Wu Jinxuan, and Sarwat Mohamed. 2015. GeoSpark: A cluster computing framework for processing large-scale spatial data. In 23rd SIGSPATIAL International Conference on Advances in Geographic Information Systems. ACM, 70. [Google Scholar]
- [72].Zang Andi, Luo Shiyu, Chen Xin, and Trajcevski Goce. 2019. Real-time applications using high resolution 3D objects in high definition maps (systems paper). In 27th ACM SIGSPATIAL International Conference on Advances in Geographic Information Systems. 229–238. [Google Scholar]
- [73].Zhang Shubin, Han Jizhong, Liu Zhiyong, Wang Kai, and Xu Zhiyong. 2009. SJMR: Parallelizing spatial join with MapReduce on clusters. In IEEE International Conference on Cluster Computing and Workshops. IEEE, 1–8. [Google Scholar]


