Abstract
Glucose and trehalose are the main energy sources used by honeybees (Apis mellifera) for daily activities. However, there is no validated point-of-care method to reliably measure both sugars. We performed an analytical validation of a portable human glucometer (Accu-Chek; Roche) for glucose measurement in honeybee hemolymph compared to a reference method (GluCH, UniCel DxC 600; Beckman Coulter). We used 30 pooled hemolymph samples collected from the antennae of anesthetized honeybees and diluted 1:4 in 0.9% saline. We evaluated dilution linearity, spike recovery, and inter- and intra-assay imprecision. Glucose concentration was measured over time (2 h, 4 h, 8 h, 12 h, 1 d, 2 d, 3 d, 7 d, 21 d, 28 d) at various storage temperature (25°C, 4°C, −20°C, −80°C). The trehalose concentration was measured indirectly by trehalase hydrolyzation. Glucose concentrations measured by both instruments had a strong correlation (0.985, p < 0.0001) and a bias of −7.33 mmol/L (±1.96SD: 13.70 to −28.36), with linear agreement at <20 mmol/L (physiologic value: 100 mmol/L). The accuracy of the glucometer decreased at >20 mmol/L. Recovery of 115–130% of diluted spikes indicated good specificity. Inter- and intra-assay imprecision were 2.50% and 2.21%, respectively. Glucose concentrations fluctuated in stored samples dependent on time and temperature; however, glucose concentrations were constant with storage at −80°C for ≥28 d. The Accu-Chek glucometer is an adequate instrument to measure honeybee glucose concentration in hemolymph diluted with 0.9% NaCl, with good accuracy and precision at <20 mmol/L. Hemolymph storage at −80°C is suitable for long-term conservation of glucose.
Keywords: Apis mellifera, glucometer, glucose, hemolymph, honeybees, trehalase, trehalose
Honeybee hemolymph distributes molecules, nutrients, and hormones to tissues and organs in an open circulatory system.10,32 Glucose, trehalose, and fructose are the main sugars used by honeybees as a source of energy for daily activities. The concentration of sugars in hemolymph is especially high in honeybees compared to other insects. 33 Trehalose is the most important sugar used for flight and thermoregulation,22,31 and also plays a role in appetite regulation and energy metabolism. Trehalose, a very stable molecule composed of 2 D-glucose molecules, is synthesized and stored in fat bodies, and is converted into glucose and released in the hemolymph.3,15,29,32
Measuring carbohydrates in hemolymph would be helpful to evaluate physiologic status, metabolism, and homeostasis in honeybees.8,19 Considering the major role of trehalose in honeybees, its measurement can be useful. 22 Trehalase is an important enzyme in metabolism, response to stress, and regulation of trehalose concentrations in insects.24,27,29 A soluble form of trehalase has been isolated in insect hemolymph. 27
Although there is no RI for physiologic glucose values in honeybee hemolymph, glucose concentrations may vary from 11.1 to 83.2 mmol/L1,16; the trehalose concentration can reach 222 mmol/L. 7 Several analytic approaches have been used to evaluate sugar concentrations in hemolymph, including chromatography,5,22,23 enzymatic or colorimetric reaction,19,23 or refractometers. 7 However, standard analytic techniques rely on access to a laboratory, large sample volumes, and higher costs. As an alternative, portable glucometers, which require small sample volumes and are used regularly in veterinary and human medicine for the rapid estimation and monitoring of glucose concentration, 30 might be useful tools for beekeepers and researchers. Even though most glucometers have been designed for humans, the performance of glucometers has been evaluated and validated in several species, including cats, horses, dogs, deer, sheep, cattle, alpacas, and ferrets. 26 Although one study reported using a glucometer to estimate glucose concentrations in bees, 8 this method has not been validated for point-of-care testing. The glucometer and spectrophotometer are intended to measure glucose only, and cross-reactions are not expected with trehalose and fructose. A glucometer might be useful in monitoring hemolymph glucose concentration in bees.
Our aims were: 1) to perform an analytical validation (accuracy, imprecision, cross-reaction) of a portable human glucometer (Aviva Accu-Chek, NC model; Roche) in honeybees and to assess its agreement with the reference method (UniCel DxC 600; Beckman Coulter); and 2) to assess the stability of glucose concentration in hemolymph over time at various storage temperatures.
Material and methods
Sample collection
Although insects are not covered by the Canadian Council on Animal Care guidelines, all procedures were performed while respecting ethical considerations. A honeybee hemolymph extraction protocol was executed. 6 Per the recommended submission protocol to diagnostic centers, 9 honeybees were anesthetized by exposure to dry ice (CO2 and cold). Honeybees were placed on a Styrofoam plate, and their antennae were pulled out with clean tweezers followed by finger pressure on the thorax to exteriorize a hemolymph bulla, from which hemolymph was aspirated with a 2-μL manual micropipette. Aspirated hemolymph was immediately transferred to an Eppendorf tube placed in iced water (0°C) to limit melanization. A single honeybee worker yields 0.5–2.5 μL of hemolymph. We used ~2,500 honeybees for the entire experiment. All bees were euthanized by exsanguination.
Sample preparation
Saline (0.9% NaCl) was chosen as diluent and added to the pooled hemolymph. Two dilution factors for hemolymph samples were used depending on the experiment: 1:4 (method assessment, evaluation of imprecision and accuracy) and 1:9 (stability under storage conditions, trehalase protocol). For the remainder of the experiment, results are referenced as physiologic concentrations in honeybees, unless specified otherwise.
Measurement of glucose
We first determined hemolymph glucose concentration with an Accu-Chek human glucometer. Each new strip lot number (498557, 498586, 498688, 498769, 498717) was validated with Accu-Chek control solutions. Each sample was vortexed before analysis, and 1.5 μL of sample was used for each assay. Glucose concentrations were also assessed with a UniCel DxC 600 spectrophotometer at the Centre de diagnostic vétérinaire de l’Université de Montréal (Québec, Canada), using 40 μL of sample per measurement.
Accuracy
Inaccuracy was evaluated indirectly by investigating linearity under dilution and by spike-and-recovery analysis. Linearity was assessed using successive 1 in 2 dilutions (50%, 25%, 12.5%, 6.25%, 3.125%) with physiologic saline (0.9% NaCl) of freshly collected and pooled hemolymph from 30 honeybees. Linearity was evaluated on whether the slope deviated from one and the intercept from zero.
To evaluate the specificity of the Accu-Chek glucometer, a spike-and-recovery assay was performed. Hemolymph spikes at a known concentrations (9.85, 14.5, 16.4, 19.2 mmol/L) were respectively added to 15-μL samples of hemolymph.
Imprecision
Inter- and intra-assay variations were assessed on 10 repeated measures (strip lot 498769). Fresh hemolymph samples from different collection days were pooled and stored at −20°C. Intra-assay imprecision (repeatability) was performed on 10 consecutive measurements within the same assay. 21 Inter-assay imprecision (reproducibility) was assessed by measuring glucose concentrations daily in duplicate from the aliquoted sample across analytical runs (over 5 d). 21
Cross-reactions
Commercial, 10-mmol/L fructose (47740; MilliporeSigma) and 20-mmol/L trehalose (BP2687100; Thermo Fisher) solutions in 0.9% NaCl were used to assess the interference of those sugars with glucose measurement by the Accu-Chek glucometer and the UniCel DxC 600 spectrophotometer.
Method agreement
Groups of 16–30 worker honeybees were taken from 30 hives, and their hemolymph was combined to create 30 pooled samples at the Faculté de médecine vétérinaire, Université de Montréal, over the summer and fall of 2020. Samples were collected over 2 d and stored at −20°C in 250-μL Eppendorf tubes until glucose analysis. Glucose concentrations were measured with the Accu-Chek glucometer and a UniCel DxC 600 spectrophotometer 1 wk later within an interval of 3–4 h between the instruments. All measurements were done in duplicate.
Time and temperature storage conditions
Hemolymph samples were stored at different temperatures (24°C, 4°C, −20°C, −80°C) in 250-μL Eppendorf tubes for each time measurement (2, 4, 8, 12 h; 1, 2, 3, 7, 14, 21, 28 d). Glucose concentrations were measured with the Accu-Chek glucometer.
Trehalose measurement
Trehalase is an enzyme that hydrolyzes 1 molecule of trehalose into 2 molecules of glucose (Suppl. Fig. 1). To measure the trehalose concentration indirectly in hemolymph, we designed an enzymatic protocol using a trehalase solution from porcine kidney (T8778; MilliporeSigma) diluted 1:9 with 0.9% NaCl, mixed with a hemolymph sample, and incubated at 37°C for 3 h at 20 rpm on a benchtop shaker (Suppl. Fig. 1). The trehalose concentration was measured indirectly by assessing the difference in glucose concentrations measured by the Accu-Chek glucometer before and after the enzymatic reaction. Commercial 10 mmol/L of trehalose (BP2687100; Thermo Fisher) was also spiked in hemolymph samples to determine the recovery of added trehalose and to hence assess the efficacy of the enzymatic reaction.
Statistical analysis
Pearson correlation was used to assess the linearity of plotted data. Mean and CV were calculated with Excel (v.2108; Microsoft). Agreement was evaluated through Bland–Altman plot and Passing–Bablok regression (ACOMED statistical Excel program v.2108) to compare Accu-Chek glucometer measurements with UniCel DxC 600 spectrophotometer measurements. For the Bland–Altman technique, differences in values of <20 mmol/L followed a normal distribution per a Shapiro–Wilk test (p = 0.069). No values were excluded.
Results
Accuracy
Dilutions of freshly collected hemolymph in 0.9% NaCl (50%, 25%, 12.5%, 6.25%, 3.125%) were linear and proportional according to expected concentrations (Fig. 1). The lower value measured by the glucometer was 0.3 mmol/L.
Figure 1.
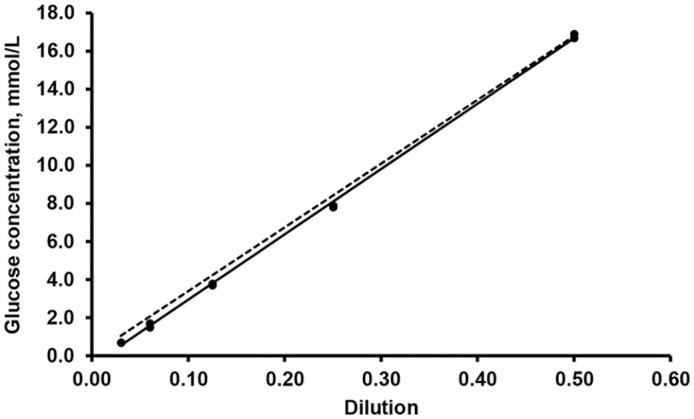
Linearity under sequential dilutions of pooled and non-diluted hemolymph (50%, 25%, 12.5%, 6.25%, 3.125%). Regression from data (solid line, y = 34.3x − 0.48) is close to expected values (dashed line, y = 33.4x + 0.04). Slope (34.3) from plotted data is similar to expected slope (33.4).
Recovery after spiking non-diluted hemolymph with a matrix of hemolymph samples was 86% at 9.85 mmol/L and 67% at 14.5 mmol/L (Table 1). On the other hand, recovery was higher when spiking diluted hemolymph samples at 16.4 mmol/L (115%) and 19.2 mmol/L (130%; Table 1).
Table 1.
Recovery of hemolymph spikes in a known concentration of a pooled hemolymph matrix.
| Measured glucose concentration of hemolymph spike, mmol/L | Recovery, % |
|---|---|
| 9.85 | 86 |
| 14.5 | 67 |
| 16.4 | 115 |
| 19.2 | 130 |
Imprecision
Intra-assay CV of the Accu-Chek glucometer was 2.09–2.97% for glucose concentrations of 7.90, 14.8, and 22.0 mmol/L (measured value), respectively (Table 2). Inter-assay CV was 2.21% at 7.90 mmol/L (measured value), for a total CV of 2.15% (Table 2).
Table 2.
Intra- and inter-assay CVs of an Accu-Chek glucometer with honeybee hemolymph.
| Sample | Intra-assay | Inter-assay | ||
|---|---|---|---|---|
| CV, % | Concentration, mmol/L | CV, % | Concentration, mmol/L | |
| Hemolymph | 2.09 | 7.90 | 2.21 | 7.90 |
| 2.97 | 14.8 | * | * | |
| 2.43 | 22.0 | * | * | |
| Human blood per manufacturer (Roche) | 3.6 | * | 2.5 | * |
No data available.
Cross-reactions
Trehalose and fructose were not detectable on Accu-Chek strips nor on the UniCel DxC 600 spectrophotometer (Suppl. Table 1).
Method agreement
Pearson correlation of 0.985 (p < 0.0001) highlights a positive, significant, and strong correlation between the Accu-Chek glucometer and the UniCel DxC 600 spectrophotometer (Fig. 2). The general equation including all 30 measurements was y = 0.74x + 19.2 (Fig. 2); when considering values <100 mmol/L only, the equation became y = 0.91x + 7.41 (Fig. 3). Better linearity was observed with Passing–Bablok regression at <100 mmol/L, with a slope closer to 1 (Fig. 3); this agreement was less at >100 mmol/L (Fig. 2). Pooled sample measurements from both methods (n = 30), plotted with the Passing–Bablok regression analysis, show a proportional and constant error with a slope of 0.74 (95% CI: 0.68–0.80) and an intercept of 19.20 (95% CI: 13.2–25.2; Fig. 2).
Figure 2.
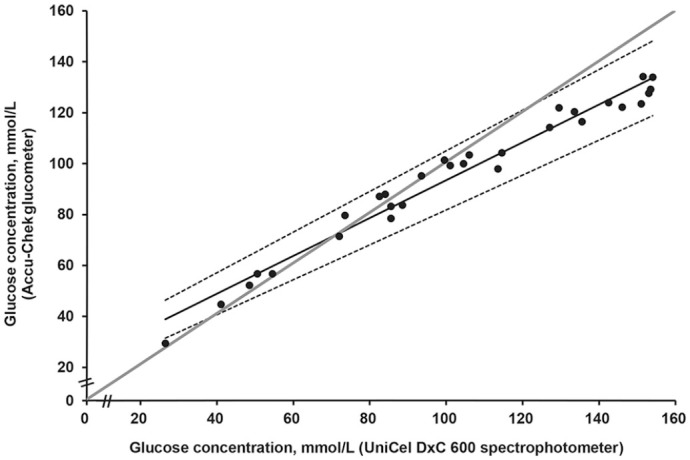
Passing–Bablok regression of glucose concentrations measured by 2 methods (UniCel DxC 600 spectrophotometer and Accu-Chek glucometer). Data are shown as dots. Solid line is the regression line (95% CI between dotted lines) with a slope of 0.74 (95% CI: 0.69–0.80) and an intercept of 19.2 (95% CI 13.3–25.2). Data <100 mmol/L are distributed around the gray solid line representing x = y (linearity), which means good correlation. Data >100 mmol/L deviate from linearity, and the curve line is flattened. Thus, the difference between values from both methods increases and the Accu-Chek glucometer underestimates glucose concentration at >100 mmol/L compared to the spectrophotometer.
Figure 3.
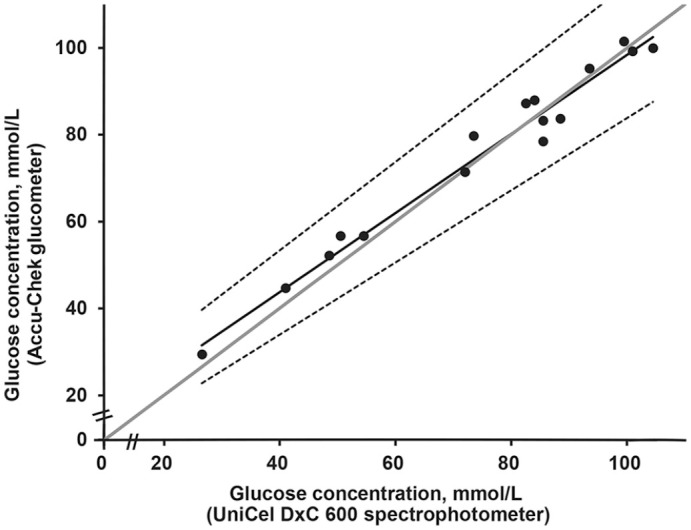
Passing–Bablok regression of glucose concentrations measured by 2 methods (UniCel DxC 600 spectrophotometer and Accu-Chek glucometer). Considering values <100 mmol/L (data shown as dots), regression line as a solid line (95% CI between dotted lines) has a slope of 0.91 (95% CI: 0.80–1.02) and an intercept of 7.71 (95% CI 0.79–12.7). There is better concordance between the instruments given that the slope is closer to 1 and data are grouped closely around the gray solid line (linearity).
Data (n = 30) in the Bland–Altman plot highlights a bias of −7.33 mmol/L (±1.96SD: 13.7 to −28.3; Fig 4). All data fall within the agreement limits and approximately −7 to 7 when <100 mmol/L (Fig. 4); hence, a strong correlation is seen at <100 mmol/L. A proportional error is seen at >100 mmol/L; the difference of values measured by both instruments increased at >100 mmol/L, as was observed with the Bland–Altman plot (Fig. 4).
Figure 4.
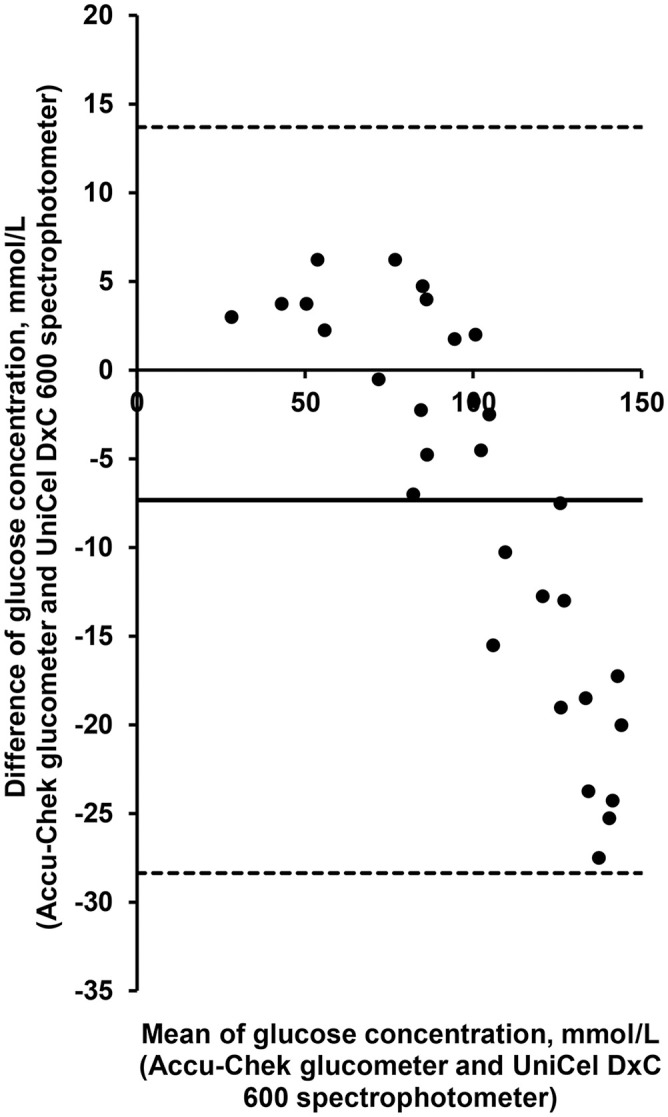
Bland–Altman plot of glucose concentrations measured by 2 methods (UniCel DxC 600 spectrophotometer and Accu-Chek glucometer). Differences between the methods fall within the dotted lines representing limits of agreement. Mean bias (systematic error, straight line) is estimated at −7.33 (±1.96SD: 13.7 to −28.3). Differences are distributed at approximately 7 and −7 below 100 mmol/L, close to zero, as it should be. Above 100 mmol/L, a proportional error is observed, in which distance from zero increases as mean value of both methods increases.
The mean glucose concentration of the 30 hemolymph samples measured on the spectrophotometer was 103 mmol/L (yields 26.5–154 mmol/L); the Accu-Chek glucometer reported a mean glucose concentration of 96.1 mmol/L (yields 29.5–134 mmol/L).
Time and temperature storage conditions
The glucose concentration increased quickly and at approximately the same rate during storage at 24°C and 4°C before reaching a plateau after ~2 d (Fig. 5). After 1.5 wk, the glucose concentration decreased to eventually reach 0 mmol/L (Fig. 5). When hemolymph samples were stored at −20°C, the maximal glucose concentration was reached after ~7 d and subsequently remained stable (Fig. 5). Storage at −80°C provided the best sample conservation; the glucose concentration remained stable over time (Fig. 5).
Figure 5.
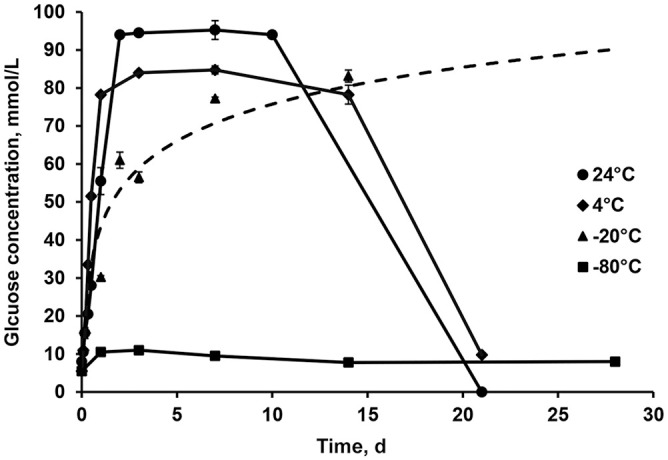
Glucose concentrations in pooled and hemolymph diluted 1:9 with 0.9% NaCl through time (2, 4, 8, 12 h; 1, 2, 3, 7, 14, 21, 28 d) at different storage temperatures (24°C, 4°C, −20°C, −80°C).
Trehalose measurement
After 3 h of incubation, the glucose concentration increased from 12.0 to 112 mmol/L in hemolymph samples (measured values: 2.40–22.5 mmol/L; Table 3), representing a physiologic trehalose concentration of 50.0 mmol/L (Table 3). A recovery of ~77% was observed when a hemolymph sample was spiked with 10 mmol/L of commercial trehalose, which shows acceptable efficacy of hydrolysis by the commercial trehalase. The expected measured glucose concentration after spiking trehalose in a sample was 4.44 mmol/L compared to 3.40 mmol/L measured by the Accu-Chek glucometer.
Table 3.
Glucose concentration in hemolymph samples during incubation with trehalase at 37°C over time.
| Incubation time, h | Glucose concentration, mmol/L | Calculated trehalose concentration, mmol/L |
|---|---|---|
| 0 | 12.0 | 50.0 |
| 3 | 112 | 0 |
Discussion
To our knowledge, analytical validation of the Accu-Chek glucometer in honeybees has not been reported previously. The small CI observed in the Passing–Bablok regression indicates good precision of the Accu-Chek glucometer. Overall, inter- and intra-assay CVs were <10%, which indicates good reproducibility over time. Given that the ideal recovery is 80–120%, the glucometer had good specificity according to our spike-and-recovery experiment, and did not cross-react with trehalose and fructose.
Several conditions can interfere with Accu-Chek glucometer values and may explain differences in results between the Accu-Chek glucometer and the spectrophotometer. The instruments used in our evaluation measure the glucose concentration with different chemical reactions. The Accu-Chek glucometer strips use an electrochemical reaction, which results in oxidoreduction of D-glucose by glucose dehydrogenase 20 ; electrons are transferred to a mediator (ferricyanide) that generates a current proportional to the glucose concentration in analyzed samples. 20 According to the manufacturer, the intra- and inter-assay CVs are respectively 3.6% and 2.5% for human blood, with linearity up to 33.3 mmol/L and a lower limit of detection of 0.6 mmol/L. Environmental factors such as temperature, humidity, and storage management of strips and samples may influence accuracy of the Accu-Chek strip. 30 Physiologic factors, including pH, prandial state, and hematocrit may also alter analysis in whole blood. 30 The UniCel DxC 600 spectrophotometer uses a hexokinase reaction, in which the residual absorbance change is correlated with the sample glucose concentration. This method requires a volume of ~50 µL (undiluted or diluted) for a single measurement. A CV of ~3% is estimated, with linearity over 0.3–38.8 mmol/L.
Because we used 30 samples and a 3–4-h interval between instrument runs for the method agreement and 10 repeated measurements for the impression assessment, those criteria are limitations. Indeed, the latest ASVCP guidelines recommend 40 samples, a maximum 2-h interval, and 20 repeated measurements. 2 Despite these limitations, we found good agreement between the instruments, and the glucometer had a low CV.
The Accu-Chek glucometer underestimates glucose concentration at concentrations >100 mmol/L (measured value of 20 mmol/L by the Accu-Chek glucometer). In fact, the regression flattens and becomes less linear at >100 mmol/L (measured value = 20 mmol/L). Given that the agreement between the methods is better at <20 mmol/L (measured value), samples should be diluted to reach concentrations below this level (0–20 mmol/L) for accurate results with the Accu-Chek glucometer. Dilution of hemolymph samples is therefore important to reach concentrations within the linear range of comparison with the reference spectrophotometer given that the physiologic glucose concentration in honeybee hemolymph can be especially high, and can exceed the range of detection of the Accu-Chek glucometer. The actual values in honeybee hemolymph can be estimated after correcting for dilution.
Melanization of hemolymph samples is a phenoloxidase reaction that occurs in bees and results in polymerization and deposition of melanin on a wound or an infectious agent.14,18 This immune process darkens hemolymph when exposed to oxygen and affects buffer efficacy, 18 consequently interfering with glucose measurement with glucometer strips. We did not assess the impact of melanization on glucose measurement in our analytical validation. Further studies would be needed to evaluate the inhibitory action of phenoloxidase over time by the addition of phenylthiourea to hemolymph samples. 25 Melanization activity also depends on temperature, and decreases in a cooler environment. 11
The honeybee hemolymph pH (estimated at 6.8) 4 is lower than that of human blood (pH 7.35–7.45). Honeybee hemolymph acidifies when diluted with 0.9% NaCl and alkalinizes when melanized; however, the enzyme in glucometer strips is also sensitive to different pHs. Although studies on the effect of decreasing pH on glucose measurement are contradictory, 17 lower or higher pH levels are known to interfere with the buffer in the glucometer strip, which can result in a false glucose decrease with acidosis and a false increase with alkalosis.17,28 Hematocrit influences glucose concentration estimation in human blood.17,30 However, hemocytes comprise <5% of the total hemolymph volume in insects 12 ; hence, such interference is less likely. Variation in sodium concentrations have been shown to interfere with the glucometer strip; indeed, it has been reported that glucose measurements are not reliable with Na concentrations >150 mmol/L. 13 Hemolymph diluted with 0.9% NaCl contains ~70 mmol/L Na, which would not interfere with the glucose measurement. Based on our experience, samples must be warmed to room temperature before using the glucometer strips; the estimated glucose concentration is lower in cool samples (stored at −20°C).
Endogenous trehalase activity can greatly influence glucose concentrations in hemolymph samples depending on the time of measurement after collection. According to our findings, endogenous trehalase is still active at 24°C, 4°C, and −20°C, but the −20°C temperature decreased trehalase activity and therefore the glucose concentration increased at a slower rate.
As we observed, endogenous trehalase hydrolyzes trehalose and hence increases the glucose concentration, depending on storage conditions (time and temperature); concentrations stabilize after several days, when trehalose is no longer available for hydrolysis. The time to reach complete hydrolysis is temperature-dependent; colder temperature slows (−20°C) or stops (−80°C) hydrolysis. We found that the glucose concentration in stock samples stored at −20°C did not vary after 1 wk of storage, given that a plateau was reached at that point; therefore, we used hemolymph that was stored for 1 wk at −20°C for most experiments. Storage of hemolymph samples at 24°C or 4°C for periods of >7 d results in rapid decreases in glucose concentration, likely secondary to bacterial activity, given that hemolymph collection is a non-sterile procedure in which samples can be exposed to various bacterial flora.
Our use of commercial trehalase was effective in measuring indirectly the trehalose concentration in hemolymph samples. Because the recovery was <100% (77%), the measured trehalose concentration might be slightly lower than the actual trehalose concentration in honeybee hemolymph. This weakness also needs to be considered when interpreting the total sugar (glucose and trehalose) concentration in the hemolymph sample.
Sample storage may influence water volume in hemolymph samples. Indeed, the glucose concentration might change secondary to condensation. However, based on our experience (not shown), this phenomenon has less significance than endogenous trehalase activity.
Supplemental Material
Supplemental material, sj-pdf-1-vdi-10.1177_10406387221117233 for Analytical validation of a portable human Accu-Chek glucometer in honeybee hemolymph by Antoine Cournoyer, Annie Deschamps, Liza Bau-Gaudreault, Pascal Dubreuil and Marie-Odile Benoit-Biancamano in Journal of Veterinary Diagnostic Investigation
Acknowledgments
We thank Dr. Siavash Maghsoudi for his participation in the project.
Footnotes
Declaration of conflicting interests: The authors declared no potential conflicts of interests with respect to the research, authorship, and/or publication of this article.
Funding: Funding for our research was provided by Programme Innov’Action – MAPAQ (Ministère de l’Agriculture, des Pêcheries et de l’Alimentation du Québec) grant 2018-2023, and Fonds du centenaire – Faculté de médecine vétérinaire, Université de Montréal.
ORCID iDs: Antoine Cournoyer  https://orcid.org/0000-0001-5226-2967
Marie-Odile Benoit-Biancamano  https://orcid.org/0000-0003-0244-1179
Supplemental material: Supplemental material for this article is available online.
Contributor Information
Antoine Cournoyer, Groupe de recherche sur les maladies infectieuses en production animale (GREMIP), Université de Montréal, Saint-Hyacinthe, Québec, Canada; Centre de diagnostic vétérinaire de l’Université de Montréal, Département de pathologie et microbiologie, Faculté de médecine vétérinaire, Université de Montréal, Saint-Hyacinthe, Québec, Canada.
Annie Deschamps, Charles River Laboratories, Senneville, Québec, Canada.
Liza Bau-Gaudreault, Charles River Laboratories, Senneville, Québec, Canada.
Pascal Dubreuil, Centre de diagnostic vétérinaire de l’Université de Montréal, Département de pathologie et microbiologie, Faculté de médecine vétérinaire, Université de Montréal, Saint-Hyacinthe, Québec, Canada.
Marie-Odile Benoit-Biancamano, Groupe de recherche sur les maladies infectieuses en production animale (GREMIP), Université de Montréal, Saint-Hyacinthe, Québec, Canada; Centre de diagnostic vétérinaire de l’Université de Montréal, Département de pathologie et microbiologie, Faculté de médecine vétérinaire, Université de Montréal, Saint-Hyacinthe, Québec, Canada.
References
- 1. Abou-Seif MA, et al. Fluctuations of carbohydrates in haemolymph of honeybee (Apis mellifica) after fasting, feeding and stress. Horm Metab Res; 1993;25:4–8. [DOI] [PubMed] [Google Scholar]
- 2. Arnold JE, et al. ASVCP guidelines: principles of quality assurance and standards for veterinary clinical pathology (version 3.0): developed by the American Society for Veterinary Clinical Pathology’s (ASVCP) Quality Assurance and Laboratory Standards (QALS) Committee. Vet Clin Pathol 2019;48:542–618. [DOI] [PubMed] [Google Scholar]
- 3. Arrese EL, Soulages JL. Insect fat body: energy, metabolism, and regulation. Annu Rev Entomol 2010;55:207–225. [DOI] [PMC free article] [PubMed] [Google Scholar]
- 4. Bishop GH. Body fluid of the honey bee larva: I. Osmotic pressure, specific gravity, pH, O2 capacity, CO2 capacity, and buffer value, and their changes with larval activity and metamorphosis. J Biol Chem 1923;58:543–565. [Google Scholar]
- 5. Blatt J, Roces F. Haemolymph sugar levels in foraging honeybees (Apis mellifera carnica): dependence on metabolic rate and in vivo measurement of maximal rates of trehalose synthesis. J Exp Biol 2001;204:2709–2716. [DOI] [PubMed] [Google Scholar]
- 6. Borsuk G, et al. A new method for quick and easy hemolymph collection from Apidae adults. PLoS One 2017;12:e0170487. [DOI] [PMC free article] [PubMed] [Google Scholar]
- 7. Božič J, Woodring J. Effect of activity on the haemolymph sugar titres in honey bees. J Apicult Res 1997;36:33–39. [Google Scholar]
- 8. Buckemüller C, et al. Octopamine underlies the counter-regulatory response to a glucose deficit in honeybees (Apis mellifera). Front Syst Neurosci 2017;11:63. [DOI] [PMC free article] [PubMed] [Google Scholar]
- 9. Canadian Council on Animal Care. CCAC guidelines on: euthanasia of animals used in science. CCAC, 2010. https://www.ccac.ca/Documents/Standards/Guidelines/Euthanasia.pdf
- 10. Chan QWT, et al. Quantitative comparison of caste differences in honeybee hemolymph. Mol Cell Proteomics 2006;5:2252–2262. [DOI] [PubMed] [Google Scholar]
- 11. Clark KD, Strand MR. Hemolymph melanization in the silkmoth Bombyx mori involves formation of a high molecular mass complex that metabolizes tyrosine. J Biol Chem 2013;288:14476–14487. [DOI] [PMC free article] [PubMed] [Google Scholar]
- 12. Clark ME, Jones JC. Hematocrit method for determining total hemocyte counts of larvae of the tobacco budworm, Heliothis virescens (Lepidoptera: Noctuidae). Ann Entomol Soc Am 1980;73:683–685. [Google Scholar]
- 13. Dimeski G, et al. Glucose meters: evaluation of the new formulation measuring strips from Roche (Accu-Chek) and Abbott (MediSense). Ann Clin Biochem 2010;47:358–365. [DOI] [PubMed] [Google Scholar]
- 14. Dudzic JP, et al. More than black or white: melanization and toll share regulatory serine proteases in Drosophila. Cell Rep 2019;27:1050–1061.e3. [DOI] [PubMed] [Google Scholar]
- 15. Even N, et al. General stress responses in the honey bee. Insects 2012;3:1271–1298. [DOI] [PMC free article] [PubMed] [Google Scholar]
- 16. Fell RD. The qualitative and quantitative analysis of insect hemolymph sugars by high performance thin-layer chromatography. Comp Biochem Physiol A Physiol 1990;95:539–544. [Google Scholar]
- 17. Gerber KL, Freeman KP. ASVCP guidelines: quality assurance for portable blood glucose meter (glucometer) use in veterinary medicine. Vet Clin Pathol 2016;45:10–27. [DOI] [PubMed] [Google Scholar]
- 18. Harrison JF, et al. Ecological and Environmental Physiology of Insects. Oxford University Press, 2012. [Google Scholar]
- 19. Hartfelder K, et al. Standard methods for physiology and biochemistry research in Apis mellifera. J Apicult Res 2013;52:1–48. [Google Scholar]
- 20. Hill B. Accu-Chek® Advantage: electrochemistry for diabetes management. Current Separations 2005;21:45–48. http://www.currentseparations.com/issues/21-2/cs21-2c.pdf [Google Scholar]
- 21. Jensen AL, et al. Diagnostic test validation. In: Weiss DJ, et al., eds. Schalm’s Veterinary Hematology. 6th ed. Wiley, 2010:1027–1031. [Google Scholar]
- 22. Mayack C, et al. Gas chromatography–mass spectrometry as a preferred method for quantification of insect hemolymph sugars. J Insect Physiol 2020;127:104115. [DOI] [PubMed] [Google Scholar]
- 23. Mayack C, Naug D. Parasitic infection leads to decline in hemolymph sugar levels in honeybee foragers. J Insect Physiol 2010;56:1572–1575. [DOI] [PubMed] [Google Scholar]
- 24. Nardelli A, et al. The evolutionary history and functional divergence of trehalase (treh) genes in insects. Front Physiol 2019;10:62. [DOI] [PMC free article] [PubMed] [Google Scholar]
- 25. Ryazanova AD, et al. The phenylthiourea is a competitive inhibitor of the enzymatic oxidation of DOPA by phenoloxidase. J Enzyme Inhib Med Chem 2012;27:78–83. [DOI] [PubMed] [Google Scholar]
- 26. Selleri P, et al. Performance of two portable meters and a benchtop analyzer for blood glucose concentration measurement in rabbits. J Am Vet Med Assoc 2014;245:87–98. [DOI] [PubMed] [Google Scholar]
- 27. Shukla E, et al. Insect trehalase: physiological significance and potential applications. Glycobiology 2015;25:357–367. [DOI] [PubMed] [Google Scholar]
- 28. Tang Z, et al. Effects of pH on glucose measurements with handheld glucose meters and a portable glucose analyzer for point-of-care testing. Arch Pathol Lab Med 2000;124:577–582. [DOI] [PubMed] [Google Scholar]
- 29. Thompson SN. Trehalose – the insect ‘blood’ sugar. In: Simpson SJ, ed. Advances in Insect Physiology. Vol. 31. Academic Press, 2003:205–285. [Google Scholar]
- 30. Tonyushkina K, Nichols JH. Glucose meters: a review of technical challenges to obtaining accurate results. J Diabetes Sci Technol 2009;3:971–980. [DOI] [PMC free article] [PubMed] [Google Scholar]
- 31. Vidal-Naquet N, et al. Honeybee veterinary medicine: Apis mellifera L. 5M Publishing, 2015. [Google Scholar]
- 32. Wegener G, et al. Long-term effects of the trehalase inhibitor trehazolin on trehalase activity in locust flight muscle. J Exp Biol 2010;213:3852–3857. [DOI] [PubMed] [Google Scholar]
- 33. Zachariah TT. Terrestrial invertebrates. In: Heatley JJ, Russell KE, eds. Exotic Animal Laboratory Diagnosis. Wiley, 2020:409–428. [Google Scholar]
Associated Data
This section collects any data citations, data availability statements, or supplementary materials included in this article.
Supplementary Materials
Supplemental material, sj-pdf-1-vdi-10.1177_10406387221117233 for Analytical validation of a portable human Accu-Chek glucometer in honeybee hemolymph by Antoine Cournoyer, Annie Deschamps, Liza Bau-Gaudreault, Pascal Dubreuil and Marie-Odile Benoit-Biancamano in Journal of Veterinary Diagnostic Investigation


