

Abstract
Intrinsically disordered polypeptides are a versatile class of materials, combining the biocompatibility of peptides with the disordered structure and diverse phase behaviors of synthetic polymers. Synthetic polyelectrolytes are capable of complex phase behavior when mixed with oppositely charged polyelectrolytes, facilitating nanoparticle formation and bulk phase separation. However, there has been limited exploration of intrinsically disordered protein polyelectrolytes as potential bio-based replacements for synthetic polyelectrolytes. Here, we produce negatively charged, intrinsically disordered polypeptides, capable of high-yield expression in E. coli and use this intrinsically disordered peptide to produce entirely protein-based polyelectrolyte complexes. The complexes display rich phase behavior, showing sensitivity to charge density, salt concentration, temperature, and charge fraction. We characterize this behavior through a combination of turbidity assays, dynamic light scattering, and transmission electron microscopy. The robust expression profile and stimuli-responsive phase behavior of the intrinsically disordered peptides demonstrates their potential as easily producible, biocompatible substitutes for synthetic polyelectrolytes.
Graphical Abstract

Introduction:
The aqueous self-assembly of block copolymers can produce a range of nanoparticles, from spherical micelles to vesicles and worms, as well as physically and chemically cross-linked hydrogel structures. Often, self-assembly is driven by hydrophobic interactions that minimize unfavorable interactions, creating materials that can solubilize hydrophobic cargo, for example for applications in drug delivery.1,2 These block copolymers can be prepared by chemical synthesis3–6, but recent examples have shown the potential for biosynthesis of a range of polypeptide block copolymers that assemble to form micelles,7,8 vesicles,9 or hydrogels.10 The use of biosynthetic block copolymers enables the fermentation of biocompatible and biodegradable protein-based materials. However, the reliance on hydrophobic interactions to drive self-assembly limits the ability to incorporate hydrophilic and charged cargos. As an alternative, polyelectrolyte complexation of charged block copolymers has also been demonstrated to form self-assembled nanoparticles and hydrogels.11–17 Of note, the formation of polyelectrolyte complex (PEC) micelles has shown great potential for the delivery of biologics ranging from nucleic acids to proteins.18–21
PEC micelles form when a hydrophilic-charged block copolymer is combined with an oppositely charged polyelectrolyte, resulting in complexation. This complexation is entropically favorable due to the release of bound counterions from complexed polyelectrolytes. The resulting complexes self-assemble into micelles, ultimately shielding the charge-neutral complex from solvent interactions.22 Synthetic polyelectrolytes in particular have been widely studied as artificial nanocarriers for gene, protein, and drug delivery applications.23,24 For example, Kim, et al. used polyelectrolyte complex (PEC) micelles to deliver supercharged immunoglobulin G to mammalian cells.20 The PEC micelles were responsive to endosomal pH, facilitating late endosomal escape of the antibody cargo and demonstrating the utility of PEC micelles in intracellular drug delivery applications. For these biological applications, it is important to ensure biocompatibility and biodegradability of the polymeric carriers. It is therefore increasingly desirable to find biopolymers that can function as biocompatible stand-ins for these well-studied synthetic polymers. Chitosan, for example, is a positively charged polysaccharide that is biocompatible and biodegradable and can form complex coacervates with DNA. It has been extensively studied for oral gene delivery due to its low immunogenicity and toxicity.25–27 Nucleic acids have also been employed for drug delivery and are capable of forming precisely tunable and uniform structures via polyelectrolyte complexation but present significant challenges as they are rapidly cleared by the body.28,29 Additionally, while both polysaccharides and oligonucleotides can form polyelectrolyte complexes, the biosynthesis of sugar or nucleic acid based block copolymers is not yet readily feasible. For this reason, we focused on the biosynthesis of protein-based polyelectrolytes and block copolymers for the formation of polyelectrolyte complexes and PEC micelles. Intrinsically disordered proteins/peptides (IDP’s) have been investigated for their stimuli-responsiveness and ability to form nanoparticles with complex architecture.8,30–33 IDP’s are of particular interest as synthetic polymer substitutes because they retain the disordered structure of most synthetic polymers, while remaining highly tunable and biocompatible. These so-called artificial protein polymers are designed and tuned for specific applications, much like their synthetic polymer analogues.
To create biosynthetic protein polyelectrolytes and block copolymers, we first identified a highly charged intrinsically disordered protein that could be produced in a microbial host.34 The high-density IDP polyelectrolyte was based on human prothymosin-α (PA). PA is an anionic disordered protein ubiquitously distributed in mammalian cells as a survival and proliferation mediator, with a molecular weight of 12.2 kDa and −0.36 net charge per residue (NCPR) at a pH of 7.4.35 Due to its small size and high charge density, PA can promote the movement of positively charged molecules through nucleus and, when fused to globular proteins, can facilitate cellular delivery using cationic liposomes.36,37 To create a charged block copolymer for PEC micelle formation, this polyanionic IDP was fused to a neutral elastin-like polypeptide (ELP). One of the most widely studied IDP’s, ELPs have been examined as stimuli-responsive, tunable, and disordered peptides for a variety of biomedical applications.38–40 Because of their stimuli-responsiveness and tunability, ELP’s have previously been used to form micelles with a hydrophobic core.41,42
Herein, we describe the biosynthesis of a panel of protein polyelectrolytes and block copolymers based on PA. These anionic biopolymers were evaluated for the ability to form polyelectrolyte complexes with a range of synthetic and biological polycations. The phase behavior as a function of polyelectrolyte mixing ratio, salt concentration, and temperature was established for both the protein polyanions and the anionic protein block copolymers. The protein polyanions macrophase separated with the supercationic protein GFP(+36) and synthetic polycations, while the anionic protein block copolymers formed PEC micelles with GFP(+36) at low temperatures and modest ionic strengths. GFP(+36) is a variant of superfolder green fluorescent protein (sfGFP) that is cationically supercharged through site-specific point mutations to introduce positively charged lysine and arginine residues.43 GFP(+36) has a molecular weight of approximately 28.5 kDa and a net charge of approximately +36 at neutral pH. The additional lysine and arginine residues are isotropically distributed across the surface of the protein. The thorough characterization of GFP(+36)-protein polyanion phase behavior provides a baseline for the design of tunable, biodegradable protein-based polyelectrolytes. Furthermore, this approach demonstrates the feasibility of preparing recombinantly expressed, entirely protein-based particles assembled through electrostatic interactions. These protein-based materials have the potential to provide biocompatible and functional nanoparticles for a diverse range of applications including drug delivery and protein stabilization.
Results and Discussion:
To evaluate the potential for biosynthesis of protein polyelectrolytes and protein block copolymers, several variants of human prothymosin alpha (PA) were designed and cloned for expression in E. coli (Figure 1a). PA was identified from the DisProt database of intrinsically disordered proteins as one of the most charge-dense disordered anionic proteins.44,45 While PA has a high charge density, with a net charge per residue (NCPR) of −0.36, this is still significantly below the expected charge density of synthetic polyelectrolytes. Additionally, unlike most synthetic polyelectrolytes, PA contains both negatively and positively charged residues. To increase the charge density of PA, we created three variants. The first substituted eight lysine (K) residues with glutamine (Q) to eliminate most of the cationic residues. This PA K to Q variant had a NCPR of −0.43. To further increase the NCPR, these same K residues were mutated to aspartate (D) or glutamate (E) to create PA K to D/E, which had a NCPR of −0.50. Finally, the third variant removed the less charge dense N-terminal region to leave only the charge dense C-terminal fraction of the PA protein (PA C-term). By removing this N-terminal portion of the protein sequence 52% of the uncharged residues were eliminated, while only 20% of the anionic residues were removed, ultimately giving PA C-term a NCPR of −0.47. To each of these variants, an N-terminal 6x-His tag followed by a glycine-serine linker (GGSS) was appended to facilitate downstream purification (Figure 1).
Figure 1.
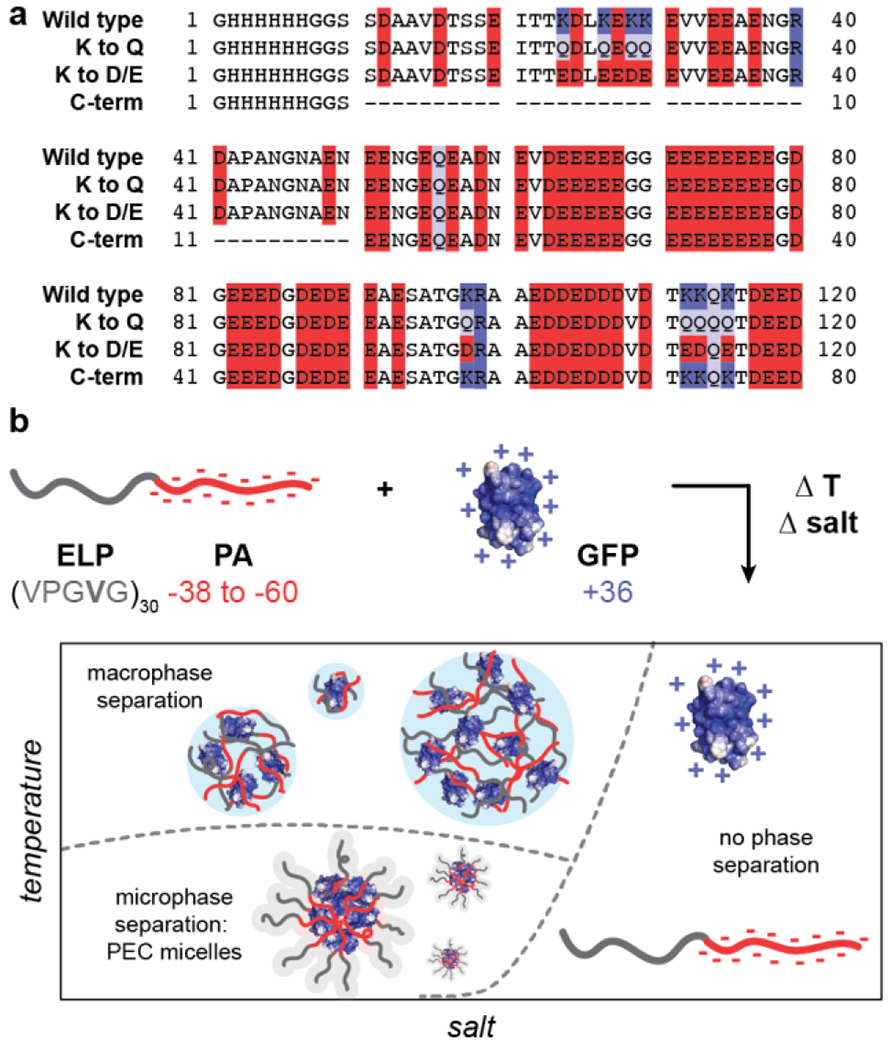
Schematic of prothymosin alpha (PA) variants studied here, (a) Primary amino acid sequence of the four PA variants with acidic residues (D,E) highlighted in red, basic residues (K, R) highlighted in blue, and glutamine residues (Q) highlighted in purple, (b) Fusion of a charge neutral elastin-like polypeptide (ELP) to the N-terminus of the PA variants enables rich phase behavior when complexed with oppositely charged polycationic proteins. A schematic of the phase behavior as a function of salt and temperature is shown.
For further characterization of the engineered protein polyelectrolyte properties, PA variants were expressed in E. coli, as previously described by Yi, et al. and purified by immobilized metal affinity chromatography.34 Each protein was successfully expressed and purified as determined by SDS- and Native-PAGE (Supporting Figure S1). However, the routine detection of the variants by Coomassie Blue staining of these gels was challenging for these polyanionic proteins. While this can largely be expected due to the lack of aromatic residues and extremely low abundance of basic amino acids, this does complicate the characterization of biosynthesized protein polyelectrolytes. Staining with a polyhistidine stain was performed to further confirm the successful purification of PA polyanions and ELP-fusions (Supporting Figure S1). Following successful preparation of the protein polyanions, we next sought to biosynthesize disordered protein block copolymers with a polyanionic block. The four PA variants were fused to the C-terminus of an elastin-like peptide, GVG-(VPGVG)29-VPGWP (ELP-V30). The fusion protein also contained an N-terminal 6xHis tag to facilitate purification with a flexible linker composed of glycine and serine (SSG) between the ELP domain and the 6xHis tag. These fusion proteins were also successfully expressed and purified, as assessed by gel electrophoresis (Supporting Figure S1).
Characterization of bulk phase separation behavior of ELP-PA’s and PA’s
With this panel of four protein polyanions and four hydrophilic-anionic fusion proteins purified, we sought to evaluate their phase behavior as a function of polyelectrolyte partner, salt concentration, and temperature. The four protein polyanions were expected to phase separate with synthetic and biological polycations, with this macrophase separation dependent on the overall solution ionic strength. Given polyelectrolyte complexation has a strong dependence on salt concentration, it was anticipated that phase separation would only be observed below a critical salt concentration. For the charged protein block copolymers, microphase separation with oppositely charged polyelectrolytes was expected. However, given that ELP-V30 has been shown to be temperature-responsive, with a lower critical solution temperature (LCST) and a reported cloud point of 50.6 °C, more complex phase behavior was also anticipated.46 To better characterize the LCST behavior of the ELP block of the ELP-PA fusions, ELP-V30 was expressed, purified, and its cloud point at a concentration of 0.8 mg/mL was assessed by monitoring turbidity as temperature was increased. ELP-V30 displayed a cloud point at approximately 48 °C, similar to the reported cloud point. However, ELP-PA WT displayed no LCST below 75 °C, suggesting an increase in hydrophilicity of the fusion protein compared to the ELP-V30 peptide. (Supporting Figure S2). Additionally, the LCST of [VPGVG]n ELP’s, has been shown to be sensitive to NaCl, with increasing concentrations of NaCl decreasing the LCST of the ELP.47 Because polyelectrolyte complexation is electrostatically driven and salt screens electrostatic interactions, increasing salt concentration decreases the driving force for polyelectrolyte complexation. Above a critical salt concentration, the driving force is sufficiently weakened and neither micelle formation nor bulk phase separation is observed. We therefore hypothesized that the ELP-PA fusions when combined with an oppositely charged polyelectrolyte, would undergo phase separation and the nature of the phase separation would be dependent upon temperature, mixing ratio of the polyelectrolytes, and salt concentration (Figure 1b). When solution conditions favor complexation of the charged portion of the peptide and ELP-solvent interactions are favorable, micelles should form to minimize interaction between the polyelectrolyte complex and the solvent and to minimize the interfacial surface area between the polyelectrolyte complex core and ELP corona. If both the ELP block and the anionic block of the peptide become less favorable in their solvent interactions, the micelles will transition to bulk phase separation because of unfavorable ELP-solvent interactions and decreasing interfacial surface tension between the core and the corona of the micelles. If the PA polyelectrolyte complexation is not favored and the ELP maintains sufficient hydrophilicity, no micelles or bulk phase coacervates will form and the system will remain a single-phase. (Figure 1b).
To select an oppositely charged polyelectrolyte partner for phase separation with the eight polyanionic IDP variants, several polyelectrolytes were screened for bulk phase separation with PA WT (Figure 2). The wild-type PA polyanion was mixed with polycations – quaternized poly-(4-vinylpyridine) (qP4VP), poly(2-(dimethylamino)ethyl methacrylate) PDMAEMA, poly(allylamine) (PAH), and GFP(+36) – at varying mixing ratios in a low salt buffer (10 mM tris, pH 7.4) at room temperature. The turbidity of the resulting mixtures was measured at 750 nm and plotted as a function of the positive charge fraction (Figure 2a). PA WT phase-separated with the protein polycation, GFP(+36), over a wide range of charge fractions, despite this polycation being the least charge-dense of those tested. To further confirm bulk phase separation between GFP(+36) and PA polyanions, light microscopy images were taken at a positive charge fraction of 0.5 for GFP(+36) mixed with each of the PA variants. The images reveal a liquid-like phase separation for PA WT that becomes increasing gel- and solid-like with increasing charge density of the PA polyanions as indicated by the aggregates and non-spherical droplets formed by the two most charge dense peptides, PA K to D/E and PA C-term (Supporting Figure S3). Interestingly, the synthetic polycations qP4VP and PDMAEMA also phase separated at certain mixing ratios but limited or no phase separation was observed for the most charge-dense polyelectrolyte tested, PAH, across almost all mixing ratios tested. For these reasons, the complete phase behavior of the low charge density protein polycation, GFP(+36), with the panel of the engineered protein polyanions and block copolymers was evaluated.
Figure 2.
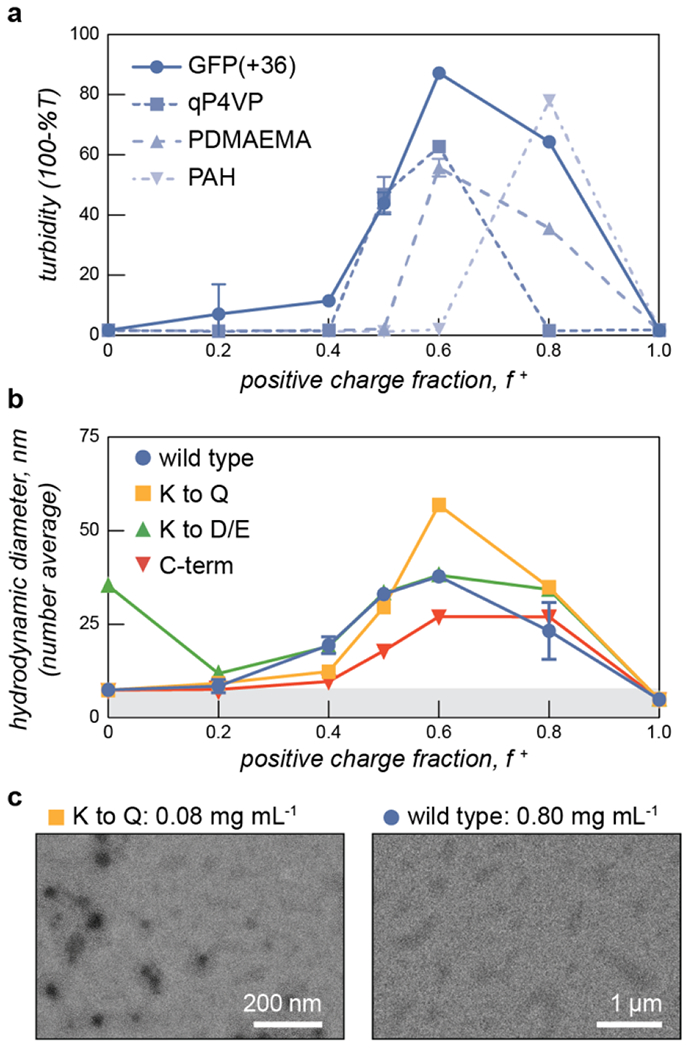
(a) Turbidity assays with PA WT with oppositely charged polyelectrolytes - GFP(+36), qP4VP, PDMAEMA, and PAH show that the protein polyanion phase separates with a range of polycations as evidenced by regions of increased turbidity. Samples were measured at 1.0 mg mL−1 total macromolecule concentration in 10 mM tris buffer, pH 7.4. (b) Dynamic light scattering of ELP-PA variants mixed with the cationic protein GFP(+36) at increasing positive charge fraction shows assemblies with a larger hydrodynamic radius than the consistutent proteins. Samples were measured at 0.8 mg mL−1 total macromolecule concentration in 10 mM tris buffer, pH 7.4. (c) Transmission electron micrographs of representative ELP-PA samples prepared at 5 °C and f + = 0.6 at the indicated sample concentration.
We first confirmed that the ELP-PA fusion proteins were capable of microphase separation with GFP(+36), at temperatures well below the LCST when the ELP is sufficiently hydrophilic to stabilize micelle formation. To evaluate micelle formation, ELP-PA variants were mixed with GFP(+36) at increasing positive charge fractions and the mixtures were measured by dynamic light scattering (DLS) at 5 °C (Figure 2b). At several mixing ratios with excess GFP (f + = 0.5-0.8), small particles with an average hydrodynamic radius ~25-50 nm were observed. These particles were larger than the individual proteins and were coincident with an increase in derived count rate, which corresponds with the scattering intensity of the solution (Supporting Figure S4). Additionally, at these mixing ratios the polydispersity index dropped below 0.2, further suggesting the presence of microphase separated particles (Supporting Figure S4). Particle size distribution and correlation data also suggest the formation of micelles: particle size distributions showed a single peak with relatively low dispersity and correlation functions were consistent with a single decay time (Supporting Figure S5). Additional confirmation of select samples was provided via TEM and multi-angle light scattering, after a size exclusion chromatography separation step (SEC-MALS) (Figure 2c, Supporting Figure S5). At a positive charge fraction of 0.6, ELP-PA WT and GFP(+36) mixtures were assessed via multi-angle light scattering, revealing a population of particles that eluted after about 15 min. An increase in absorbance at 280 nm was coincident with the increase in scattering intensity and fitting of the multi-angle light scattering data suggests a population of low-dispersity (Đ = 1.075) particles with a number average diameter of 46.8 nm. Though samples appear larger by MALS than DLS (d = 57 ± 2 nm), these results further support the presence of micelle-sized particles in ELP-PA and GFP(+36) mixtures. Micelles were also identified via TEM for certain samples, such as ELP-PA K to Q at a positive charge fraction of 0.6; however, larger assemblies (>1 μm) were also observed for certain variants at conditions that did not result in macroscopic phase separation based on both turbidity and DLS data (Figure 2c). Specifically, for ELP-PA WT and GFP(+36) (f + = 0.6 and 0.8 mg/mL macromolecules) in 10 mM tris buffer at pH 7.4, micrometer-scale assemblies of inconsistent shape were observed. These larger assemblies were most often observed by TEM at high total macromolecule concentration. It is possible that micrometer-scale irregularly shaped assemblies, where observed, were an artifact of TEM sample preparation. However, it also suggests that micelles may be metastable and relatively small changes in conditions may be sufficient to induce an order-order transition from nanometer-scale micelle formation to assemblies of larger size, or even bulk phase separation. With microphase separation at low temperature confirmed for each ELP-PA variant with GFP(+36), we set out to fully characterize the phase space as a function of salt, temperature, and charge fraction for both the PA variants and of each of the ELP-PA variants mixed with GFP(+36).
We first established a baseline for the salt, temperature, and charge fraction-dependent macrophase separation of the four PA polyanions with GFP(+36). To identify areas of the salt-temperature-charge fraction phase space that result in bulk phase separation, we performed a series of turbidity assays, gradually increasing the temperature from 5 °C to 60 °C for all four PA protein polyanions at a variety of charge fractions and salt concentrations (Figure 3, Supporting Figures S7–10). As expected, all PA polyanion variants, when mixed with GFP(+36), displayed decreasing turbidity with increasing NaCl concentration. PA WT and PA K to Q did not display significant turbidity above 300 mM NaCl at any temperature or mixing ratio (Figure 3, Supporting Figures S7–8). Phase separation above 200 mM NaCl was only observed at very low temperatures (5 °C to 10 °C ) between 0.4 and 0.6 positive charge fraction. The more charge-dense polypeptides, PA K to D/E and C-term had a larger two-phase region with a higher critical salt concentration and were observed to phase separate at a wide range of mixing ratios and temperatures up to a salt concentration of 300 mM NaCl (Figure 3, Supporting Figures S9–10). This demonstrates that the critical salt concentration associated with bulk phase separation depends upon the charge density of the PA polypeptide, with more charge dense homopeptides showing higher critical salt concentrations.
Figure 3.
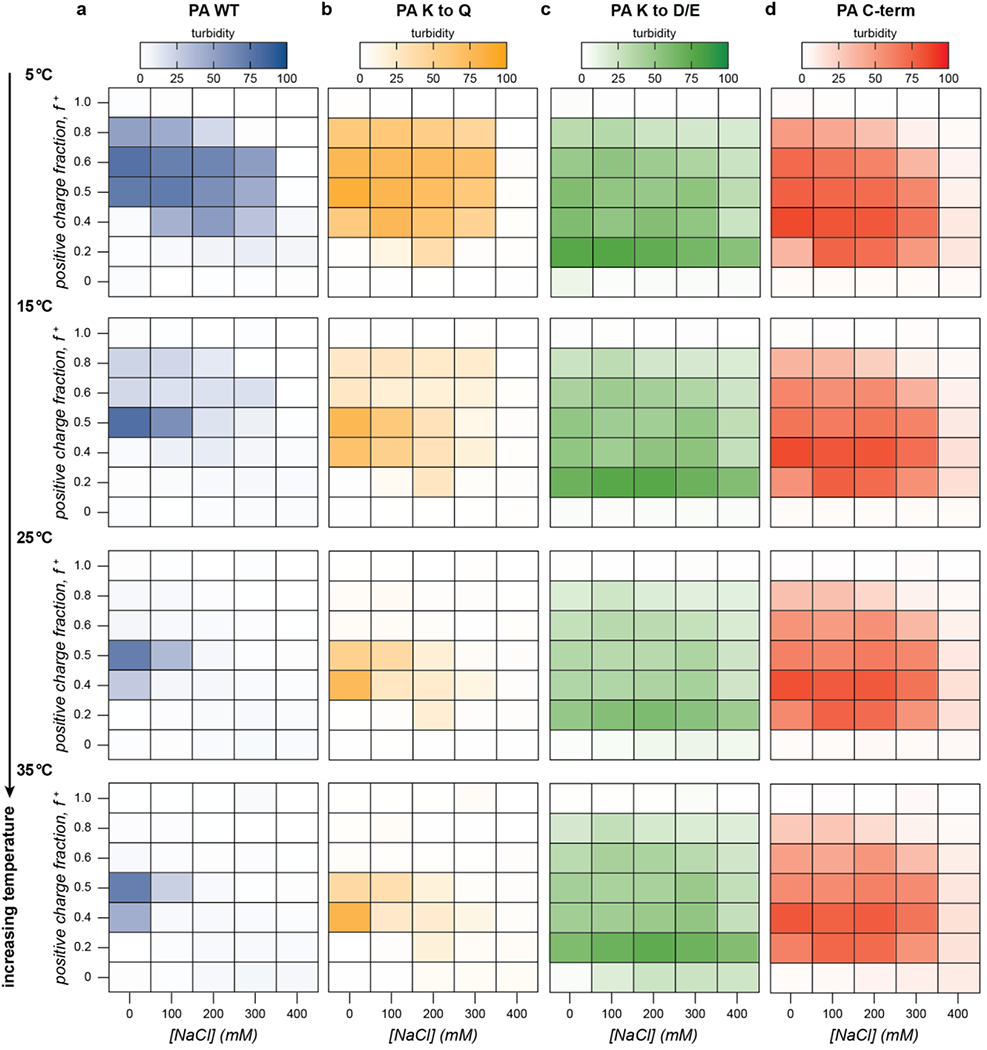
The phase behavior of PA variants was assessed by turbidity measurements (λ = 750 nm) as a function of charge fraction, salt concentration, and temperature. Select turbidity data at increasing temperatures has been plotted as heat maps with more saturated hues indicating higher turbidity. Mixtures of each PA variant and GFP(+36) were prepared at 1 mg mL−1 in 10 mM tris buffer, pH 7.4 and were allowed to equilibrate at each temperature for 15 min.
With an understanding of the salt dependent phase behavior, the temperature dependence of the macrophase separation of the PA polyanion variants with GFP(+36) was evaluated. At low temperature, all the PA polypeptides phase-separated at a broad range of mixing ratios up to 300 mM NaCl (Figure 3). For the less charge-dense PA’s, as temperature increased, turbidity and the number of mixing ratios at which phase separation was observed both decreased (Figure 3). Above 25 °C, phase separation was only observed near charge neutrality at 0 mM NaCl for PA WT and PA K to Q. In contrast, at low temperature (5 °C) phase separation was observed up to 300 mM NaCl between 0.4 and 0.6 positive charge fraction for PA WT and PA K to Q. These results imply decreasing thermodynamic favorability of bulk phase separation with increasing temperature at certain conditions near the phase boundary. At other conditions well within the phase space for bulk phase separation, however, turbidity values displayed little to no temperature dependence. At f+ = 0.5 and 0 mM NaCl, for example, samples were turbid at all measured temperatures 5 °C to 60 °C and showed only marginal decreases in turbidity with respect to temperature. These results suggest that temperature-dependent decreases in bulk phase separation may be limited to areas near the phase boundary, while areas further from the boundary show little to no temperature-dependence. In addition, this temperature dependence was only observed for the low charge density polypeptides as temperature had a minimal effect on the bulk phase separation of the more charge-dense variants, PA K to D/E and PA C-term (Figure 3, Supporting Figures S9–S10). We hypothesize that near the phase boundary, the entropy of mixing of the polyelectrolytes in the solution dominates the entropy of counterion release ultimately favoring mixing rather than de-mixing. Finally, changes in temperature also modestly shifted the turbidity maxima to lower positive charge fractions for all PA protein polyanions.
Microphase separation of ELP-PA’s and phase diagrams
With this baseline understanding of the macrophase separation of the PA polyanions with GFP(+36) as a function of mixing ratio, temperature, and salt concentration, we evaluated how each of these variables impacted the microphase and macrophase separation of ELP-PA variants with GFP(+36). The macrophase separation of the block copolymer fusion proteins with GFP(+36) was first evaluated by turbidity measurement. Increasing temperature had the opposite effect on the ELP-PA fusions as it did on the PA polyelectrolytes. For all fusion proteins, little to no bulk phase separation was observed at low temperatures and the area of bulk phase separation gradually increased with increasing temperature at all salt concentrations (Figure 4, Supporting Figures S11–14). Dynamic light scattering of ELP-PA GFP(+36) mixtures at 5 °C suggested microphase separated micelles form, instead of bulk phase separation (Figure 2). These micelles (RH ~ 25-50 nm) are too small to scatter light at 750 nm, which is consistent with the observed lack of turbidity. Upon reaching a transition temperature (~15-20 °C), the turbidity rapidly increased, with samples becoming visibly turbid and containing micron sized particles or aggregates as observed by optical microscopy (Supporting Figure S3). Further increases in temperature resulted in a broadening of the salt and mixing ratios that promoted macrophase separation for all four ELP-PA fusion proteins.
Figure 4.

The macrophase separation behavior of ELP-PA variants was assessed by turbidity measurements (λ = 750 nm) as a function of charge fraction, salt concentration, and temperature. Select turbidity data at increasing temperatures has been plotted as heat maps with more saturated hues indicating higher turbidity. Mixtures of each ELP-PA variant and GFP(+36) were prepared at 0.8 mg mL−1 in 10 mM tris buffer, pH 7.4 and were allowed to equilibrate at each temperature for 15 min.
We hypothesize that ELP-PA and GFP(+36) macrophase separation is favored only when the ELP block does not have favorable enough interactions with the solvent to stabilize polyelectrolyte complexes and inhibit coalescence. At low temperature, the presence of small particles suggests that the ELP block is sufficiently hydrophilic to successfully shield PA-GFP(+36) complexes from unfavorable solvent interactions. Increasing temperature decreases the favorability of ELP-solvent interactions. Above some critical temperature, this likely causes stabilized micelles to coalesce into bulk phase separated assemblies as the ELP solubility decreases. The transition from micelle formation to bulk phase separation, however, occurs well below the LCST of the isolated ELP domain. This suggests that ELP-solvent interactions alone are not enough to explain the transition and that the GFP(+36)-PA complexes play an important role in the transition to bulk phase. As temperature further increased, bulk phase separation was more favorable and occurred at a wider variety of salt concentrations and mixing ratios. As the temperature approached the transition temperature of the ELP, bulk phase separation occurred even above the critical salt concentration for ELP-PA and GFP(+36) bulk phase separation (Figure 4, Supporting Figures S11–14). The continued presence of bulk phase separation above this critical salt concentration suggests that ELP-solvent interactions are a primary and necessary component of bulk phase separation of ELP-PA fusions.
Though turbidity was largely positively correlated with temperature, each of the four variants had an area of moderate salt concentration and high positive charge fraction, for which turbidity did not monotonically increase with temperature. At a positive charge fraction of f + = 0.8 and moderate salt concentration (100 and 200 mM NaCl), multiple variants, most clearly ELP-PA K to Q and ELP-PA C-term, saw a turbidity maximum around 25 °C, followed by lower turbidity as the temperature further increased (Figure 4, Supporting Figures S12 and S14). This unexpected behavior may be because increasing temperature decreases the favorability of bulk phase separation at high GFP(+36) charge fraction. PA polyanions also demonstrated decreases in turbidity at high charge fractions; the maxima of turbidity for PA WT at 0 mM NaCl, for example, shifted from 0.6 at 5 °C to 0.4 at 60 °C (Figure 3a). It is therefore likely that the 0.8 charge fraction samples sit near the phase boundary, such that as the temperature increases, the phase boundary is crossed. In sum, as temperature initially increases, these samples with excess GFP(+36) form micelles and then undergo an order-order transition from soluble micelles to insoluble complexes, but further increases in temperature favor mixing of the polyelectrolytes and decrease the favorability of phase separation resulting in a homogenous solution.
After establishing areas of the temperature-salt-mixing ratio phase space that resulted in macrophase separation, we next characterized the microphase separation of the ELP-PA fusion proteins with GFP(+36). Micelle formation was determined using a combination of DLS and transmission electron microscopy (TEM). The impact of salt concentration on micelle formation at low temperature was evaluated first. Samples of each ELP-PA mixed with GFP(+36) at varying mixing ratios were prepared at 5 °C in the absence of salt and then measured by DLS. The salt concentration was subsequently increased to 400 mM NaCl in increments of 100 mM, with DLS measurements at each salt concentration. For all variants, at 0 mM NaCl, particles with a diameter of 25 to 50 nm were observed. Particles with the largest hydrodynamic radius (RH) and highest scattering intensity, as monitored by the derived count rate, formed at a positive charge fraction of 0.6 (Figure 5, Supporting Figures S15–22). Increasing salt concentration generally resulted in decreases in derived count rate and number average diameter, perhaps because of the decreased driving force for micelle formation (Supporting Figures S15–S22). As a representative example, at a positive charge fraction of 0.6, increases in the salt concentration resulted in decreases to both the average particle diameter and the derived count rate until a critical salt concentration was reached, above which no particle formation was observed (Figure 5, Supporting Figures S15–S18). Similar trends were observed at other micelle forming mixing ratios. Above the critical salt concentration, typically 300 mM NaCl, there was insufficient scattering for reliable measurement by DLS, indicating a transition from micelles to a homogeneous solution in agreement with turbidity measurements (Supporting Figures S11–S14). The observed critical salt concentration by DLS mirrored that observed by turbidity, with the lower charge density variants, WT and K to Q, having a critical salt concentration of ~200 mM and the higher charge density variants, K to D/E and C-term, having a higher critical salt concentration (~300 mM) (Figure 5).
Figure 5.

(a) The hydrodynamic diameter of assmeblies was monitored by DLS as a function of salt concentration for each ELP-PA variant. As salt concentration increased each variant transitioned from microphase separated particles lo turbid solutions. (b) A combination of DLS (solid data points) and turbidity (open data points) results were used to determine the transition temperature for microphase to macrophase separation for each ELP-PA variant as a function of ionic strength. Samples in (a) and (b) were mixed at f + = 0.6 and measured at 0.8 mg mL−1 total macromolecule concentration in 10 mM tris buffer, pH 7.4.
Following evaluation of the salt and mixing ratio dependence of the microphase separation, we next evaluated the temperature dependence of micelle formation. Efforts focused on f + = 0.6, as this mixing ratio resulted in the highest scattering intensity, as measured by the DLS derived count rate, and the lowest dispersity. To evaluate the effect of temperature on micelle formation, mixtures of each ELP-PA variant with GFP(+36) at f + = 0.6 were prepared at varying salt concentrations (0-200 mM). These mixtures were then measured by DLS as the temperature was increased from 5 °C to 35 °C in 2 °C increments (Figure 5b, Supporting Figures S23–26). As temperature increased, a sharp increase in average diameter was observed. This transition largely coincided with that observed by changes in turbidity in previous assays (Figure 4). This combined evidence indicates a likely transition between microphase and macrophase separation. The observed transition temperature increased with increasing salt concentration for all variants but ELP-PA K to D/E. We attributed increases in transition temperature with increasing salt concentration to more favorable polyelectrolyte complex-solvent mixing and therefore a relative increase in the overall hydrophilicity of the ELP-PA and GFP(+36) complexes.
These combined datasets enable the creation of phase diagrams that identify regions of micelle formation, bulk phase separation, and no phase separation (Figure 6). We first establish the phase boundaries for the PA polyanion variants with GFP(+36) as a function of salt and temperature at the optimal mixing ratio (f + = 0.5). As expected, increasing salt concentration decreases the propensity for phase separation (Figure 6a–d). Similarly, increasing the charge density on the polyanion results in phase separation across a greater range of temperatures and salt concentrations (Figure 6c–d). As discussed above, for most of the variants mixing was more favorable at elevated temperatures, likely due to favorable entropy of mixing of the polyelectrolytes in aqueous solution. These phase diagrams for the PA variants provide useful comparison to those for the ELP-PA fusions. Similar approximate phase diagrams were prepared for each ELP-PA variant when mixed with GFP(+36) at the optimal charge fraction for micelle formation (f + = 0.6). The phase diagrams make the effects of salt and temperature on micelle formation clear. As temperature increases, the ELP end of the block copolymer becomes increasingly hydrophobic, especially as the LCST of the ELP is approached. Therefore, increasing temperature at any salt concentration tested eventually causes a transition to bulk phase separation. This is largely in contrast to the phase behavior observed for mixtures of PA polyanions and GFP(+36), where phase separation at elevated temperatures was not favored for polyanions with low charge density. The LCST transition temperature for the ELP-PA variants, however, is affected by salt concentration. Because salt screens interactions between GFP(+36) and the PA block of the peptide, increasing salt concentration almost universally increases the transition temperature. At lower temperatures, salt concentration and the associated screening of electrostatic interactions determines whether micelle formation or no phase separation is observed. Micelles are observed at low salt concentration when the PA block of the peptide forms polyelectrolyte complexes that favor de-mixing from solution.
Figure 6.
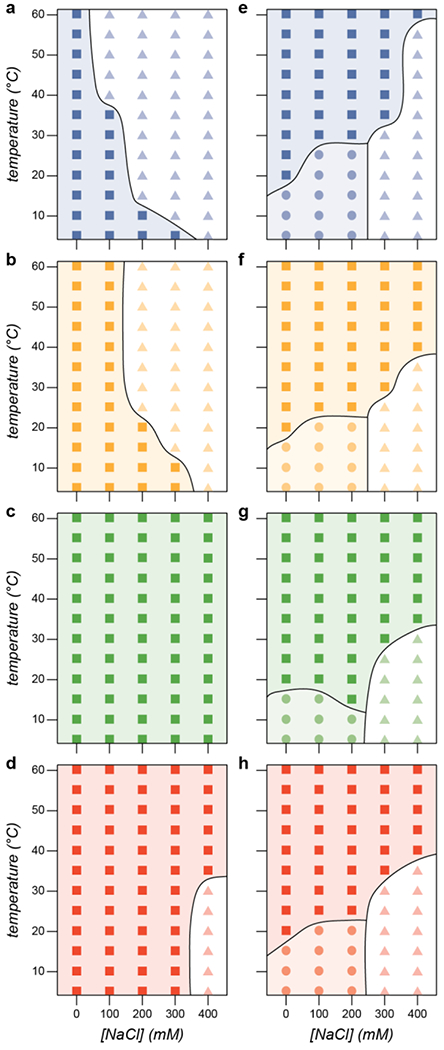
Phase diagram at f+ = 0.5 for (a) PA WT (blue), (b) PA K to Q (yellow), (c) PA K to D/E (green), and (d) PA C-term (red). Each of these proteins phase separates with GFP(+36) at low salt concentrations (squares), A single phase region (triangles) is observed in (a), (b), and (d). Phase diagram at f + = 0.6 for (e) ELP-PA WT, (f) ELP-PA K to Q, (g) ELP-PA K to D/E. and (h) ELP-PA C-term. Each of these protein block copolymers forms micelles with GFP(+36) at low temperatures and salt concentrations (circles) and undergoes an order-order transition from microphase separated micelles to macrophase separated particles (squares). Additionally, a single phase region was also observed at high ionic strengths and low temperatures (triangles).
Conclusions
We designed intrinsically disordered anionic polypeptides that were successfully produced recombinantly in E. coli. The anionic polypeptide, prothymosin-α, was colloidally stable at concentrations used for polyelectrolyte complexation. The parent PA polypeptide was expressible even after additional supercharging and truncation: removal of a low charge-density region of the peptide did not affect colloidal stability and the resulting proteins did not aggregate under tested conditions These polyanionic peptides were also fused to a temperature-responsive polypeptide, elastin-like peptide, to make intrinsically disordered hydrophilic-anionic block copolypeptides.
Both the PA and the ELP-PA fusions proteins were charge-dense enough to participate in polyelectrolyte complexation with several different polycations. Ultimately, the supercationic globular protein GFP(+36) was selected as a polyelectrolyte partner to better explore the phase behavior of these peptide polyanions. Phase separation with GFP(+36) was characterized in terms of salt concentration, temperature, charge fraction, and charge density of the ELP-PA variant. For PA polyanions, bulk phase separation showed an inverse dependence on temperature: as temperature increased, bulk phase separation occurred in progressively more limited areas of the phase space. This suggests that polyelectrolyte complexation is entropically unfavorable at certain concentrations, suggesting an entropic gain due to mixing of the polyelectrolytes and the solvent that is greater than the entropic loss associated with condensation of bound counterions on the polyelectrolyte chain. Although the most favorable conditions for phase separation – charge neutrality and low ionic strength – showed little to no dependence on temperature. In addition, as expected, increasing salt concentration decreased the favorability of bulk phase separation and the most charge dense PA variants showed the highest critical salt concentration.
Owing to the temperature responsivity of the ELP block, PA-ELP fusions showed a different dependence on temperature. At low temperature, no bulk phase separation was observed and as temperature was increased, bulk phase separation was observed over progressively greater areas of the phase space. This bulk phase separation at increasing temperature is consistent with the LCST behavior of the ELP as it is increasingly solvophobic with increasing temperature. Like the PA polyanions, ELP-PA fusions were less likely to bulk phase separate with increasing salt concentration and the highest charge density ELP-PA’s demonstrated the highest salt resistance.
At low temperatures where the ELP is most solvophilic, small assemblies approximately 50 nm in diameter were observed by dynamic and multi-angle light scattering. As temperature increased, these assemblies transitioned to bulk phase separation, as determined by turbidity measurements, likely due to the increasing solvophobicity of the ELP. Transmission electron microscopy confirmed the presence of micelles at low salt concentration, though bulk phase polyelectrolyte complexes were also observed, suggesting either metastability of the assembled particles or sensitivity to concentration and solution conditions. Overall, for all of the ELP-PA variants, microphase separation was observed at low salt concentration and low temperature. Increasing salt concentration resulted in a transition to a homogeneous solution and increasing temperature resulted in a transition to bulk phase separation once the ELP-block was no longer sufficiently solvophilic to stabilize the microphase separated polyelectrolyte complex assemblies.
The PA polyanions and ELP-PA fusions reported here demonstrate the potential utility of charged intrinsically disordered peptides as biocompatible replacements for synthetic polymers. These results suggest several promising uses for peptide-based polyelectrolyte complexes. Given their biocompatibility and biodegradability, intracellular drug delivery represents a particularly interesting potential application. Because intracellular drug delivery most frequently occurs in vivo, it is often desirable to design nanocarriers such that they are stable at physiological pH, temperature, and salt concentration. Further, similar synthetic nanoparticles, such as lipid nanoparticles, have been most successful at delivering cargo into cells with spherical morphologies between 60 and 150 nm in diameter, with smaller diameters favored for hepatic applications.48–51 Future work will tune the peptide-based complexes explored in this manuscript, adjusting their phase behavior to better suit intracellular drug delivery applications. Specifically, it will focus on creation of a cationic disordered peptide capable of complexing anionic nucleic acids and protein cargos that has a more hydrophilic corona to facilitate micelle formation at higher temperatures. The modularity of these peptide polyelectrolytes could also enable the facile addition of targeting ligands and endosomal membrane disruptors, facilitating tissue-specific delivery and increased endosomal escape efficiency.
Supplementary Material
Acknowledgements
The authors acknowledge financial support from the National Institutes of Health under award number NIH-NIGMS-R35GM138378. Dynamic light scattering measurements were performed in the Columbia University Shared Materials Characterization Laboratory. Multi-angle light scattering measurements were performed at the Columbia University Precision Biomolecular Characterization Facility with the assistance of Jia Ma. Transmission electron microscopy images were taken at the Columbia University Electron Microscopy Lab, with the assistance of Amirali Zangiabadi. We would also like to acknowledge Chen Chen for her assistance in querying the DisProt database and screening potential charged intrinsically disordered proteins.
Funding Sources.
J.M.H., Y.Z., S.Y.A. and A.C.O received funding from the National Institutes of Health (NIGMS) under award number NIH-NIGMS R35GM138378.
Footnotes
Supporting Information. (PDF) The supporting information is available free of charge at [website]. This PDF includes information on general materials and methods, experimental procedures, and supplemental experimental data.
References:
- 1.Gong J, Chen M, Zheng Y, Wang S and Wang Y, J. Controlled Release, 2012, 159, 312–323. [DOI] [PubMed] [Google Scholar]
- 2.Ghezzi M, Pescina S, Padula C, Santi P, Del Favero E, Cantù L and Nicoli S, J. Controlled Release, 2021, 332, 312–336. [DOI] [PubMed] [Google Scholar]
- 3.Feng Z, Lin L, Yan Z and Yu Y, Macromol. Rapid Commun, 2010, 31, 640–644. [DOI] [PubMed] [Google Scholar]
- 4.Li G, Song S, Zhang T, Qi M and Liu J, Int. J. Biol. Macromol, 2013, 62, 203–210. [DOI] [PubMed] [Google Scholar]
- 5.Kataoka K, Harada A and Nagasaki Y, Adv. Drug Deliv. Rev, 2012, 64, 37–48. [DOI] [PubMed] [Google Scholar]
- 6.Cabral H, Miyata K, Osada K and Kataoka K, Chem. Rev, 2018, 118, 6844–6892. [DOI] [PubMed] [Google Scholar]
- 7.Choi J-W, Choi S-H and Won J-I, Biomacromolecules, 2021, 22, 2604–2613. [DOI] [PubMed] [Google Scholar]
- 8.Klass SH, Smith MJ, Fiala TA, Lee JP, Omole AO, Han B-G, Downing KH, Kumar S and Francis MB, J. Am. Chem. Soc, 2019, 141, 4291–4299. [DOI] [PubMed] [Google Scholar]
- 9.Vargo KB, Parthasarathy R and Hammer DA, Proc. Natl. Acad. Sci, 2012, 109, 11657–11662. [DOI] [PMC free article] [PubMed] [Google Scholar]
- 10.Glassman MJ and Olsen BD, Macromolecules, 2015, 48, 1832–1842. [Google Scholar]
- 11.Harada A and Kataoka K, Macromolecules, 1995, 28, 5294–5299. [Google Scholar]
- 12.Itaka K, Yamauchi K, Harada A, Nakamura K, Kawaguchi H and Kataoka K, Biomaterials, 2003, 24, 4495–4506. [DOI] [PubMed] [Google Scholar]
- 13.Yin X and Stöver HDH, Macromolecules, 2003, 36, 8773–8779. [Google Scholar]
- 14.Kim J-M, Heo T-Y and Choi S-H, Macromolecules, 2020, 53, 9234–9243. [Google Scholar]
- 15.Kumar R, Le N, Tan Z, Brown ME, Jiang S and Reineke TM, ACS Nano, 2020, 14, 17626–17639. [DOI] [PubMed] [Google Scholar]
- 16.Raisin S, Morille M, Bony C, Noël D, Devoisselle J-M and Belamie E, Biomater. Sci, 2017, 5, 1910–1921. [DOI] [PubMed] [Google Scholar]
- 17.Kim BS, Chuanoi S, Suma T, Anraku Y, Hayashi K, Naito M, Kim HJ, Kwon IC, Miyata K, Kishimura A and Kataoka K, J. Am. Chem. Soc, 2019, 141, 3699–3709. [DOI] [PubMed] [Google Scholar]
- 18.Lee SH, Kim SH and Park TG, Biochem. Biophys. Res. Commun, 2007, 357, 511–516. [DOI] [PubMed] [Google Scholar]
- 19.Lee Y, Ishii T, Cabral H, Kim HJ, Seo J-H, Nishiyama N, Oshima H, Osada K and Kataoka K, Angew. Chem. Int. Ed, 2009, 48, 5309–5312. [DOI] [PubMed] [Google Scholar]
- 20.Kim A, Miura Y, Ishii T, Mutaf OF, Nishiyama N, Cabral H and Kataoka K, Biomacromolecules, 2016, 17, 446–453. [DOI] [PubMed] [Google Scholar]
- 21.Jin Q, Cai T, Wang Y, Wang H and Ji J, ACS Macro Lett, 2014, 3, 679–683. [DOI] [PubMed] [Google Scholar]
- 22.Shah S and Leon L, Curr. Opin. Colloid Interface Sci, 2021, 53, 101424. [Google Scholar]
- 23.Chen J, Wang K, Wu J, Tian H and Chen X, Bioconjug. Chem, 2019, 30, 338–349. [DOI] [PubMed] [Google Scholar]
- 24.Lankalapalli S and Kolapalli VRM, Indian J. Pharm. Sci, 2009, 71, 481–487. [DOI] [PMC free article] [PubMed] [Google Scholar]
- 25.Chuan D, Jin T, Fan R, Zhou L and Guo G, Adv. Colloid Interface Sci, 2019, 268, 25–38. [DOI] [PubMed] [Google Scholar]
- 26.Roy K, Mao HQ, Huang SK and Leong KW, Nat. Med, 1999, 5, 387–391. [DOI] [PubMed] [Google Scholar]
- 27.Cao Y, Tan YF, Wong YS, Liew MWJ and Venkatraman S, Mar. Drugs, 2019, 17, 381. [DOI] [PMC free article] [PubMed] [Google Scholar]
- 28.Catuogno S, Esposito CL, Condorelli G and de Franciscis V, Adv. Drug Deliv. Rev, 2018, 134, 79–93. [DOI] [PubMed] [Google Scholar]
- 29.Tan X, Jia F, Wang P and Zhang K, J. Controlled Release, 2020, 323, 240–252. [DOI] [PMC free article] [PubMed] [Google Scholar]
- 30.Oldfield CJ and Dunker AK, Annu. Rev. Biochem, 2014, 83, 553–584. [DOI] [PubMed] [Google Scholar]
- 31.Dzuricky M, Roberts S and Chilkoti A, Biochemistry, 2018, 57, 2405–2414. [DOI] [PMC free article] [PubMed] [Google Scholar]
- 32.Roberts S, Miao V, Costa S, Simon J, Kelly G, Shah T, Zauscher S and Chilkoti A, Nat. Commun, 2020, 11, 1342. [DOI] [PMC free article] [PubMed] [Google Scholar]
- 33.Posey AE, Holehouse AS and Pappu RV, in Methods in Enzymology, ed. Rhoades E, Academic Press, 2018, vol. 611, pp. 1–30. [DOI] [PubMed] [Google Scholar]
- 34.Yi S, Brickenden A and Choy W-Y, Protein Expr. Purif, 2008, 57, 1–8. [DOI] [PubMed] [Google Scholar]
- 35.Samara P, Ioannou K and Tsitsilonis OE, Vitam. Horm, 2016, 102, 179–207. [DOI] [PMC free article] [PubMed] [Google Scholar]
- 36.Enkemann SA, Wang R-H, Trumbore MW and Berger SL, J. Cell. Physiol, 2000, 182, 256–268. [DOI] [PubMed] [Google Scholar]
- 37.Kim YB, Zhao KT, Thompson DB and Liu DR, Nat. Commun, 2019, 10, 2905. [DOI] [PMC free article] [PubMed] [Google Scholar]
- 38.Saxena R and Nanjan MJ, Drug Deliv, 2015, 22, 156–167. [DOI] [PubMed] [Google Scholar]
- 39.Nettles DL, Chilkoti A and Setton LA, Adv. Drug Deliv. Rev, 2010, 62, 1479–1485. [DOI] [PMC free article] [PubMed] [Google Scholar]
- 40.Rodríguez-Cabello JC, Arias FJ, Rodrigo MA and Girotti A, Adv. Drug Deliv. Rev, 2016, 97, 85–100. [DOI] [PubMed] [Google Scholar]
- 41.Hassouneh W, Zhulina EB, Chilkoti A and Rubinstein M, Macromolecules, 2015, 48, 4183–4195. [DOI] [PMC free article] [PubMed] [Google Scholar]
- 42.Weitzhandler I, Dzuricky M, Hoffmann I, Garcia Quiroz F, Gradzielski M and Chilkoti A, Biomacromolecules, 2017, 18, 2419–2426. [DOI] [PMC free article] [PubMed] [Google Scholar]
- 43.Lawrence MS, Phillips KJ and Liu DR, J. Am. Chem. Soc, 2007, 129, 10110–10112. [DOI] [PMC free article] [PubMed] [Google Scholar]
- 44.Hatos A, Hajdu-Soltész B, Monzon AM, Palopoli N, Álvarez L, Aykac-Fas B, Bassot C, Benítez GI, Bevilacqua M, Chasapi A, Chemes L, Davey NE, Davidović R, Dunker AK, Elofsson A, Gobeill J, Foutel NSG, Sudha G, Guharoy M, Horvath T, Iglesias V, Kajava AV, Kovacs OP, Lamb J, Lambrughi M, Lazar T, Leclercq JY, Leonardi E, Macedo-Ribeiro S, Macossay-Castillo M, Maiani E, Manso JA, Marino-Buslje C, Martínez-Pérez E, Mészáros B, Mičetić I, Minervini G, Murvai N, Necci M, Ouzounis CA, Pajkos M, Paladin L, Pancsa R, Papaleo E, Parisi G, Pasche E, Barbosa Pereira PJ, Promponas VJ, Pujols J, Quaglia F, Ruch P, Salvatore M, Schad E, Szabo B, Szaniszló T, Tamana S, Tantos A, Veljkovic N, Ventura S, Vranken W, Dosztányi Z, Tompa P, Tosatto SCE and Piovesan D, Nucleic Acids Res., 2020, 48, D269–D276. [DOI] [PMC free article] [PubMed] [Google Scholar]
- 45.Sickmeier M, Hamilton JA, LeGall T, Vacic V, Cortese MS, Tantos A, Szabo B, Tompa P, Chen J, Uversky VN, Obradovic Z and Dunker AK, Nucleic Acids Res., 2007, 35, D786–D793. [DOI] [PMC free article] [PubMed] [Google Scholar]
- 46.Tang NC and Chilkoti A, Nat. Mater, 2016, 15, 419–424. [DOI] [PMC free article] [PubMed] [Google Scholar]
- 47.Reguera J, Urry DW, Parker TM, McPherson DT and Rodríguez-Cabello JC, Biomacromolecules, 2007, 8, 354–358. [DOI] [PubMed] [Google Scholar]
- 48.Samaridou E, Heyes J and Lutwyche P, Adv. Drug Deliv. Rev, 2020, 154–155, 37–63. [DOI] [PubMed] [Google Scholar]
- 49.Kon E, Elia U and Peer D, Curr. Opin. Biotechnol, 2022, 73, 329–336. [DOI] [PMC free article] [PubMed] [Google Scholar]
- 50.Akinc A, Goldberg M, Qin J, Dorkin JR, Gamba-Vitalo C, Maier M, Jayaprakash KN, Jayaraman M, Rajeev KG, Manoharan M, Koteliansky V, Röhl I, Leshchiner ES, Langer R and Anderson DG, Mol. Ther, 2009, 17, 872–879. [DOI] [PMC free article] [PubMed] [Google Scholar]
- 51.Basha G, Novobrantseva TI, Rosin N, Tam YYC, Hafez IM, Wong MK, Sugo T, Ruda VM, Qin J, Klebanov B, Ciufolini M, Akinc A, Tam YK, Hope MJ and Cullis PR, Mol. Ther, 2011, 19, 2186–2200. [DOI] [PMC free article] [PubMed] [Google Scholar]
Associated Data
This section collects any data citations, data availability statements, or supplementary materials included in this article.