

Abstract
Objectives:
Cochlear implants (CIs) restore speech perception in quiet but they also eliminate or distort many acoustic cues that are important for music enjoyment. Unfortunately, quantifying music enjoyment by CI users has been difficult because comparisons must rely on their recollection of music before they lost their hearing. Here, we aimed to assess music enjoyment in CI users using a readily interpretable reference based on acoustic hearing. The comparison was done by testing “single-sided deafness” (SSD) patients who have normal hearing (NH) in one ear and a CI in the other ear. The study also aimed to assess binaural musical enjoyment, with the reference being the experience of hearing with a single NH ear. Three experiments assessed the effect of adding different kinds of input to the second ear: electrical, vocoded, or unmodified.
Design:
In experiment 1, music enjoyment in SSD-CI users was investigated using a modified version of the MUSHRA (MUltiple Stimuli with Hidden Reference and Anchor) method. Listeners rated their enjoyment of song segments on a scale of 0 to 200, where 100 represented the enjoyment obtained from a song segment presented to the NH ear, 0 represented a highly degraded version of the same song segment presented to the same ear, and 200 represented enjoyment subjectively rated as twice as good as the 100 reference. Stimuli consisted of acoustic only, electric only, acoustic and electric, as well as other conditions with low pass filtered acoustic stimuli. Acoustic stimulation was provided by headphone to the NH ear and electric stimulation was provided by direct audio input to the subject’s speech processor. In experiment 2, the task was repeated using NH listeners who received vocoded stimuli instead of electric stimuli. Experiment 3 tested the effect of adding the same unmodified song segment to the second ear, also in NH listeners.
Results:
Music presented through the CI only was very unpleasant, with an average rating of 20. Surprisingly, the combination of the unpleasant CI signal in one ear with acoustic stimulation in the other ear was rated more enjoyable (mean = 123) than acoustic processing alone. Presentation of the same monaural musical signal to both ears in NH listeners resulted with even greater enhancement of the experience compared with presentation to a single ear (mean = 159). Repeating the experiment using a vocoder to one ear of NH listeners resulted in interference rather than enhancement.
Conclusions:
Music enjoyment from electric stimulation is extremely poor relative to a readily interpretable NH baseline for CI-SSD listeners. However, the combination of this unenjoyable signal presented through a CI and an unmodified acoustic signal presented to a NH (or near-NH) contralateral ear results in enhanced music enjoyment with respect to the acoustic signal alone. Remarkably, this two-ear enhancement experienced by CI-SSD listeners represents a substantial fraction of the two-ear enhancement seen in NH listeners. This unexpected benefit of electroacoustic auditory stimulation will have to be considered in theoretical accounts of music enjoyment and may facilitate the quest to enhance music enjoyment in CI users.
Keywords: Acoustic electric integration, Cochlear implants, Music, Single-sided deafness
INTRODUCTION
Cochlear implants (CIs) provide hearing to profoundly deafened individuals. Typical CI users can comfortably understand conversations in quiet environments and many can successfully communicate over the telephone. CIs have significantly enhanced self-reported quality of life for their users (Mertens et al. 2013). Nevertheless, despite this improvement, many CI users generally do not report music as being enjoyable. For example, Leal et al. (2003) found that only 21% of 29 surveyed CI users enjoyed listening to music. In a careful review of the published literature on music perception by CI users, Jiam et al. (2017) pointed out that “music is frequently perceived as out-of-tune, dissonant, indistinct, emotionless, and weak in bass frequencies, especially for postlingual cochlear implant users.”
The limited musical enjoyment with a CI is not surprising given the poor abilities of CI users on pitch-related tasks. For example, Looi et al. (2007) found that when CI users were asked to determine which of two notes spaced three semitones apart was higher in pitch, performance was only at chance level. Galvin et al. (2008) found that CI users were significantly worse than normal-hearing (NH) listeners on a melodic contour identification task. Similarly, timbre perception with a CI is poor. CI users have much more difficulty than NH listeners in identifying individual instruments (Gfeller et al. 2002; McDermott 2004; Nimmons et al. 2008). When the instrument is presented against the backdrop of other instruments, the discrepancy between NH and CI users in instrument identification increases (Looi et al. 2008). In contrast with the difficulties they show in pitch- or timbre-related tasks, it is worth noting that CI users perform similarly to NH listeners on basic rhythm perception tasks (Gfeller et al. 1997; Leal et al. 2003; Kong et al. 2004), or just moderately worse than NH listeners in more complicated rhythmic pattern identifications (Kong et al. 2004).
Poor performance on pitch and timbre-related tasks with a CI are unsurprising given the way CIs distort pitch. Although exactly how the auditory system encodes pitch is unknown, both stimulation rate and place of stimulation in the cochlea affect pitch perception in CI users (Eddington et al. 1978; Shannon 1983; Landsberger et al. 2016). Nevertheless, both spectral and temporal pitch cues are distorted and limited with a CI.
Most CI users have difficulty discriminating stimulation rates beyond approximately 300 Hz (Eddington et al. 1978a; Shannon et al. 1983; Tong et al. 1983; Landsberger & McKay 2005) although there have been a few notable exceptions (Townshend et al. 1987; Kong & Carlyon 2010). This inherently limits temporal coding of pitch with a CI to frequencies below 300 Hz. Most CI sound coding strategies (e.g., continuous interleaved sampling (CIS) or advanced combination encoder (ACE))encode envelopes for each channel with amplitude modulations, discarding fine temporal information. Other sound coding strategies (e.g., FSP, FS4, FS4p; Riss et al. 2014) attempt to preserve the fine structure information at low frequencies by presenting stimulation pulses at the zero-crossings of the corresponding low-frequency filters, but it is not clear how much of this information is actually perceived by CI users.
Spectral information encoded as place of stimulation in the cochlea is also distorted with a CI. There is an inherent mismatch between the frequency expected by the spiral ganglion at a given cochlear location (Stakhovskaya et al. 2007) and the frequency associated to that location by a CI (Landsberger et al. 2015). Furthermore, the richness of spectral information provided by acoustic hearing is coarsely represented by only a limited number of electrodes (typically 12 to 22) within the cochlea. The harmonics of a periodic sound are faithfully represented in the spectrogram of the corresponding acoustic waveform and can be resolved by NH listeners, but they blur together and overlap each other in the stimulation pattern generated by a CI, due to the device’s limited resolution (see Fig. 4 in Svirsky 2017). Studies show that speech perception is only minimally affected (if at all) when only about eight of the electrodes in the implanted array are used (Fishman et al. 1997; Friesen et al. 2001). This may happen because of the broad spread of excitation from monopolar stimulation (Landsberger et al. 2012; Srinivasan et al. 2012) that is typically used in clinical maps. Furthermore, spectral representation in CI users is likely to be further degraded by inhomogeneous neural survival (Goldwyn et al. 2010). Consequently, many CI users may not have full access to the already-degraded information that is encoded in the electrical stimulation patterns they receive (Padilla & Landsberger 2016).
FIG. 4.

Results for experiment 2 with NH participants listening to unprocessed audio to the left ear and vocoded audio to the right ear. The left panel indicates results for “Ring of Fire” while the right panel indicates results for “Rhapsody in Blue.” The sets of bars are organized based on the low-pass filter (250, 500, 1000 Hz, or no low-pass filter) provided to the left (nonvocoded) ear. Black bars indicate ratings to the vocoded ear alone, red bars indicate ratings to the nonvocoded ear alone, green bars indicate ratings when nonvocoded and full bandwidth vocoded stimulation is provided, and yellow bars indicate ratings when cutoff frequencies for the low-pass acoustic and high-pass electric stimuli are the same. Error bars indicate ±1 SE of the mean. MUSHRA indicates MUltiple Stimuli with Hidden Reference and Anchor; NH, normal hearing.
Given the distortions from a CI in pitch and frequency information, it is not surprising that listening to music through an implant is often not enjoyable. Nevertheless, it has been difficult to quantify music enjoyment through a CI using a simple, readily interpretable scale. For example, if a person is asked to rate the enjoyment derived from listening to a piece of music on a scale from 1 to 10, this rating cannot be used to compare their enjoyment to that obtained by other people, let alone comparing CI users and NH listeners. The main reason for the limitation is that the internal scale of each rater is unknown. For example, if one CI user rates enjoyment of a song as a 6 and another CI user rates the song as a 4, it could be that enjoyment is higher for the listener rating it a 6. Alternatively, it could be that the listener rating the song as a 6 is more optimistic, a less critical listener, or simply has poorer recollection of his/her enjoyment of the song from when he/she had acoustic hearing. Similarly, enjoyment of music may depend more on familiarity with song or taste of the listener than the sound quality of the sample. While directly comparing enjoyment ratings across subjects may not be of benefit, this method is still useful to compare preferences within subjects. For example, Gfeller et al. (2003) asked CI users to compare enjoyment of different musical genres. Similarly, Looi et al. (2007) asked subjects to scale how pleasant songs sounded before (with a hearing aid) and after implantation. What these studies have not done, however, is to provide a quantitative assessment of music enjoyment referenced to a readily interpretable NH baseline.
A new opportunity has presented itself with the emergence of a small population of CI users who have an audiologically NH or near-NH ear on the contralateral side (Van de Heyning et al. 2008; Vermeire et al. 2008). These subjects, known as single-sided deafened (SSD) CI users, have the unique ability to compare acoustic sound presented to a NH or near-NH ear with the electric sound provided to a CI. For example, comparing basic acoustic to electric stimulation in this population has demonstrated that the perceptual quality related to a change in place of stimulation in a CI can be described by the same perceptual dimension as a change in pure-tone frequency presented to an acoustic-hearing ear (Vermeire et al. 2013).
SSD is known to affect enjoyment of listening to music. After suddenly losing hearing in one ear, Dr. Jorgen Jorgensen suggests that his “emotional reception of music was impaired [and that] it was curiously flat and two-dimensional” (Sacks 2007). Perhaps it is this sensation that causes listening to music with only one ear to be more unnatural, unpleasant, and indistinct than when listening with two NH ears (Meehan et al. 2017). Therefore, it is plausible that partially restoring the deafened ear via implantation for SSD subjects may improve music enjoyment as music can then be presented simultaneously to both ears. Alternatively, the musical enjoyment obtained from listening with one good acoustic-hearing ear might be reduced when it is combined with the sharply degraded musical signal provided by a CI. Using a scaling paradigm with reference points in the acoustic-hearing ear alone, we can now ask the questions “how much musical enjoyment is obtained from a CI ear compared with signals presented to a single NH ear?” and “how does simultaneous listening with a CI and a NH ear affect music enjoyment, compared with listening with a single NH ear alone?”
In the first experiment, we asked SSD-CI users to rate enjoyment of music on a scale using two fixed points obtained by presenting song segments only to the acoustic-hearing ear. The “100” level in the scale (the “reference” stimulus) corresponds to the unprocessed song segment, and the 0 in the scale (the “anchor” stimulus) corresponds to the same song segment processed with a 6-channel noise-band vocoder where the analysis filters and the noise bands are shifted by an amount equivalent to a displacement of 6.5 mm in the cochlea. We expect enjoyment of music presented to the CI alone to be worse than unprocessed music presented to the NH ear, but better than the low-quality vocoded sample (also delivered to the acoustic-hearing ear). It is important to note that the scale allows for ratings up to 200 (defined as twice as enjoyable as the reference sound) to avoid ceiling effects in listening conditions that might be more enjoyable than the single NH ear reference. This paradigm allows the rating of music enjoyment through a CI using a scale that is presumably similar across all subjects as it is defined by acoustic stimulation to a NH ear. An additional benefit of this approach is that enjoyment of music with a CI can be directly compared with enjoyment of the same piece using normal acoustic hearing, albeit with a single ear. This paradigm makes the data easy to interpret for NH listeners: they can get a sense of what “100” and “0” mean simply by listening to the reference and the anchor stimuli, respectively, using a single ear (these stimuli are provided as Supplemental Digital Content, http://links.lww.com/EANDH/A558). The same paradigm was used in a second experiment that was conducted with NH subjects simulating an SSD-CI experience, by substituting the input to one ear with the output of a noise vocoder. A third experiment was designed to measure the two-ear benefit in music enjoyment in NH subjects hearing an unmodified musical signal in both ears.
These experiments use a modified version of the MUSHRA (MUltiple Stimuli with Hidden Reference and Anchor test) (ITU-R.Recommendation.BS.1534-1, 2003—International Telecommunication Union 2003) to measure musical enjoyment when listening with a CI alone or when acoustic and electric stimuli are combined for SSD-CI users. This approach has been pioneered by Roy et al. (2012, 2015) in the study of music perception by CI users. Roy et al.’s choices for a reference stimulus and anchor stimulus were different from those in the ITU-R recommendation and also differed across studies, while keeping the rating scale (with a 100 maximum) the same as in the standard. In the present study, we used the same reference and anchor stimuli across all three experiments, and our anchor stimulus was different from the standard as well as from the various anchor stimuli used by Roy et al. One important difference in the present study, both with respect to the Roy et al. studies and to the standard, is that we extended the rating scale to a maximum of 200 thus making it possible to measure enjoyment for stimuli that are even more enjoyable than the reference stimulus. This allows for the evaluation of potential two-ear enhancement in music enjoyment, with respect to that experienced with a single NH ear. The use of SSD patients in this study gave us the opportunity to obtain music enjoyment ratings using a readily interpretable scale that is based on music perception by an acoustic-hearing ear.
GENERAL METHODS
In each of the three experiments in this article, a modified MUSHRA protocol was used to evaluate listening enjoyment to music in various conditions relative to a single audiometrically NH (or near-NH) ear. The three experiments differed only in the stimulus set evaluated and the populations that participated in each study.
Subjects
Subjects in experiment 1 were SSD-CI users: they had NH or a mild-hearing loss with a pure-tone average for 0.5, 1, and 2 kHz ranging from 1.67 to 30 dB HL in 1 ear and a CI in the contralateral ear. The average age for SSD-CI users in experiment 1 was 57 years (range: 29 to 68 years). Subjects in experiments 2 and 3 had bilateral NH (defined as being able to detect a tone at 25 dB HL at 0.25, 0.5, 1, 2, 4, 6, and 8 kHz). The average age for NH subjects in experiment 2 was 28 years (range: 21 to 37 years). The average age for NH subjects in experiment 3 was 27 years (range: 22 to 36 years). All subjects were tested in their native language, which was Flemish in Belgium and English in the United States. All subjects provided informed consent in accordance with the IRB regulations for either the University Hospital of Antwerp or New York University School of Medicine.
Stimuli
Stimuli consisted of monaural (i.e., nonstereo) song segments of “Ring of Fire” by Johnny Cash or “Rhapsody in Blue” by George Gershwin. “Ring of Fire” was selected as it might be relatively accessible to CI listeners as the music is relatively uncomplicated and dominated by clear vocals and a simple rhythm. “Rhapsody in Blue” was selected as it might be relatively inaccessible to CI listeners as there are no vocals or clear rhythm for them to latch onto. The stimuli were presented either over headphones (Sony MDR-7506 Tokyo, Japan) to an acoustic-hearing ear, via a direct audio input cable to a CI sound processor, or both. All stimuli were presented via an external sound card (Tascam US-322 Montebello, California). Stimuli included unmodified song segments, low or high pass filtered versions of those song segments, and vocoded versions of the song segments which were intended to simulate CI signal processing for presentation to an acoustic-hearing ear. A vocoder is a signal processing algorithm that filters the input using a bank of filters, and the envelope of each filter is used to modulate the amplitude of a carrier signal (these are usually tones or noise bands). The filters used to generate noise bands are called “carrier filters.” In each experiment, the reference stimulus consisted of the unprocessed song segment played to one acoustic-hearing ear while nothing was played to the contralateral ear. An anchor stimulus was provided in each experiment consisting of a 6-channel noise-vocoded version of the two song segments with a simulated 6.5 mm shift that was generated using AngelSim software (http://angelsim.emilyfufoundation.org/). A 6.5 mm shift was chosen as this simulates the deviation in placement of the most apical electrode of a Contour Advance array and the average placement that would be required to stimulate the region of the spiral ganglion at the frequencies represented by this electrode (Landsberger et al. 2015). The vocoding parameters were modified from the AngelSim preset “8-channel shallow insertion depth (20 mm).” Specifically, the number of channels was reduced to 6, the carrier type was white noise, analysis filter range between 200 and 7000 Hz with a 24 dB/octave filter slope, and a carrier filter range between 727 and 19,218 Hz with a 6 dB/octave filter slope. These parameters result in all frequencies being shifted between 17 and 23 semitones. Envelope detection for each channel was performed with a low-pass filter at 400 Hz. The anchor stimulus was provided as a negative control of sorts, to anchor the low end of the response range to a very degraded and likely unenjoyable stimulus. At the same time, because it was a purely acoustic stimulus (no stimulation is presented to the CI ear), it provided a reference that can be readily interpreted by NH listeners. Specific stimuli used in each experiment will be discussed in the corresponding methods sections. Note that the source audio for both ears was identical, allowing for potential two-ear benefit but no stereo information. A subset of the stimuli is provided in Supplemental Digital Content (http://links.lww.com/EANDH/A558) as described in Table 1.
TABLE 1.
A list of all supplemental audio files
| Supplemental Audio File Number | Song | Description | Exp 1 Stimulus No. | Exp 2 Stimulus No. | Exp 3 Stimulus No. | Note |
|---|---|---|---|---|---|---|
| 1 | Ring of Fire | Reference | 1 | 1 | 1 | — |
| 2 | Ring of Fire | Anchor | 13 | 13 | 7 | — |
| 3 | Ring of Fire | Bilateral | 3 | N/A | 3 | Right channel to CI in experiment 1 |
| Right channel to NH ear in experiment 3 | ||||||
| 4 | Rhapsody in Blue | Reference | 1 | 1 | 1 | — |
| 5 | Rhapsody in Blue | Anchor | 13 | 13 | 7 | — |
| 6 | Rhapsody in Blue | Bilateral | 3 | N/A | 3 | Right channel to CI in experiment 1 |
| Right channel to NH ear in experiment 3 |
CI, cochlear implant; NH, normal hearing.
Procedure
Before beginning each experiment, subjects were familiarized with the stimuli. A screen with a series of buttons on it (one for each stimulus in the experiment) was presented and the subjects were instructed to click on each button, one at a time, to familiarize themselves with the range of sounds that would be presented in the experiment. Once this stage was completed, the main experiment was ready to begin.
The main experiment consisted of measuring enjoyment during music listening using a modified MUSHRA test. An open source interface (MUSHRAM; Vincent 2005) was modified to fit our experimental design. This interface is displayed in Figure 1. Subjects were presented with a reference sound which consisted of one of the songs presented unmodified over headphones only to the acoustic-hearing ear (i.e., stimulus 1 from Table 3). Subjects were instructed that their enjoyment of the reference should be scaled to 100 and each of the other stimuli should be rated on a scale from 0 to 200 such that 0 corresponded to “Bad” and 200 corresponded to “Twice as Good” as the reference stimulus. Within a block, subjects were also presented with each of the additional stimuli and were asked to indicate “How much do you enjoy listening in this condition relative to the reference?” by moving a slider. The value of the slider was visible to the subject. The most important modification to the standard MUSHRA procedure was that the scale was expanded from 100 (as enjoyable as the reference) to 200 (twice as enjoyable as the reference), thus allowing listeners to rate a given segment as more enjoyable than the reference. The standard procedure is normally used to evaluate the perceived (subjective) quality of the output from lossy audio compression algorithms. In that context, ratings above 100 are not allowed because they are not meaningful: lossy compression algorithms are not expected to improve the quality of the original sound. In contrast, it was important for us to allow the possibility that a given song segment (perhaps presented binaurally) might be more enjoyable than the single-ear reference, and thus the scale range was modified from 0 to 200. Subjects were free to play any of the sounds (including the reference) multiple times in any order to allow them to make well-informed comparisons between stimuli.
FIG. 1.

Response screen used for all three experiments. The interface is modified from the MUSHRAM interface (Vincent 2005) in that it allows responses above “like reference.”
TABLE 3.
A list of stimuli used in experiment 1
| Stimulus No. | Acoustic Ear | Electric Ear | Set A | Set B | Description |
|---|---|---|---|---|---|
| 1 | Full bandwidth | — | x | x | Normal hearing ear only |
| 2 | — | Full bandwidth | x | x | Electric ear only |
| 3 | Full bandwidth | Full bandwidth | x | x | Acoustic and electric |
| 4 | Low-pass filter: 250 Hz | — | x | — | Hearing loss simulation |
| 5 | Low-pass filter: 500 Hz | — | x | — | Hearing loss simulation |
| 6 | Low-pass filter: 1000 Hz | — | x | — | Hearing loss simulation |
| 7 | Low-pass filter: 250 Hz | Full bandwidth | x | x | Bimodal user simulation |
| 8 | Low-pass filter: 500 Hz | Full bandwidth | x | x | Bimodal user simulation |
| 9 | Low-pass filter: 1000 Hz | Full bandwidth | x | x | Bimodal user simulation |
| 10 | Low-pass filter: 250 Hz | High-pass filter: 250 Hz | — | x | Bimodal simulation without overlapping frequencies |
| 11 | Low-pass filter: 500 Hz | High-pass filter: 500 Hz | — | x | Bimodal simulation without overlapping frequencies |
| 12 | Low-pass filter: 1000 Hz | High-pass filter: 1000 Hz | — | x | Bimodal simulation without overlapping frequencies |
| 13 | 6-channel noise vocoder with 6.5 mm shift | — | x | x | Low quality anchor stimulus which presumably sounds worse than all other stimuli |
The sounds presented on a MUSHRAM response screen were organized into blocks. The order of blocks as well as the order of the sounds within each of the blocks were randomized. Note that the reference stimulus is always included as one of the stimuli in each block. This “hidden reference” is effectively a catch stimulus which should be rated approximately 100 as it is physically identical to the reference stimulus. The procedure is repeated until all blocks of stimuli are rated 10 times. Testing typically took between 2 and 4 hours per subject.
For each subject and stimulus, the 80% trimmed mean was calculated. As the hidden reference (music played only to the acoustic-hearing ear) was physically identical to the reference which was defined as an enjoyment level of 100, we made the a priori decision that any subjects who did not scale the hidden reference stimulus to be between 90 and 110 would be considered to not be able to do the task appropriately and their data would be excluded from analysis. For the remaining subjects, the ratings for each stimulus were normalized (linearly rescaled) for each song, for each subject, so that the reference was exactly 100 and the anchor was 0. Normalization was completed using the following equation where score is the value being rescaled, anchor is the averaged scaled value for the anchor stimulus, ref is the averaged scaled value for the reference stimulus, and normalized score is the rescaled score.
EXPERIMENT NO. 1: COMPARING AN ACOUSTIC-HEARING EAR TO A COCHLEAR-IMPLANTED EAR
Methods
Subjects •
Twelve subjects with NH (or near-NH) in one ear and a CI in the contralateral ear participated in this experiment. Eight subjects, indicated by the letters “UZA” in their subject codes, were tested at the University Hospital Antwerp in Antwerp, Belgium. Four additional subjects, indicated by the letters “NYU” in their subject codes, were tested at the New York University School of Medicine in New York City. Implantation of a person with a contralateral near-NH ear has CE Mark approval for implantation in Belgium. However, as of this writing, the Food and Drug Administration (FDA) has only approved implantation of this population with MED-EL devices in the United States. The specific subject demographics are presented in Table 2. Ten of the 12 subjects had normal pure-tone averages (500 Hz, 1 kHz, and 2 kHz) and the other two showed a mild hearing loss (PTA of 23 dB in one case and 30 dB in the other). At higher frequencies (4 kHz and above), half of the subjects maintained no more than a mild hearing loss, whereas the other half showed a moderate hearing loss at one or more frequencies. Unaided audiograms for the acoustic-hearing ear of all subjects are shown in Figure 2.
TABLE 2.
Subject demographics for experiment 1
| Subject Code | Gender | Implanted Ear | Age at HL Onset (Years) | Etiology | Age at Implantation (Years) | Type of Implant | Strategy | Active Electrodes | Stimulation Rate (pps) | Age at Testing | Duration of CI Experience (Years) | Duration of Deafness (Years) |
|---|---|---|---|---|---|---|---|---|---|---|---|---|
| NYU-SSD-N1 | M | Right | 61 | Unknown | 62 | CI512 | ACE | 22 | 900 | 67 | 4.67 | 1 |
| NYU-SSD-N2 | F | Left | 27 | Ideopathic/SSD | 27 | CI24RE | ACE | 20 | 900 | 29 | 2 | 1 |
| NYU-SSD-N3 | M | Right | 61 | Ideopathic/SSD | 62 | CI24RE | ACE | 22 | 900 | 63 | 0.87 | 2 |
| NYU-SSD-N4 | M | Left | 65 | Unknown | 65 | CI24RE | ACE | 22 | 900 | 67 | 1.92 | 1 |
| UZA-SSD-M3 | M | Right | 21 | Viral | 22 | Pulsar FlexSOFT | FS4 | 12 | 750 | 32 | 9.91 | 2 |
| UZA-SSD-M7 | F | Left | 37 | Bacterial labyrintitis | 38 | Combi40+ M | FS4 | 12 | 1681 | 48 | 10.64 | 2 |
| UZA-SSD-M11 | F | Left | 58 | Menière | 59 | Pulsar FlexSOFT | FS4 | 12 | 750 | 68 | 9.45 | 5 |
| UZA-SSD-M12 | F | Right | Unknown | Menière | 61 | Sonata FlexSOFT | FS4 | 12 | 750 | 66 | 4.73 | 7 |
| UZA-SSD-M13 | M | Right | 33 | Trauma | 34 | Combi40+ M | FS4 | 12 | 1442 | 46 | 10.83 | 8 |
| UZA-SSD-M14 | M | Left | 61 | Unknown | 63 | Sonata FlexSOFT | FS4 | 12 | 1653 | 67 | 4.62 | 2 |
| UZA-SSD-M15 | M | Right | 49 | Trauma | 55 | Pulsar FlexSOFT | FS4 | 10 | 938 | 64 | 9.54 | 6 |
| UZA-SSD-M16 | F | Left | 44 | Unknown | 59 | Pulsar FlexSOFT | FS4 | 12 | 1500 | 67 | 8.61 | 3 |
FIG. 2.
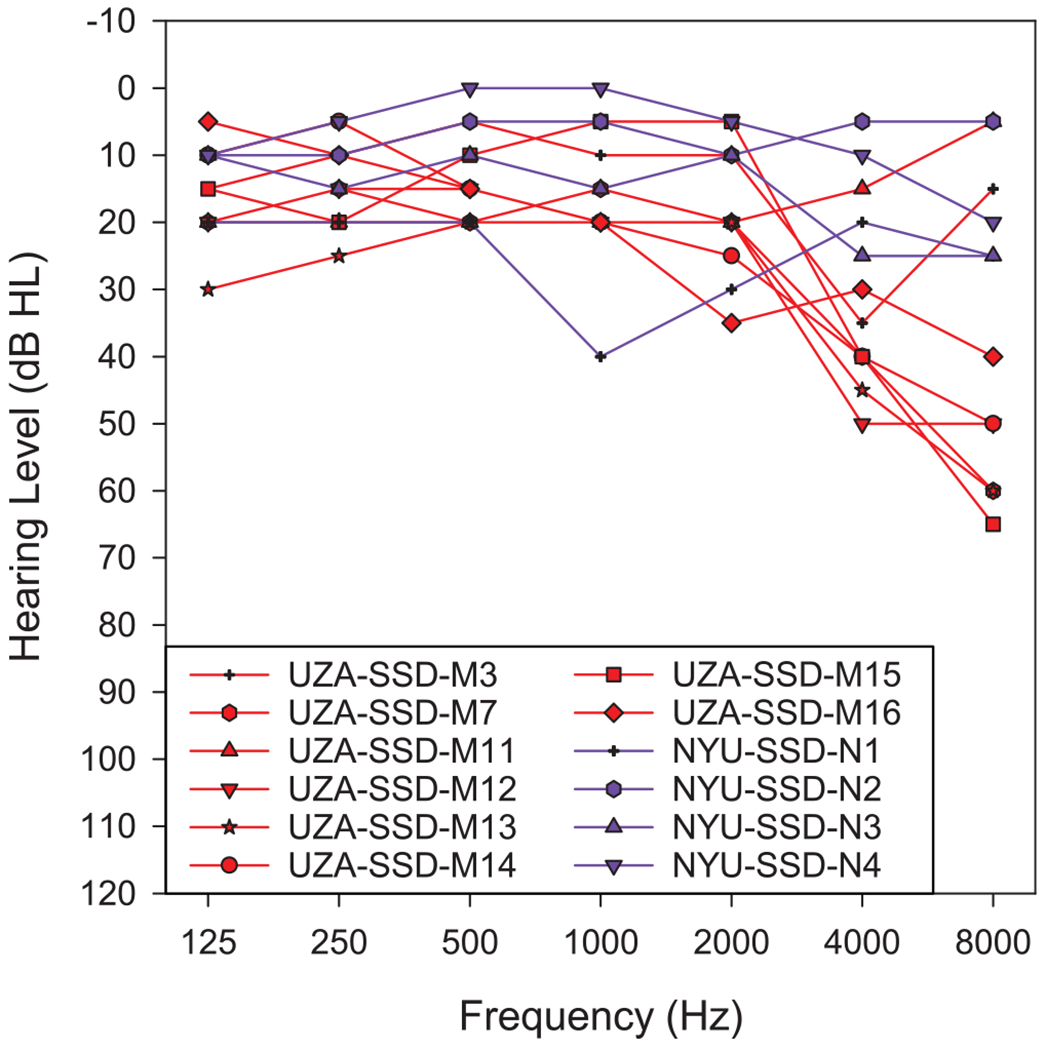
Audiogram acoustic ear.
Stimuli •
A total of 13 stimuli for both “Ring of Fire” and “Rhapsody in Blue” were used in experiment no. 1. Each of the stimuli are described in Table 3. Stimulus 1 consisted of the unprocessed reference stimulus presented to the acoustic-hearing ear. Stimuli 2 and 3 consisted of the unaltered audio played to the CI alone (stimulus 2) or to both ears (stimulus 3). Stimuli 4 to 6 coarsely simulated a hearing loss in the NH ear by providing low pass filtered stimulation to that ear. Stimuli 7 to 9 simulated the experience of a person who has a CI in one ear and different degrees of hearing impairment in the other ear (i.e., a “bimodal” patient), by providing low pass filtered stimulation to the acoustic-hearing ear and the unprocessed song to the CI. Stimuli 10 to 12 differed from 7 to 9 in that the stimuli presented to the implanted ear were high pass filtered such that the high-pass cutoff frequency for the electric ear coincides with the low-pass cutoff frequency for the acoustic ear. This was done to prevent frequencies presented to the acoustic-hearing ear from also being represented in the electric ear. Stimulus 13 was the 6-channel noise-vocoded anchor stimulus.
Procedure •
Before beginning the experiment, subjects adjusted the volume of the song segments played over the headphones to the acoustic-hearing ear and directly to the CI processor such that the sounds were equally loud at a most comfortable level. This was accomplished by having the subject adjust the volume of each using separate knobs on the external sound card connected to a PC while a short (4.5 sec) segment of the unprocessed version of “Ring of Fire” was repeated played in a loop first in the acoustic-hearing ear only and then in the electric ear only.
The main experiment was conducted using the MUSHRA protocol described in the general procedures section. The stimuli were organized into four blocks of 10 stimuli consisting of set A or set B (Table 3) for each song segment. One run consisted of all four blocks (2 sets × 2 song segments). A total of 10 runs were collected per subject. Note that some stimuli are represented only in either set A or set B while other stimuli are in both set A and set B. Therefore, there were 10 data points collected for stimuli that appeared only in set A or set B and 20 data points for stimuli that appeared in both sets.
Results
The anchor stimulus was the stimulus rated as the lowest for all stimuli for all subjects. All anchor stimulus ratings were below 2.5 except for NYU-SSD-02 listening to “Ring of Fire” who rated the anchor stimulus at 14.6. The data were normalized as described in the General Methods. Only one subject (NYU-SSD-04) was excluded from the following analyses due to his failure to scale stimulus 1 (which was physically identical to the reference) between 90 and 110.
A summary of the data is presented in Figure 3. Each of the two panels represent a song segment (“Ring of Fire” on the left and “Rhapsody in Blue” on the right). Data are organized along the horizontal axis by the degree of low-pass frequency cutoff used for the stimuli presented to the acoustic-hearing ear. Red bars (stimuli 1, 4, 5, and 6) indicate ratings for the music presented only to the acoustic-hearing ear, black bars (stimulus 2) indicate ratings for the music presented only to the electric ear, and green bars indicate ratings for music presented to both the acoustic and electric ear (stimuli 3, 7, 8, and 9), and yellow bars indicate ratings for music presented to both ears such that the frequency ranges of the acoustic and electric stimuli do not overlap (stimuli 10, 11, 12). Note that ratings for the electric ear alone (black bars; stimulus 2) are replotted with each of the acoustic filtering conditions in Figure 3. That is, the four black bars in each panel represent the same data.
FIG. 3.

Results for experiment 1 with SSD listeners using a CI. The left panel indicates results for “Ring of Fire” while the right panel indicates results for “Rhapsody in Blue.” The sets of bars are organized based on the low-pass filter (250, 500, 1000 Hz, or no low-pass filter) provided to the acoustic-hearing ear. Black bars indicate ratings to the electric ear alone, red bars indicate ratings to the acoustic-hearing ear alone, green bars indicate ratings when acoustic and a full bandwidth electric stimulation is provided, and yellow bars indicate ratings when cutoff frequencies for the low-pass acoustic and high-pass electric stimuli are the same. Error bars indicate ±1 SE of the mean. CI indicates cochlear implant; MUSHRA, MUltiple Stimuli with Hidden Reference and Anchor; SSD, single-sided deafness.
Ratings for the full bandwidth combination were higher than ratings for the acoustic reference alone: 131 for “Ring of Fire” (range 89 to 187) and 115 for “Rhapsody in Blue” (range 86 to 164). A two-way repeated-measures analysis of variance (ANOVA) (ANOVA 1.1, Table 4) found a main effect of the difference between acoustic alone (stimulus 1) and the combination of acoustic and electric stimulation (stimulus 3). In addition, there were significant effects of song segment and song segment/condition interaction. In other words, the two-ear enhancement in music enjoyment when adding the CI to the acoustic-hearing ear was significantly more pronounced for “Ring of Fire” than for “Rhapsody in Blue.”
TABLE 4.
Summary of statistical analyses for experiment 1
| Experiment 1 | ||||
|---|---|---|---|---|
|
| ||||
| ANOVA 1.1: Factors: Condition (Full Bandwidth Acoustic vs. Full Bandwidth Acoustic and Electric), Song Segment | ||||
|
| ||||
| Factor | df Num | df Denom | F | p |
| Factor 1: Condition | 1 | 10 | 7.942 | 0.018 |
| Factor 2: Song Segment | 1 | 10 | 14.289 | 0.004 |
| Interaction | 1 | 10 | 14.289 | 0.004 |
| ANOVA 1.2: Factors: Condition (Electric Only vs. Anchor Only), Song Segment | ||||
|
| ||||
| Factor | df Num | df Denom | F | p |
|
| ||||
| Factor 1: Condition | 1 | 10 | 52.382 | <0.001 |
| Factor 2: Song Segment | 1 | 10 | 5.803 | 0.037 |
| Interaction | 1 | 10 | 5.803 | 0.037 |
| ANOVA 1.3: Factors: Condition (Acoustic vs. Acoustic and Electric), Song Segment, Low-Frequency Cutoff | ||||
|
| ||||
| Factor | df Num | df Denom | F | p |
|
| ||||
| Factor 1: Condition | 1 | 10 | 8.072 | 0.018 |
| Factor 2: Song Segment | 1 | 10 | 0.353 | 0.566 |
| Factor 3: Low-Frequency Cutoff | 3 | 30 | 136.752 | <0.001 |
| Condition × Song Segment | 1 | 10 | 8.813 | 0.014 |
| Song Segment × Low-Frequency Cutoff | 3 | 30 | 14.8 | <0.001 |
| Condition × Low-Frequency Cutoff | 3 | 30 | 0.815 | 0.496 |
| Three-way interaction | 3 | 30 | 0.242 | 0.866 |
| ANOVA 1.4: Factors: Condition (Acoustic and Full Bandwidth Electric vs. Acoustic and High-Pass Electric), Song Segment, Low-Frequency Cutoff | ||||
|
| ||||
| Factor | df Num | df Denom | F | p |
|
| ||||
| Factor 1: Condition | 1 | 10 | 0.374 | 0.553 |
| Factor 2: Song Segment | 1 | 10 | 0.94 | 0.355 |
| Factor 3: Low-Frequency Cutoff | 2 | 20 | 36.548 | <0.001 |
| Condition × Song Segment | 1 | 10 | 0.095 | 0.764 |
| Song Segment × Low-Frequency Cutoff | 2 | 20 | 10.679 | <0.001 |
| Condition × Low-Frequency Cutoff | 2 | 20 | 0.579 | 0.569 |
| Three-way interaction | 2 | 20 | 0.654 | 0.531 |
| Paired t Tests for “Ring of Fire” | ||||
|
| ||||
| Comparison | df | t | p | |
|
| ||||
| Electric only (2) vs. 250 Hz low pass (4) | 10 | −1.115 | 0.291 | |
| Electric only (2) vs. 500 Hz low pass (5) | 10 | 1.802 | 0.102 | |
| Electric only (2) vs. 1000 Hz low pass (6) | 10 | 6.909 | <0.001 | |
| Electric only (2) vs. full bandwidth (1) | 10 | 28.733 | <0.001 | |
| Paired t Tests for “Rhapsody in Blue” | ||||
|
| ||||
| Comparison | df | t | p | |
|
| ||||
| Electric only (2) vs. 250 Hz low pass (4) | 10 | 0.738 | 0.478 | |
| Electric only (2) vs. 500 Hz low pass (5) | 10 | 6.733 | <0.001 | |
| Electric only (2) vs. 1000 Hz low pass (6) | 10 | 15.173 | <0.001 | |
| Electric only (2) vs. full bandwidth (1) | 10 | 26.938 | <0.001 | |
ANOVA, analysis of variance; df, degrees of freedom.
Enjoyment ratings of electric only stimulation (stimulus 2) were very low: 22 (range 7 to 35) for “Ring of Fire” and 11.24 (range 8 to 41) for “Rhapsody in Blue.” A two-way repeated-measures ANOVA (ANOVA 1.2, Table 4) was performed using electric-only (stimulus 3) versus anchor (stimulus 13) stimulation as one factor and song segment as the other factor. Electric stimuli enjoyment ratings, although low, were significantly higher than ratings for the anchor that was presented to the acoustic-hearing ear. In addition, there were significant effects for song and song/segment interaction. This means that “Ring of Fire” ratings were significantly higher than those for “Rhapsody in Blue” when using only the CI.
As expected, enjoyment ratings decreased with reduced low-pass filter frequencies. Ratings for the combined acoustic and electric stimulation (green bars) were higher than for the acoustic-only stimulation (red bars) regardless of song segment or low-pass filter frequency. A three-way repeated-measures ANOVA (ANOVA 1.3, Table 4) with factors of stimulation type (acoustic vs. combined acoustic and electric), song segment, and low-pass filter frequency was calculated. Significant main effects were found for stimulus type (acoustic vs. combined electrical and acoustic) and for low-pass filter frequency, as were interactions between song segment and stimulus type and song segment and low-pass filter cutoff frequency. This means that the two-ear enhancement effect mentioned above is also observed when the CI is added to a low pass filtered version of the song segment (presented to the acoustic-hearing ear) instead of the full bandwidth version, and that the effect is still more pronounced for “Ring of Fire” than for “Rhapsody in Blue.”
Enjoyment ratings for electric only stimulation (24 for “Ring of Fire” and 12 for “Rhapsody in Blue”) were similar to those obtained using acoustic-only stimulation with a low-pass filter cutoff frequency of 250 Hz (18 for “Ring of Fire” and 16 for “Rhapsody in Blue”). The difference between these two conditions (electric only and 250-Hz low pass filtered acoustic-only) was not statistically significant for either song segment. Ratings for electric only stimulation were generally lower than for the acoustic-only testing conditions, including the full bandwidth and 1000-Hz condition for both songs as well as the 500-Hz condition for “Rhapsody in Blue.” These results, obtained using paired t tests, still stood even after controlling for type I error using Rom’s method (Rom 1990). The t tests are fully described in Table 4.
All results reported earlier were unaffected by whether the electrically stimulated ear received a full bandwidth signal (green bars) or a signal that was filtered to avoid overlap with the frequency range presented to the acoustic ear (yellow bars) as reported in ANOVA 1.4, Table 4.
EXPERIMENT NO. 2: COMPARING AN ACOUSTIC-HEARING EAR TO AN ACOUSTIC-HEARING EAR WITH VOCODED INPUT
Methods
Experiment 2 is a replication of experiment 1 with bilaterally NH subjects using a vocoder to replace the ear with the CI. Other than that, the conditions for this experiment were identical to those used in experiment 1.
Subjects •
Nine subjects with NH in both ears participated in this experiment at the New York University School of Medicine in New York City.
Stimuli •
Stimuli were modified stimuli from experiment 1. Specifically, all audio that was presented to the implanted ear in experiment 1 was vocoded in experiment 2 to simulate CI processing. All audio that was presented to the acoustic-hearing ear in experiment 1 remained the same in experiment 2. All vocoding of audio that was previously routed to the implant was done using AngelSim software with default parameters for an 8-channel noise vocoder, which is a widely used configuration in studies that aim to simulate the information provided by CIs. That is, analysis and carrier filters ranged from 200 to 7000 Hz with a 24 dB/octave roll-off and envelope detection for each channel was performed with a low-pass filter at 400 Hz. Note that the vocoding parameters used to simulate an implant in this experiment differ from the vocoding parameters used to create the anchor stimulus. The anchor stimulus was degraded further than other vocoded stimuli in this experiment. Specifically, fewer (only six) channels were represented, place of stimulation was shifted (as typically occurs with a CI) by changing carrier filters, and increased channel interaction was implemented by changing the filter slope. One way to think about it is that the anchor stimulus represents a worst-case simulation of hearing with a CI, and the other vocoded stimuli used in experiment 2 represent a more ideal simulation of hearing with an implant. Therefore, it would be predicted that enjoyment of the anchor would still be lower than that of the other vocoded stimuli in this experiment. A summary of all stimuli used in experiment 2 is presented in Table 5. Note that the stimuli which only presented sound to the NH ear in experiment 1 (1, 4, 5, 6, and 13) are identical in experiment 2 and therefore maintain the same stimulus numbers. As stimuli involving presentation to the electric ear in experiment 1 are replaced with vocoded version, the corresponding stimuli numbers have a “v” appended to them (e.g., 2v, 3v, 7v, 8v, 9v, 10v, 11v, and 12v).
TABLE 5.
A list of stimuli used in experiment 2
| Stimulus No. | Left Ear | Right Ear | Set A | Set B | Description |
|---|---|---|---|---|---|
| 1 | Full bandwidth | — | x | x | Normal hearing ear only |
| 2v | — | Vocoded full bandwidth | x | x | CI simulation only |
| 3v | Full bandwidth | Vocoded full bandwidth | x | x | Acoustic and CI simulation |
| 4 | Low-pass filter: 250 Hz | — | x | — | Hearing loss simulation |
| 5 | Low-pass filter: 500 Hz | — | x | — | Hearing loss simulation |
| 6 | Low-pass filter: 1000 Hz | — | x | — | Hearing loss simulation |
| 7v | Low-pass filter: 250 Hz | Vocoded full bandwidth | x | x | Bimodal user simulation |
| 8v | Low-pass filter: 500 Hz | Vocoded full bandwidth | x | x | Bimodal user simulation |
| 9v | Low-pass filter: 1000 Hz | Vocoded full bandwidth | x | x | Bimodal user simulation |
| 10v | Low-pass filter: 250 Hz | Vocoded high-pass filter: 250 Hz | — | x | Bimodal simulation without overlapping frequencies |
| 11v | Low-pass filter: 500 Hz | Vocoded high-pass filter: 500 Hz | — | X | Bimodal simulation without overlapping frequencies |
| 12v | Low-pass filter: 1000 Hz | Vocoded high-pass filter: 1000 Hz | — | x | Bimodal simulation without overlapping frequencies |
| 13 | 6-channel noise vocoder with 6.5 mm shift | — | x | x | Low quality anchor stimulus which presumably sounds worse than all other stimuli |
Note that some conditions (1, 4, 5, 6, 13) are identical to those in experiment 1 while other conditions represent vocoder versions of the corresponding conditions in experiment 1.
Procedure •
All stimuli were presented over headphones to both ears. Subjects set the volume of the headphones to a most comfortable level by adjusting a knob on the USB soundcard attached to a PC. The left ear received all of the stimuli presented to the acoustic-hearing ear in experiment 1 while the right ear received the vocoded versions of the stimuli presented to the implanted ear in experiment 1. Using the new stimuli, all subjects repeated the modified MUSHRA protocol used in experiment 1 ten times.
Results
Data from this experiment were analyzed using a procedure similar to that used in experiment 1. For each subject and stimulus, the 80% trimmed mean was calculated. All nine subjects rated stimulus 1 (the hidden reference; full bandwidth nonvocoded music played to the left ear) as similar to the reference stimulus (which was physically identical). The range of trimmed mean ratings for the hidden reference from each subject and both song segments was 100 to 107. Therefore, the data from all 9 subjects in experiment 2 were included in the analysis. All subjects rated the anchor stimulus (stimulus 13; the 6-channel vocoded and frequency-shifted stimulus played to the left ear) below 2.7. For “Ring of Fire,” the anchor stimulus was always rated as the least enjoyable sound. Although for “Rhapsody in Blue” no subject rated any stimulus lower than the anchor, the CI processing simulation (stimulus 2v) was rated identically to the anchor stimulus for three subjects (NH-101 and NH-105 rated both stimuli as 0; NH-103 rated both stimuli as 0.05). Although the values for the reference and anchor were already close to 100 and 0 for all subjects, the ratings for each stimulus were normalized (linearly rescaled) for each song segment for each subject so that the reference was exactly 100 and the anchor was 0, just as in experiment 1.
A summary of the normalized data for experiment 2 is presented in Figure 4 using the same format as Figure 3 from experiment 1. Contrary to the results from experiment 1, ratings did not increase when a degraded version of the original stimulus was presented in the ear contralateral to the one where the unmodified original stimulus was presented. Ratings for stimulus 3v (which includes the original and the degraded version sent to opposite ears) were lower than for stimulus 1 (original version only, presented to a single ear). Specifically, the trimmed mean rating for stimulus 3v for “Ring of Fire” was 49.38 (10.32 SE of the mean; range 5 to 89) and for “Rhapsody in Blue” was 38.77 (9.02 SE of the mean; range 4 to 74). A two-way repeated-measures ANOVA (ANOVA 2.1, Table 6) found a main effect of the difference between the unmodified stimulus alone (stimulus 1) and its combination with vocoded stimulation to the contralateral ears (stimulus 3). In addition, a main effect of song segment and the interaction was detected. In other words, the combined presentation of the original song segment to one ear and the 8-channel vocoded version to the other ear was rated as significantly less enjoyable than the reference (the original sample presented to only one ear), and this was more pronounced for “Rhapsody in Blue” than for “Ring of Fire.”
TABLE 6.
Summary of statistical analyses for experiment 2
| Experiment 2 | ||||
|---|---|---|---|---|
|
| ||||
| ANOVA 2.1: Factors: Condition (Full Bandwidth Acoustic vs. Full Bandwidth Acoustic and 8-Channel Vocoded), Song Segment | ||||
|
| ||||
| Factor | df Num | df Denom | F | p |
| Factor 1: Condition | 1 | 8 | 34.864 | <0.001 |
| Factor 2: Song Segment | 1 | 8 | 6.599 | 0.033 |
| Interaction | 1 | 8 | 6.599 | 0.033 |
| ANOVA 2.2: Factors: Condition (8-Channel Vocoded Only vs. Anchor only), Song Segment | ||||
|
| ||||
| Factor | df Num | df Denom | F | p |
|
| ||||
| Factor 1: Condition | 1 | 8 | 14.977 | 0.005 |
| Factor 2: Song Segment | 1 | 8 | 15.587 | 0.004 |
| Interaction | 1 | 8 | 15.587 | 0.004 |
| ANOVA 2.3: Factors: Condition (Acoustic vs. Acoustic and 8-Channel Vocoded), Song Segment, Low-Frequency Cutoff | ||||
|
| ||||
| Factor | df Num | df Denom | F | p |
|
| ||||
| Factor 1: Condition | 1 | 8 | 31.933 | <0.001 |
| Factor 2: Song Segment | 1 | 8 | 0.812 | 0.394 |
| Factor 3: Low-Frequency Cutoff | 3 | 24 | 76.55 | <0.001 |
| Condition × Song Segment | 1 | 8 | 8.324 | 0.02 |
| Song Segment × Low-Frequency Cutoff | 3 | 24 | 21.693 | <0.001 |
| Condition × Low-Frequency Cutoff | 3 | 24 | 6.935 | 0.002 |
| Three-way interaction | 3 | 24 | 2.451 | 0.088 |
| ANOVA 2.4: Factors: Condition (Acoustic and Full Bandwidth Electric vs. Acoustic and High-Pass Electric), Song Segment, Low-Frequency Cutoff | ||||
|
| ||||
| Factor | df Num | df Denom | F | p |
|
| ||||
| Factor 1: Condition | 1 | 8 | 1.364 | 0.276 |
| Factor 2: Song Segment | 1 | 8 | 0.333 | 0.58 |
| Factor 3: Low-Frequency Cutoff | 2 | 16 | 12.657 | 0.001 |
| Condition × Song Segment | 1 | 8 | 0.614 | 0.456 |
| Song Segment × Low-Frequency Cutoff | 2 | 16 | 0.611 | 0.555 |
| Condition × Low Frequency Cutoff | 2 | 16 | 4.834 | 0.023 |
| Three-way interaction | 2 | 16 | 0.004 | 0.996 |
| Paired t Tests for “Ring of Fire” | ||||
|
| ||||
| Comparison | df | t | p | |
|
| ||||
| Vocoder only (2v) vs. 250 Hz low pass (4) | 8 | 2.986 | 0.017 | |
| Vocoder only (2v) vs. 500 Hz low pass (5) | 8 | 5.111 | <0.001 | |
| Vocoder only (2v) vs. 1000 Hz low pass (6) | 8 | 10.316 | <0.001 | |
| Vocoder only (2v) vs. full bandwidth (1) | 8 | 71.513 | <0.001 | |
| Paired t Tests for “Rhapsody in Blue” | ||||
|
| ||||
| Comparison | df | t | p | |
|
| ||||
| Vocoder only (2v) vs. 250 Hz low pass (4) | 8 | 4.537 | 0.002 | |
| Vocoder only (2v) vs. 500 Hz low pass (5) | 8 | 8.738 | <0.001 | |
| Vocoder only (2v) vs. 1000 Hz low pass (6) | 8 | 15.014 | <0.001 | |
| Vocoder Only (2v) vs. full bandwidth (1) | 8 | 342.115 | <0.001 | |
ANOVA, analysis of variance; df, degrees of freedom.
Subjects rated enjoyment of the 8-channel vocoder (stimulus 2) as 5.23 (1.33 SE of the mean; range 1 to 11) for “Ring of Fire” and 0.78 (0.29 SE of the mean; range 0 to 3) for “Rhapsody in Blue.” A two-way repeated-measures ANOVA was performed comparing the 8-channel vocoder (stimulus 2v) with the anchor (stimulus 13) as one factor and song segment as the other (ANOVA 2.2, Table 6). A main effect of stimulus found that the 8-channel nonshifted vocoder was rated better than the anchor. In addition, a main effect of song segment and the interaction were detected.
As expected, enjoyment ratings decreased with reduced low-pass filter cutoff frequencies. Nevertheless, the ratings for the combined vocoded and nonvocoded stimuli (green bars) were always higher than the nonvocoded only stimulation (red bars) regardless of song segment or low-pass filter cutoff frequency. A three-way repeated-measures ANOVA with factors of stimulation type (nonvocoded to the left ear with either silence or a vocoded version to the right ear), song segment, and low-pass filter cutoff frequency was calculated (ANOVA 2.3, Table 6). Main effects of stimulation type and low-pass filter cutoff frequency were found as well as interactions between song segment and stimulus type, song segment and low-pass filter frequency cutoff, and stimulus type and low-pass filter frequency cutoff. The main effect of song segment and the three-way interaction were not significant.
The 8-channel vocoder presented to the right ear (black bar) was rated lower than any of the nonvocoded stimuli (red bars) regardless of low-pass filter cutoff frequency. Posthoc paired t tests detected that the vocoded version of each song segment was significantly lower than all nonvocoded stimuli (red bars) for both song segments even after type I error correction using Rom’s method (Rom 1990). The specifics of the t tests are presented in Table 6.
All results reported earlier were unaffected by whether the electrically stimulated ear received a full bandwidth signal (green bars) or a signal that was filtered to avoid overlap with the frequency range presented to the acoustic ear (yellow bars) as reported in ANOVA 2.4, Table 6.
EXPERIMENT NO. 3: ESTIMATING MUSIC ENJOYMENT DIFFERENCE BETWEEN ONE AND TWO EARS
Methods
Experiment 3 was designed primarily to estimate the increase in music enjoyment when the same exact monaural song segment is presented to both ears rather than to just one ear. Results from this experiment indicate the size of the two-ear benefit in music enjoyment when input from a second NH ear (rather than input from a CI) is added to the first NH ear.
Subjects •
Thirteen subjects with NH in both ears participated in this experiment at the New York University School of Medicine.
Stimuli •
A total of seven stimuli, based on the same samples of “Ring of Fire” and “Rhapsody in Blue” used in the previous two experiments, were used in this experiment as described in Table 7. The same reference (stimulus 1; unmodified, to the left ear) and anchor (stimulus 13; 6-channel noise vocoder with a 6.5 mm shift, also sent to the left ear) that were used in the previous two experiments were also used in this experiment. Stimulus 3.2 presented the unmodified song segment to the left ear and the 8-channel vocoded song segment to the right ear (same vocoder parameters as in experiment 2). Stimulus 3.3 presented the unmodified song segment to both ears. Three additional stimuli were used to simulate a hearing loss in the left ear with a 500-Hz low-pass filter frequency cutoff. Stimuli 3.4, 3.5, and 3.6 were identical to stimuli 1, 3.2, and 3.3, except for the 500-Hz low-pass filtering applied to the original song segment presented to the left ear. Note that, just like in experiments 1 and 2, the same exact audio source was used to generate stimuli for both ears, allowing for a potential two-ear benefit but no stereo information.
TABLE 7.
A list of stimuli used in experiment 3
| Stimulus No. | Left Ear | Right Ear | Description |
|---|---|---|---|
| 1 | Full bandwidth | — | Normal unilateral hearing |
| 3.2 | Full bandwidth | Vocoded full bandwidth | SSD with CI simulation |
| 3.3 | Full bandwidth | Full bandwidth | Normal bilateral hearing |
| 3.4 | Low-pass filter: 500 Hz | — | Hearing loss simulation |
| 3.5 | Low-pass filter: 500 Hz | Vocoded full bandwidth | Bimodal simulation |
| 3.6 | Low-pass filter: 500 Hz | Full bandwidth | Unilateral hearing loss simulation |
| 13 | 6-channel noise vocoder with 6.5 mm shift | — | Low quality anchor stimulus which presumably sounds worse than all other stimuli |
Please note that the anchor (stimulus 13) and reference (stimulus 1) are identical to those used in experiments 1 and 2.
CI, cochlear implant; SSD, single-sided deafness.
Procedure •
The procedure for experiment 3 was identical to that of experiment 2 with an updated stimulus set.
Results
Data from this experiment were analyzed using a procedure similar to that used for experiment 1. For each subject and stimulus, the 80% trimmed mean was calculated. The same criterion as experiment 1 that subjects with trimmed means of the hidden reference stimulus (stimulus 1) outside of the range of 90 to 110 for either song segment was used to remove subjects from further analysis. Four subjects did not meet this criterion. Data from the remaining 9 subjects were analyzed. For these 9 subjects, the range of trimmed mean rating for the hidden anchor was 96 to 105. The trimmed means for the anchor stimulus (stimulus 13) for the 9 subjects ranged from 0 to 5.5. In all cases, the anchor stimulus was the lowest rated stimulus of the set.
A summary of the normalized data for experiment 3 is presented in Figure 5. The left panel represents data for the song segment “Ring of Fire” and the right panel represents data for the song segment “Rhapsody in Blue.” Data are organized along the horizontal axis based on the bandwidth of the nonvocoded stimuli presented to the left ear. Red bars (stimuli 1 and 3.4) indicate ratings when the song segment is only presented to the left ear, green bars (stimuli 3.2 and 3.5) indicate ratings for the music presented with a full bandwidth vocoded version of the song segment to the right ear, and blue bars (stimuli 3.3 and 3.6) indicate when a full bandwidth nonvocoded version of the song segment is presented to the right ear.
FIG. 5.

Results for experiment 3 with NH. The left panel indicates results for “Ring of Fire” while the right panel indicates results for “Rhapsody in Blue.” The sets of bars are organized based on the low-pass filter (500 Hz or no low-pass filter) provided to the left ear with nonvocoded stimuli. Red bars indicate ratings to nonvocoded stimuli provided to the left ear alone, green bars indicate ratings to nonvocoded stimuli provided to the left ear and vocoded stimuli to the right ear, and blue bars indicate ratings when nonvocoded stimuli are provided to both ears. Error bars indicate ±1 SE of the mean. MUSHRA indicates MUltiple Stimuli with Hidden Reference and Anchor; NH, normal hearing.
A three-way repeated-measures ANOVA (Table 8) was calculated with factors of song segment, low-pass filter frequency cutoff to the left ear, and right ear condition (silence, vocoded, and nonvocoded). Main effects of the frequency range for the left ear and right ear condition were detected, as were interactions between song segment and frequency range for the left ear and between the frequency range for the left- and right-ear condition.
TABLE 8.
Summary of statistical analyses for experiment 3
| Experiment 3 | ||||
|---|---|---|---|---|
|
| ||||
| Factors: Second Ear Condition (Silence, Unprocessed, or 8-Channel Vocoded), Song Segment (“Ring” or “Rhapsody”), First Ear Low-Frequency Cutoff | ||||
|
| ||||
| Factor | df Num | df Denom | F | p |
| Factor 1: Second Ear Condition | 2 | 16 | 43.505 | <0.001 |
| Factor 2: Song Segment | 1 | 8 | 0.098 | 0.762 |
| Factor 3: First Ear Low-Frequency Cutoff | 1 | 8 | 71.598 | <0.001 |
| Condition × Song Segment | 2 | 16 | 0.219 | 0.805 |
| Song Segment × Low-Frequency Cutoff | 1 | 8 | 7.237 | 0.027 |
| Condition × Low-Frequency Cutoff | 2 | 16 | 141.657 | <0.001 |
| Three-way interaction | 2 | 16 | 3.018 | 0.077 |
df, degrees of freedom.
The same acoustic sound played to both ears together was rated as 162 (9.1 SE of the mean; range 104 to 200) for “Ring of Fire” and 156 (11.2 SE of the mean; range 101 to 197) for “Rhapsody in Blue” relative to the sound played only to the left ear which was rated as 100. The improvement in sound rating for adding a second NH ear was larger than the improvement for adding a CI to a NH ear as measured in experiment 1. Recall that the full bandwidth combination of acoustic and electric stimulation in experiment 1 was rated as 131 for “Ring of Fire” and 115 for “Rhapsody in Blue.” A mixed-effect ANOVA with a within-subject factor of song segment and a between-subjects factor of having either two NH ears (data from experiment 3) or a NH ear and a contralateral CI (data from experiment 1) was conducted (Table 9). Main effects of second ear type and song segment were statistically significant, but the interaction was not.
TABLE 9.
Summary of statistical analysis comparing experiments 1 and 3
| Experiment 1 vs. Experiment 3 | ||||
|---|---|---|---|---|
|
| ||||
| Factors: Second Ear Type (CI or NH), Song Segment (“Ring” or “Rhapsody”) | ||||
|
| ||||
| Factor | df Num | df Denom | F | p |
| Factor 1: Second Ear Type | 1 | 18 | 5.689 | 0.028 |
| Factor 2: Song Segment | 1 | 18 | 10.169 | 0.005 |
| Interaction | 1 | 18 | 1.476 | 0.24 |
df, degrees of freedom.
DISCUSSION
Music Enjoyment With a CI Relative to a NH Ear
This article presents the first direct comparison between music enjoyment with a CI and music enjoyment with a NH or near-NH ear in listeners who can directly compare the two. For both song segments, musical enjoyment through a CI was much closer to that obtained from a grossly distorted version of the original (6-channel noise-band vocoder with a simulated shift of 6.5 mm) played to the NH ear, than to that obtained from playing the original song segment to the NH ear. Listening to the song segments through a CI, enjoyment was similar to listening to the segments low pass filtered at 250 Hz and presented to the NH ear. It is important to note that these comparisons are about listening enjoyment and not about sound quality, while listening enjoyment for music through a CI may be similar to the enjoyment experienced from a version that was low pass filtered at 250 Hz, it seems highly unlikely (due to the very different natures of the distortions in the 2 signals) that they would sound similar. An additional novel attribute of this data is that as the musical enjoyment with a CI is measured relative to hearing with an acoustic-hearing ear, the results can be more easily interpreted from the perspective of a listener with a NH ear. The reader is encouraged to listen to the audio files provided as Supplemental Digital Content (http://links.lww.com/EANDH/A558) to help with the interpretation of the data.
It is interesting that the ratings for “Rhapsody in Blue” were consistently lower than the ratings for “Ring of Fire” when evaluated under the same degraded condition (CI or vocoder). The “Rhapsody in Blue” sample is characterized by complex instrumentation which is difficult to perceive for a CI user (Looi et al. 2008) and has no lyrics to which the listener can attend, along with a complex rhythm. In contrast, the “Ring of Fire” sample is characterized by clear vocals and a simple rhythm without complicated instrumentation. Therefore, it makes sense that the degradation imposed by a CI or by noise vocoding might be more severe for “Rhapsody in Blue” than for “Ring of Fire” (Buyens et al. 2014; Pons et al. 2016). Although a vocoder does not provide an accurate representation of the sound quality of a CI (Svirsky et al. 2013; Dorman et al. 2017), it can provide perspective on the distortions to each sample through a limited spectral representation. Differences in ratings between the songs could potentially have been affected by differences in familiarity with the two songs. Anecdotally, most listeners were familiar with both songs before the experiment, but their familiarity with these songs was not formally collected. However, after listening to the same song segments for hours, the listeners were all overly familiar with the song segments by the end of the experiment. An additional potential factor is that “Ring of Fire” contained lyrics in English. While most participants were native English speakers, the SSD-CI participants in Belgium were all native Flemish speakers with varying degrees of familiarity with English. It is further unknown how this may have affected ratings. However, it is worth noting that the SSD-CI participants with the greatest two-ear enhancements for “Ring of Fire” were native Flemish speakers.
These results are consistent with previous reports that CI users find music unenjoyable or even unpleasant (Leal et al. 2003). The present results confirm the prior consensus about the limited enjoyment CI users derive from music, but in this case, it is done with respect to perceptual references that can be easily interpreted and understood by listeners with NH.
There are two important caveats that limit the extent to which we might be able to generalize these results (obtained with SSD-CI users) to CI users without ipsilateral or contralateral acoustic hearing. Arguments could be made to suggest that enjoyment of music presented exclusively through the CI may be either better or worse for SSD-CI users than for CI users without any acoustic hearing. On one hand, music enjoyment for CI users without acoustic hearing might be better than for SSD-CI users as the former might adapt more easily to the CI, not having an acoustic input competing with the signal, or having to integrate two different types of sounds. Furthermore, with their auditory experiences provided by the CI, they might forget the experience of music with acoustic hearing and therefore become more tolerant of the distortions to music through a CI as described by Jiam et al. (2017). On the other hand, SSD-CI users have the opportunity to listen to music simultaneously through their CI and NH ear in their daily listening environments. This might allow them to associate musical input through the implant with the corresponding sound through the NH ear. This in turn could lead to more enjoyment of listening to music through a CI than would be experienced by a CI user with no acoustic hearing.
These caveats notwithstanding, we believe that the present data are useful to help us assess music enjoyment with a unilateral CI.
Two-Ear Enhancement of Music Enjoyment
We demonstrated that two-ear enhancement clearly happens in NH listeners when the same exact musical signal is presented to both ears rather than to just one ear. Perhaps the most surprising result of this study is that much of this two-ear enhancement is observed in experienced SSD-CI users when the same exact musical signal is presented to both ears, even though the added signal (that presented to the implanted ear) is substantially degraded. That is, even though the enjoyment of music through a CI is substantially worse than listening to the sample with a NH ear (Fig. 3, black bars), providing the highly degraded CI signal to one ear in conjunction with an unprocessed version presented to the NH ear greatly improves the enjoyment of the song segment relative to listening with the NH ear alone. Before SSD patients began to be implanted with CIs, there was great concern that listening to a CI simultaneously with a NH ear may interfere with the auditory input to the NH ear. However, the present data suggest that, at least for experienced SSD-CI users, this may not be an issue that would affect their music enjoyment in a negative way. In fact, the opposite is true: we observed robust two-ear enhancement rather than two-ear interference. It is interesting to point out that the two-ear enhancement observed using “Ring of Fire” was 62 for NH subjects and 31 for SSD-CI users, and the two-ear enhancement observed using “Rhapsody in Blue” was 56 for NH subjects and 15 for SSD-CI users. In other words, a substantial fraction of the two-ear enhancement seen in NH listeners (experiment 3) was obtained from electrical stimulation of the contralateral ear in experienced CI users (experiment 1), even when this electrical stimulation was not at all enjoyable by itself (also experiment 1).
The two-ear enhancement observed in SSD users was not replicated in NH subjects listening to an 8-channel noise-band vocoder in their second ear. In fact, the opposite effect was observed. Adding the vocoded signal to the second ear resulted in a large decrease (rather than an increase) in music enjoyment. There are at least two potential reasons for this discrepancy. First, it is not clear that an 8-channel noise-band vocoder is an appropriate model of auditory percepts obtained from a CI (Svirsky et al. 2013). Another potential difference is that listening to music through the vocoder was a novel experience for the NH listeners while each of the SSD subjects already had a minimum of 10.5 months experience listening with their CI. It is unknown if the two-ear enhancement observed with experienced SSD-CI users would be replicated with newly implanted SSD listeners or if the benefit is dependent on a period of adaptation. It should be noted that the enjoyment of listening to music with a noise-band vocoder alone (black bars, Fig. 4) was less than listening to the same musical sample with a CI alone. However, with the current data, it is not possible to determine if the differences in ratings between the vocoder and CI are because enjoyment is less for the vocoder or because the subjects listening to the vocoder have not been given time to acclimate to it while the SSD-CI users have extensive experience with their CIs.
The two-ear enhancement remains present for the SSD-CI users even when the acoustic stimulation is low pass filtered to simulate a hearing loss (Fig. 2, green and yellow bars are always higher than the red bars). This suggests that the two-ear enhancement observed in this article may generalize to other populations or CI users with more limited acoustic hearing.
Consistent results were found by El Fata et al. (2009). In their study, all bimodal subjects with ski-slope hearing loss preferred listening to music using both their hearing aid and CI than with either the hearing aid or CI alone. However, for the 6 subjects in El Fata et al. with median thresholds greater than or equal to 85 dB HL, 4 of them preferred to listen to music only with their CI. Presumably, 4 subjects who preferred listening to music only with their CI perceived much less through their hearing aid than the subjects in the present article, even when the acoustic signal was low pass filtered. It is also worth noting that low pass filtering the acoustic-only models impaired auditory thresholds. It does not model additional distortions or psychoacoustic anomalies such as broadened filter width that can accompany moderate to severe hearing losses (Glasberg & Moore 1986; Moore & Glasberg 1986).
Bimodal listening has the theoretical benefit of providing both low-frequency fine temporal information through an acoustic-hearing ear while restoring higher frequency information through a CI. While bimodal listening is often preferred (and leads to better speech perception, e.g., Neuman & Svirsky 2013; Dorman et al. 2015; Gifford et al. 2017; Neuman et al. 2019), it is questionable what the contribution or role of the lower frequency provided by the hearing aid is for a given user. It is possible that providing the CI frequencies that overlap with the acoustic hearing might interfere and reduce enjoyment of listening. However, no differences were detected between simulated bimodal ratings when either the full frequency range (green bars in Fig. 2) or only nonoverlapping frequencies (yellow bars in Fig. 2) are provided to the CI.
In summary, the two main results of this study are that SSD-CI users find music unenjoyable when listening only through the CI, but when the musical signal is presented to both ears simultaneously, the combination is significantly more enjoyable than using the acoustic-hearing ear alone. Another important result is that this two-ear enhancement in music enjoyment observed in SSD-CI users represented a substantial fraction of the two-ear enhancement seen in NH listeners. In other words, human listeners seem to have a strong preference for listening to music using both ears, even when the signal presented to the second ear is seriously degraded with respect to that presented to the first ear. This two-ear enhancement of music enjoyment may require a certain amount of experience listening to the degraded signal in the second ear. This unexpected benefit of electroacoustic auditory stimulation is a new finding that will have to be considered in theoretical accounts of the music enjoyment that may be derived from different types of auditory input and may facilitate the search for strategies to enhance music enjoyment in hearing-impaired listeners.
Supplementary Material
ACKNOWLEDGMENTS
The authors thank Johanna Boyer for multiple conversations that inspired the research questions investigated in this article. The authors are grateful for the time and effort from each of the participants.
Griet Mertens provided demographic information for the participants from Antwerp. This research was funded by the National Institute on Deafness and Other Communication Disorders (R01 DC012152 principal investigator: Landsberger; R01 DC03937 principal investigator: Svirsky; R01 DC011329 principal investigators: Svirsky and Neuman), a MED-EL Hearing Solutions grant (principal investigator: Landsberger), a contract from Cochlear Americas (principal investigator: J. Thomas Roland), and a TOPBOF grant (principal investigator: Van de Heyning) from the University of Antwerp.
D.M.L., M.A.S., and K.V designed the experimental protocol. D.M.L. created the stimuli and modified software for use in this experiment. P.v.d.H. provided testing facilities, patient access, and organized IRB approval for data collection in Belgium. K.V., N.S., A.L., and J.N. collected the data. Figures and statistical analysis were generated by D.M.L. The article was primarily written by D.M.L. and M.A.S. All other authors contributed to drafting the article or revising it critically for important intellectual content. All authors provided final approval of the version to be published.
Footnotes
Supplemental digital content is available for this article. Direct URL citations appear in the printed text and are provided in the HTML and text of this article on the journal’s Web site (www.ear-hearing.com).
The authors have no conflicts of interest to disclose.
REFERENCES
- Buyens W, van Dijk B, Moonen M, et al. (2014). Music mixing preferences of cochlear implant recipients: A pilot study. Int J Audiol, 53, 294–301. [DOI] [PubMed] [Google Scholar]
- Dorman MF, Cook S, Spahr A, et al. (2015). Factors constraining the benefit to speech understanding of combining information from low-frequency hearing and a cochlear implant. Hear Res, 322, 107–111. [DOI] [PMC free article] [PubMed] [Google Scholar]
- Dorman MF, Natale SC, Butts AM, et al. (2017). The sound quality of cochlear implants: Studies with single-sided deaf patients. Otol Neurotol, 38, e268–e273. [DOI] [PMC free article] [PubMed] [Google Scholar]
- Eddington DK, Dobelle WH, Brackmann DE, et al. (1978). Auditory prostheses research with multiple channel intracochlear stimulation in man. Ann Otol Rhinol Laryngol, 87(6 Pt 2), 1–39. [PubMed] [Google Scholar]
- Eddington DK, Dobelle WH, Brackmann DE, et al. (1978a). Place and periodicity pitch by stimulation of multiple scala tympani electrodes in deaf volunteers. Trans Am Soc Artif Intern Organs, 24, 1–5. [PubMed] [Google Scholar]
- El Fata F, James CJ, Laborde ML, et al. (2009). How much residual hearing is ‘useful’ for music perception with cochlear implants? Audiol Neurootol, 14(Suppl 1), 14–21. [DOI] [PubMed] [Google Scholar]
- Fishman KE, Shannon RV, Slattery WH (1997). Speech recognition as a function of the number of electrodes used in the SPEAK cochlear implant speech processor. J Speech Lang Hear Res, 40, 1201–1215. [DOI] [PubMed] [Google Scholar]
- Friesen LM, Shannon RV, Baskent D, et al. (2001). Speech recognition in noise as a function of the number of spectral channels: Comparison of acoustic hearing and cochlear implants. J Acoust Soc Am, 110, 1150–1163. [DOI] [PubMed] [Google Scholar]
- Galvin JJ 3rd, Fu QJ, Oba S (2008). Effect of instrument timbre on melodic contour identification by cochlear implant users. J Acoust Soc Am, 124, EL189–EL195. [DOI] [PMC free article] [PubMed] [Google Scholar]
- Gfeller K, Woodworth G, Robin DA, et al. (1997). Perception of rhythmic and sequential pitch patterns by normally hearing adults and adult cochlear implant users. Ear Hear, 18, 252–260. [DOI] [PubMed] [Google Scholar]
- Gfeller K, Witt S, Woodworth G, et al. (2002). Effects of frequency, instrumental family, and cochlear implant type on timbre recognition and appraisal. Ann Otol Rhinol Laryngol, 111, 349–356. [DOI] [PubMed] [Google Scholar]
- Gfeller K, Christ A, Knutson J, et al. (2003). The effects of familiarity and complexity on appraisal of complex songs by cochlear implant recipients and normal hearing adults. J Music Ther, 40, 78–112. [DOI] [PubMed] [Google Scholar]
- Gifford RH, Davis TJ, Sunderhaus LW, et al. (2017). Combined electric and acoustic stimulation with hearing preservation: Effect of cochlear implant low-frequency cutoff on speech understanding and perceived listening difficulty. Ear Hear, 38, 539–553. [DOI] [PMC free article] [PubMed] [Google Scholar]
- Glasberg BR, & Moore BC (1986). Auditory filter shapes in subjects with unilateral and bilateral cochlear impairments. J Acoust Soc Am, 79, 1020–1033. [DOI] [PubMed] [Google Scholar]
- Goldwyn JH, Bierer SM, Bierer JA (2010). Modeling the electrodeneuron interface of cochlear implants: Effects of neural survival, electrode placement, and the partial tripolar configuration. Hear Res, 268, 93–104. [DOI] [PMC free article] [PubMed] [Google Scholar]
- International Telecommunication Union. (2003). Method for the subjective assessment of intermediate sound quality (MUSHRA; ITU-R. Recommendation.BS.1534-1). Geneva, Switzerland. [Google Scholar]
- Jiam NT, Caldwell MT, Limb CJ (2017). What does music sound like for a cochlear implant user? Otol Neurotol, 38, e240–e247. [DOI] [PubMed] [Google Scholar]
- Kong YY, & Carlyon RP (2010). Temporal pitch perception at high rates in cochlear implants. J Acoust Soc Am, 127, 3114–3123. [DOI] [PubMed] [Google Scholar]
- Kong YY, Cruz R, Jones JA, et al. (2004). Music perception with temporal cues in acoustic and electric hearing. Ear Hear, 25, 173–185. [DOI] [PubMed] [Google Scholar]
- Landsberger DM, & McKay CM (2005). Perceptual differences between low and high rates of stimulation on single electrodes for cochlear implantees. J Acoust Soc Am, 117, 319–327. [DOI] [PubMed] [Google Scholar]
- Landsberger DM, Padilla M, Srinivasan AG (2012). Reducing current spread using current focusing in cochlear implant users. Hear Res, 284, 16–24. [DOI] [PMC free article] [PubMed] [Google Scholar]
- Landsberger DM, Svrakic M, Roland JT Jr, et al. (2015). The relationship between insertion angles, default frequency allocations, and spiral ganglion place pitch in cochlear implants. Ear Hear, 36, e207–e213. [DOI] [PMC free article] [PubMed] [Google Scholar]
- Landsberger DM, Vermeire K, Claes A, et al. (2016). Qualities of single electrode stimulation as a function of rate and place of stimulation with a cochlear implant. Ear Hear, 37, e149–e159. [DOI] [PMC free article] [PubMed] [Google Scholar]
- Leal MC, Shin YJ, Laborde ML, et al. (2003). Music perception in adult cochlear implant recipients. Acta Otolaryngol, 123, 826–835. [DOI] [PubMed] [Google Scholar]
- Looi V, McDermott H, McKay C, et al. (2007). Comparisons of quality ratings for music by cochlear implant and hearing aid users. Ear Hear, 28(2 Suppl), 59S–61S. [DOI] [PubMed] [Google Scholar]
- Looi V, McDermott H, McKay C, et al. (2008). The effect of cochlear implantation on music perception by adults with usable pre-operative acoustic hearing. Int J Audiol, 47, 257–268. [DOI] [PubMed] [Google Scholar]
- McDermott HJ (2004). Music perception with cochlear implants: A review. Trends Amplif, 8, 49–82. [DOI] [PMC free article] [PubMed] [Google Scholar]
- Meehan S, Hough EA, Crundwell G, et al. (2017). The impact of single-sided deafness upon music appreciation. J Am Acad Audiol, 28, 444–462. [DOI] [PubMed] [Google Scholar]
- Mertens G, Punte AK, Van de Heyning P (2013). Self-assessment of hearing disabilities in cochlear implant users using the SSQ and the reduced SSQ5 version. Otol Neurotol, 34, 1622–1629. [DOI] [PubMed] [Google Scholar]
- Moore BC, & Glasberg BR (1986). Comparisons of frequency selectivity in simultaneous and forward masking for subjects with unilateral cochlear impairments. J Acoust Soc Am, 80, 93–107. [DOI] [PubMed] [Google Scholar]
- Neuman AC, & Svirsky MA (2013). Effect of hearing aid bandwidth on speech recognition performance of listeners using a cochlear implant and contralateral hearing aid (bimodal hearing). Ear Hear, 34, 553–561. [DOI] [PMC free article] [PubMed] [Google Scholar]
- Neuman AC, Zeman A, Neukam J, et al. (2019). The effect of hearing aid bandwidth and configuration of hearing loss on bimodal speech recognition in cochlear implant users. Ear Hear, 40, 621–635. [DOI] [PMC free article] [PubMed] [Google Scholar]
- Nimmons GL, Kang RS, Drennan WR, et al. (2008). Clinical assessment of music perception in cochlear implant listeners. Otol Neurotol, 29, 149–155. [DOI] [PMC free article] [PubMed] [Google Scholar]
- Padilla M, & Landsberger DM (2016). Reduction in spread of excitation from current focusing at multiple cochlear locations in cochlear implant users. Hear Res, 333, 98–107. [DOI] [PMC free article] [PubMed] [Google Scholar]
- Pons J, Janer J, Rode T, et al. (2016). Remixing music using source separation algorithms to improve the musical experience of cochlear implant users. J Acoust Soc Am, 140, 4338. [DOI] [PubMed] [Google Scholar]
- Riss D, Hamzavi JS, Blineder M, et al. (2014). FS4, FS4-p, and FSP: A 4-month crossover study of 3 fine structure sound-coding strategies. Ear Hear, 35, e272–e281. [DOI] [PubMed] [Google Scholar]
- Rom DM (1990). A sequentially rejective test procedure based on a modified Bonferroni inequality. Biometrika, 77, 663–665. [Google Scholar]
- Roy AT, Jiradejvong P, Carver C, et al. (2012). Assessment of sound quality perception in cochlear implant users during music listening. Otol Neurotol, 33, 319–327. [DOI] [PubMed] [Google Scholar]
- Roy AT, Carver C, Jiradejvong P, et al. (2015). Musical sound quality in cochlear implant users: A comparison in bass frequency perception between fine structure processing and high-definition continuous interleaved sampling strategies. Ear Hear, 36, 582–590. [DOI] [PubMed] [Google Scholar]
- Sacks O (2007). Musicophilia: Tales of Music and the Brain (pp. 143). New York, NY: Alfred A. Knopf. [Google Scholar]
- Shannon RV (1983). Multichannel electrical stimulation of the auditory nerve in man. I. Basic psychophysics. Hear Res, 11, 157–189. [DOI] [PubMed] [Google Scholar]
- Srinivasan AG, Shannon RV, Landsberger DM (2012). Improving virtual channel discrimination in a multi-channel context. Hear Res, 286, 19–29. [DOI] [PMC free article] [PubMed] [Google Scholar]
- Stakhovskaya O, Sridhar D, Bonham BH, et al. (2007). Frequency map for the human cochlear spiral ganglion: Implications for cochlear implants. J Assoc Res Otolaryngol, 8, 220–233. [DOI] [PMC free article] [PubMed] [Google Scholar]
- Svirsky MA (2017). Cochlear implants and electronic hearing. Physics Today, 70, 52–58. [Google Scholar]
- Svirsky MA, Ding N, Sagi E, et al. (2013). Validation of acoustic models of auditory neural prostheses. Proc IEEE Int Conf Acoust Speech Signal Process, 2013, 8629–8633. [DOI] [PMC free article] [PubMed] [Google Scholar]
- Tong YC, Blamey PJ, Dowell RC, et al. (1983). Psychophysical studies evaluating the feasibility of a speech processing strategy for a multiple-channel cochlear implant. J Acoust Soc Am, 74, 73–80. [DOI] [PubMed] [Google Scholar]
- Townshend B, Cotter N, Van Compernolle D, et al. (1987). Pitch perception by cochlear implant subjects. J Acoust Soc Am, 82, 106–115. [DOI] [PubMed] [Google Scholar]
- Van de Heyning P, Vermeire K, Diebl M, et al. (2008). Incapacitating unilateral tinnitus in single-sided deafness treated by cochlear implantation. Ann Otol Rhinol Laryngol, 117, 645–652. [DOI] [PubMed] [Google Scholar]
- Vermeire K, Nobbe A, Schleich P, et al. (2008). Neural tonotopy in cochlear implants: An evaluation in unilateral cochlear implant patients with unilateral deafness and tinnitus. Hear Res, 245, 98–106. [DOI] [PubMed] [Google Scholar]
- Vermeire K, Landsberger DM, Schleich P, et al. (2013). Multidimensional scaling between acoustic and electric stimuli in cochlear implant users with contralateral hearing. Hear Res, 306, 29–36. [DOI] [PMC free article] [PubMed] [Google Scholar]
- Vincent E (2005). MUSHRAM: A MATLAB interface for MUSHRA listening tests. Retrieved August 2, 2016, from https://members.loria.fr/EVincent/software-and-data/.
Associated Data
This section collects any data citations, data availability statements, or supplementary materials included in this article.