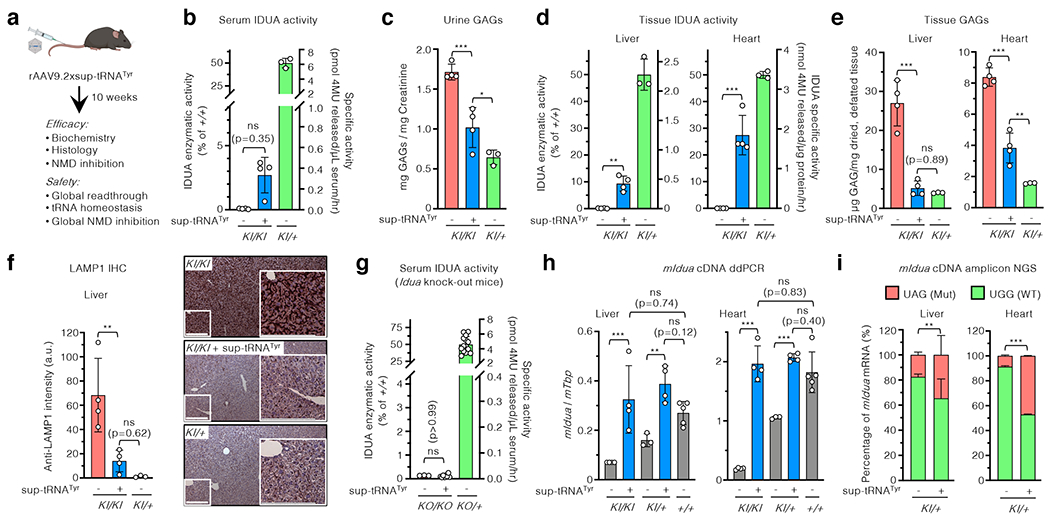
Figure 3. rAAV9.2xsup-tRNATyr treatment rescued MPS-I phenotype in mice.

a, Workflow to assess in vivo rAAV9 delivery of the 2xsup-tRNATyr expression cassette in male IduaW401X/W401X knock-in mice (KI/KI). b-f, Serum IDUA enzymatic activity (b), urine GAG levels (c), tissue IDUA enzymatic activity (d), tissue GAG levels (e), and representative LAMP1 immunohistochemistry images and quantification of liver sections (f) in KI/KI mice with (+) or without (−) rAAV9.2xsup-tRNATyr treatment at 10 weeks post treatment (n=4 per group). In b and d, the right y-axis denotes absolute IDUA specific activity, and the left y-axis denotes relative activity normalized to untreated heterozygous mice (KI/+) (n=3) as 50% of wildtype (+/+) level. In f, scale bar=200 μm. g, Serum IDUA activity in KO/KO mice with (+) or without (−) sup-tRNATyr treatment (n=3 and 8, respectively) and KO/+ without sup-tRNATyr treatment (n=14). h, Droplet digital PCR (ddPCR) quantification of mouse Idua cDNA in the liver and heart of KI/KI (n=4), KI/+ (n=4), or +/+ (n=5) mice, with (+) or without (−) rAAV9.2xsup-tRNATyr treatment. i, Next generation sequencing (NGS) quantification of targeted mouse Idua cDNA amplicons in the liver and heart of KI/+ mice, with (+) or without (−) rAAV9.2xsup-tRNATyr treatment (n=4 per group). The percentage of Idua cDNA harboring the W401X mutation [UAG(Mut), orange] or WT sequence [UGG(WT), green] is shown. Statistical analysis in (i) was performed by two-sided Fisher’s exact test. In b-h, statistical analysis was performed by one-way ANOVA followed by two-sided Dunnett’s multiple comparisons test; data are mean ± s.d. of individual animals (circles). *p < 0.05, **p < 0.01, ***p < 0.001, ns: not significant.
