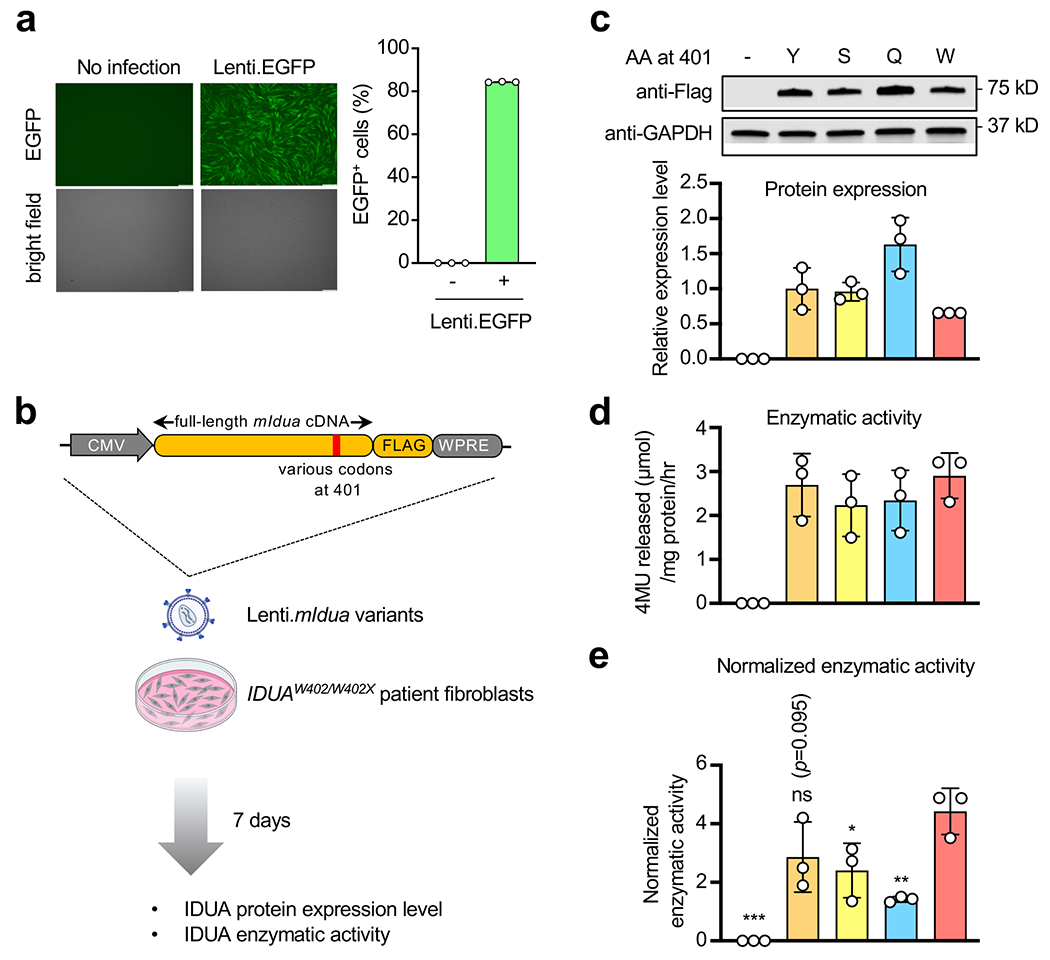
Extended Data Figure 2. Comparable expression level and enzymatic activity among Idua variants.

a, Representative images and quantification of EGFP+ human fibroblasts by flow cytometry following Lenti.EGFP infection. Scale bar=250 μm. b, Workflow to examine mouse Idua cDNA variants expression and IDUA enzyme activity in IDUAW402X/W402X patient fibroblasts. The lentiviral construct expressing FLAG-tagged mouse IDUA variants is shown. c, Representative Western blot images and quantification of relative protein expression of mouse IDUA variants with different amino acid residues at codon 401. d, Absolute IDUA enzyme activity of different mouse IDUA variants. e, IDUA enzyme activity of different mouse IDUA variants normalized to expression level. Data are mean ± s.d. of three technical replicates (a), or of three biological replicates (c, d and e). Statistical analysis was performed by one-way ANOVA followed by two-sided Dunnett’s multiple comparisons (e). *p < 0.05, **p < 0.01, ***p < 0.001, ns: not significant. For gel source data, see Supplementary Figure 1.
